
Election 2026/7 [2] Turnout, Tshwane, the ANC and DA
by The Editor

A comprehensive look at turnout trends in Tshwane, with a focus on the ANC and DA. All-in-all, a marginally better picture for the ANC and DA, but that is only relative to Johannesburg. Both parties have serious problems, and it would seem like higher turnout is the only way either are going to solve them.
Turnout, Tshwane, the ANC and DA
By: Gareth van Onselen
Follow @GvanOnselen
23 September 2025
This essay is the 2nd in an on-going series on Election 2026/7, for all other editions of this series, please click here: Election 2026/7
Introduction
This is the second essay in a series of in-depth, statistically driven analytical essays on the upcoming local government elections (to be held at some point between November 2026 and January 2027). Following our look at Johannesburg, this essay focuses on Tshwane.
Ultimately, we will look at all eight metros, before moving on to some consolidated national analysis. Next will be Ekurhuleni.
Turnout: Tshwane
Our first essay set out the national turnout picture; I would recommend reading that for a refresh and backdrop to the following, which comprises Tshwane only.
The graph below sets out the provincial and local election turnout results for Tshwane. As is typical, the line fluctuates dramatically between the two (provincial = higher; local = lower).
If this pattern holds, the trendline suggests Tshwane is headed for a final turnout percentage somewhere in the 30–40% bracket.
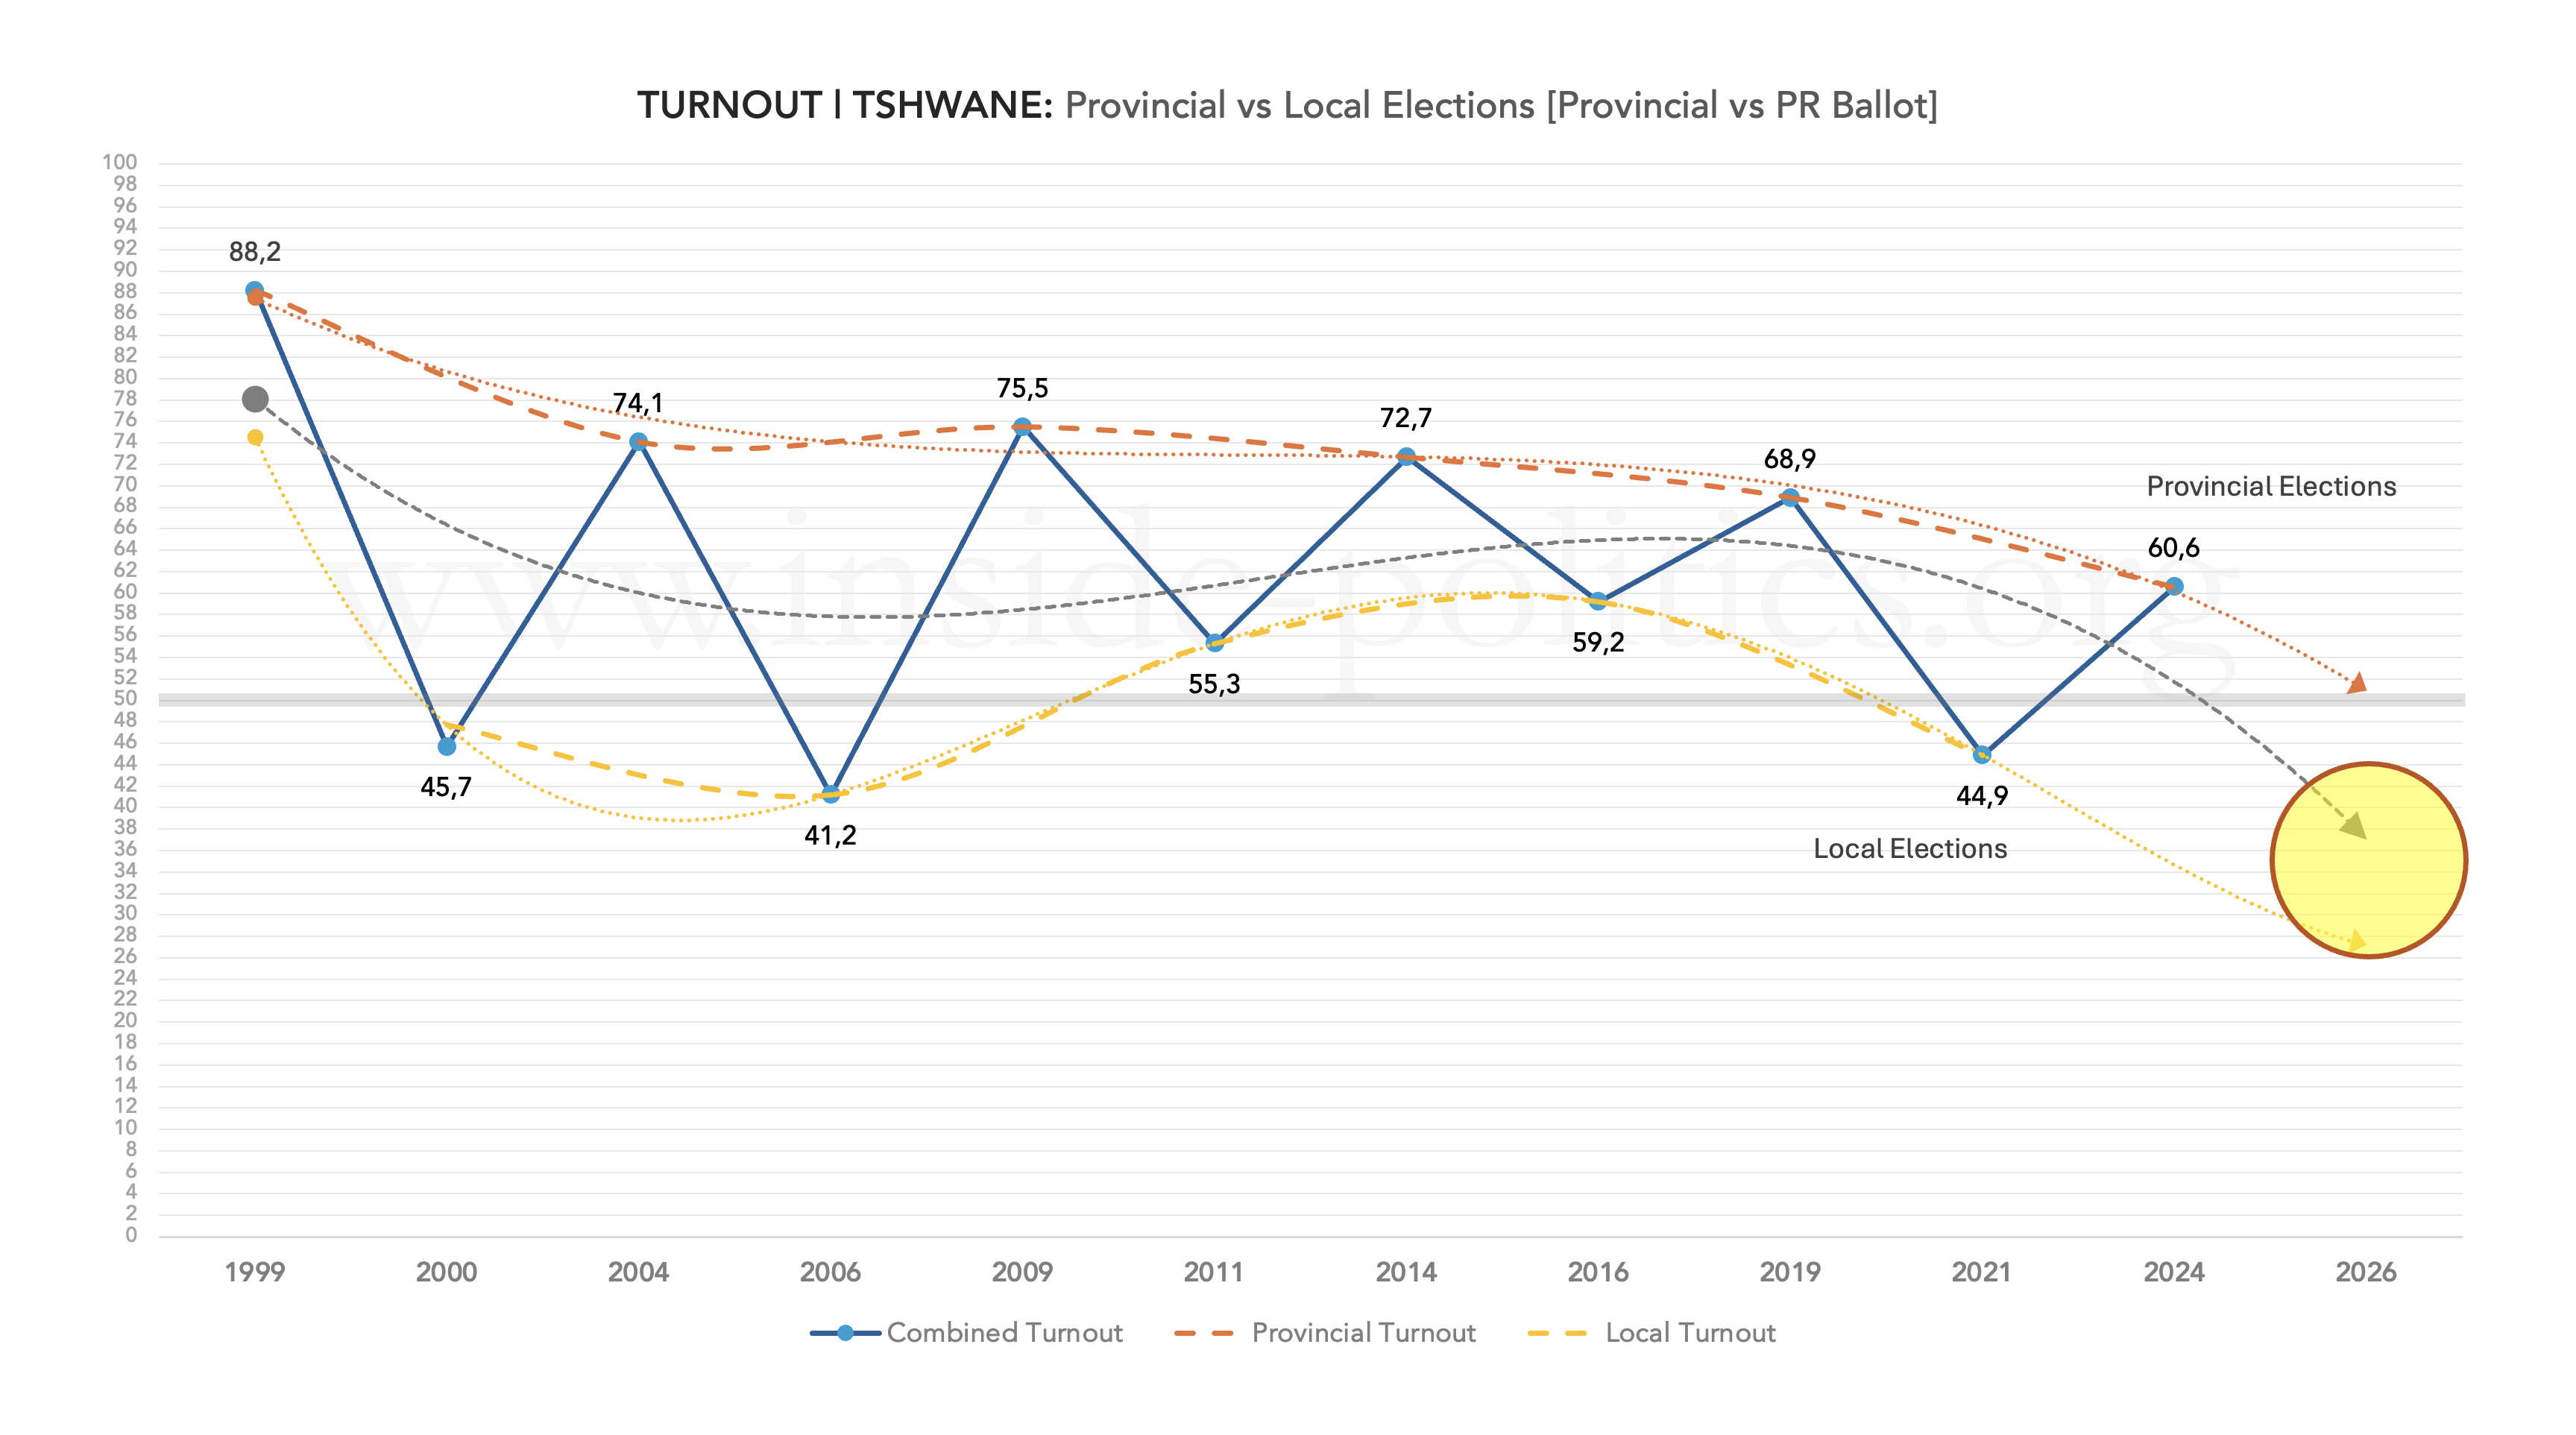
The entire graph sits slightly higher than the Johannesburg graph, so Tshwane residents are historically slightly more enthusiastic than their counterparts. For example, turnout in the last local government elections (2021) was 44.9% in Tshwane, compared to 41.6% in Johannesburg. These small differences can make a big impact in an urban centre, where opposition voters are more populous.
And, because the ANC vote tends to mirror national turnout trends, this is bad for the ANC in Tshwane, as the graph below—which maps the ANC’s vote share—illustrates.
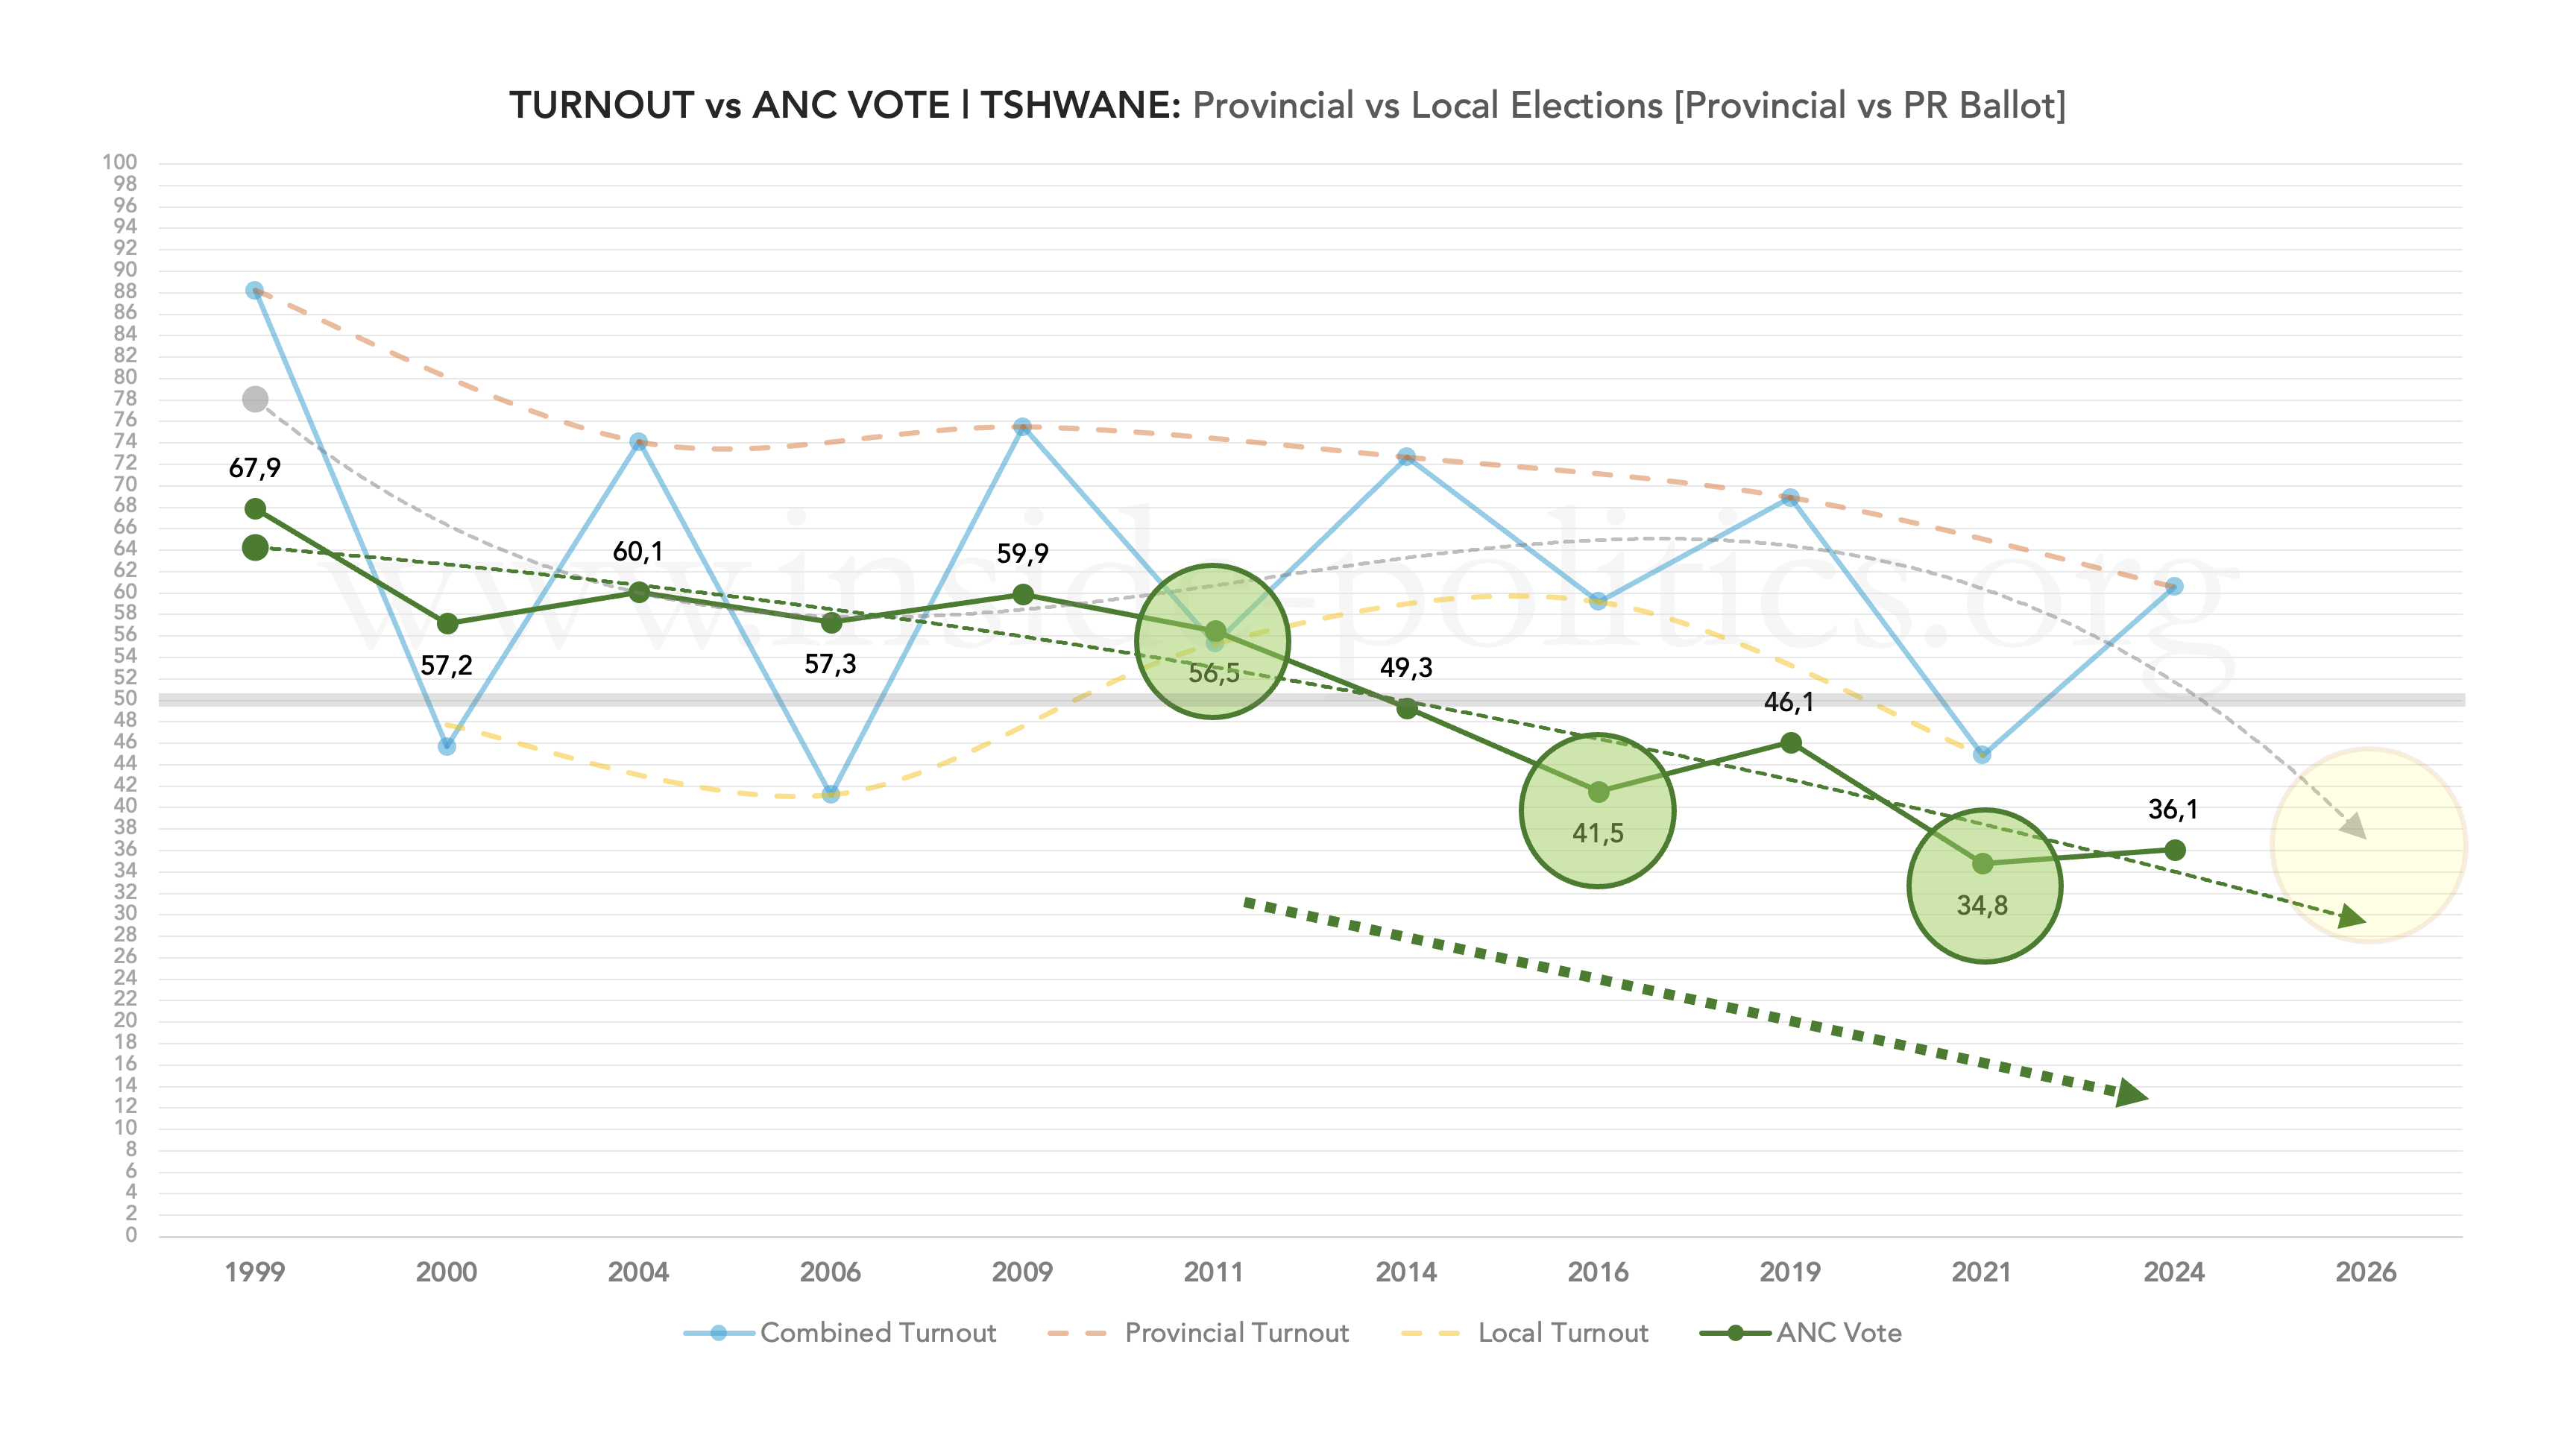
There has, just like turnout, been a significant and, recently, exponential decline in the ANC’s vote share in this metro, down from an all-time high of 67.9% in 1999, to an all-time low of 34.8% in 2021 (a drop of 33.1 pts). With regard to local elections only, it has dropped from a high of 57.3% (2006) to a low of 34.8% (2021), a drop of 22.5 pts—most of that coming in the last two local elections (2016 and 2021).
As we make our way through the eight metros, I’ll add the ANC’s and DA’s performance in each one to a consolidated chart, for ease of comparison. On the ANC’s consolidated chart (below), you can see how it compares to Johannesburg.
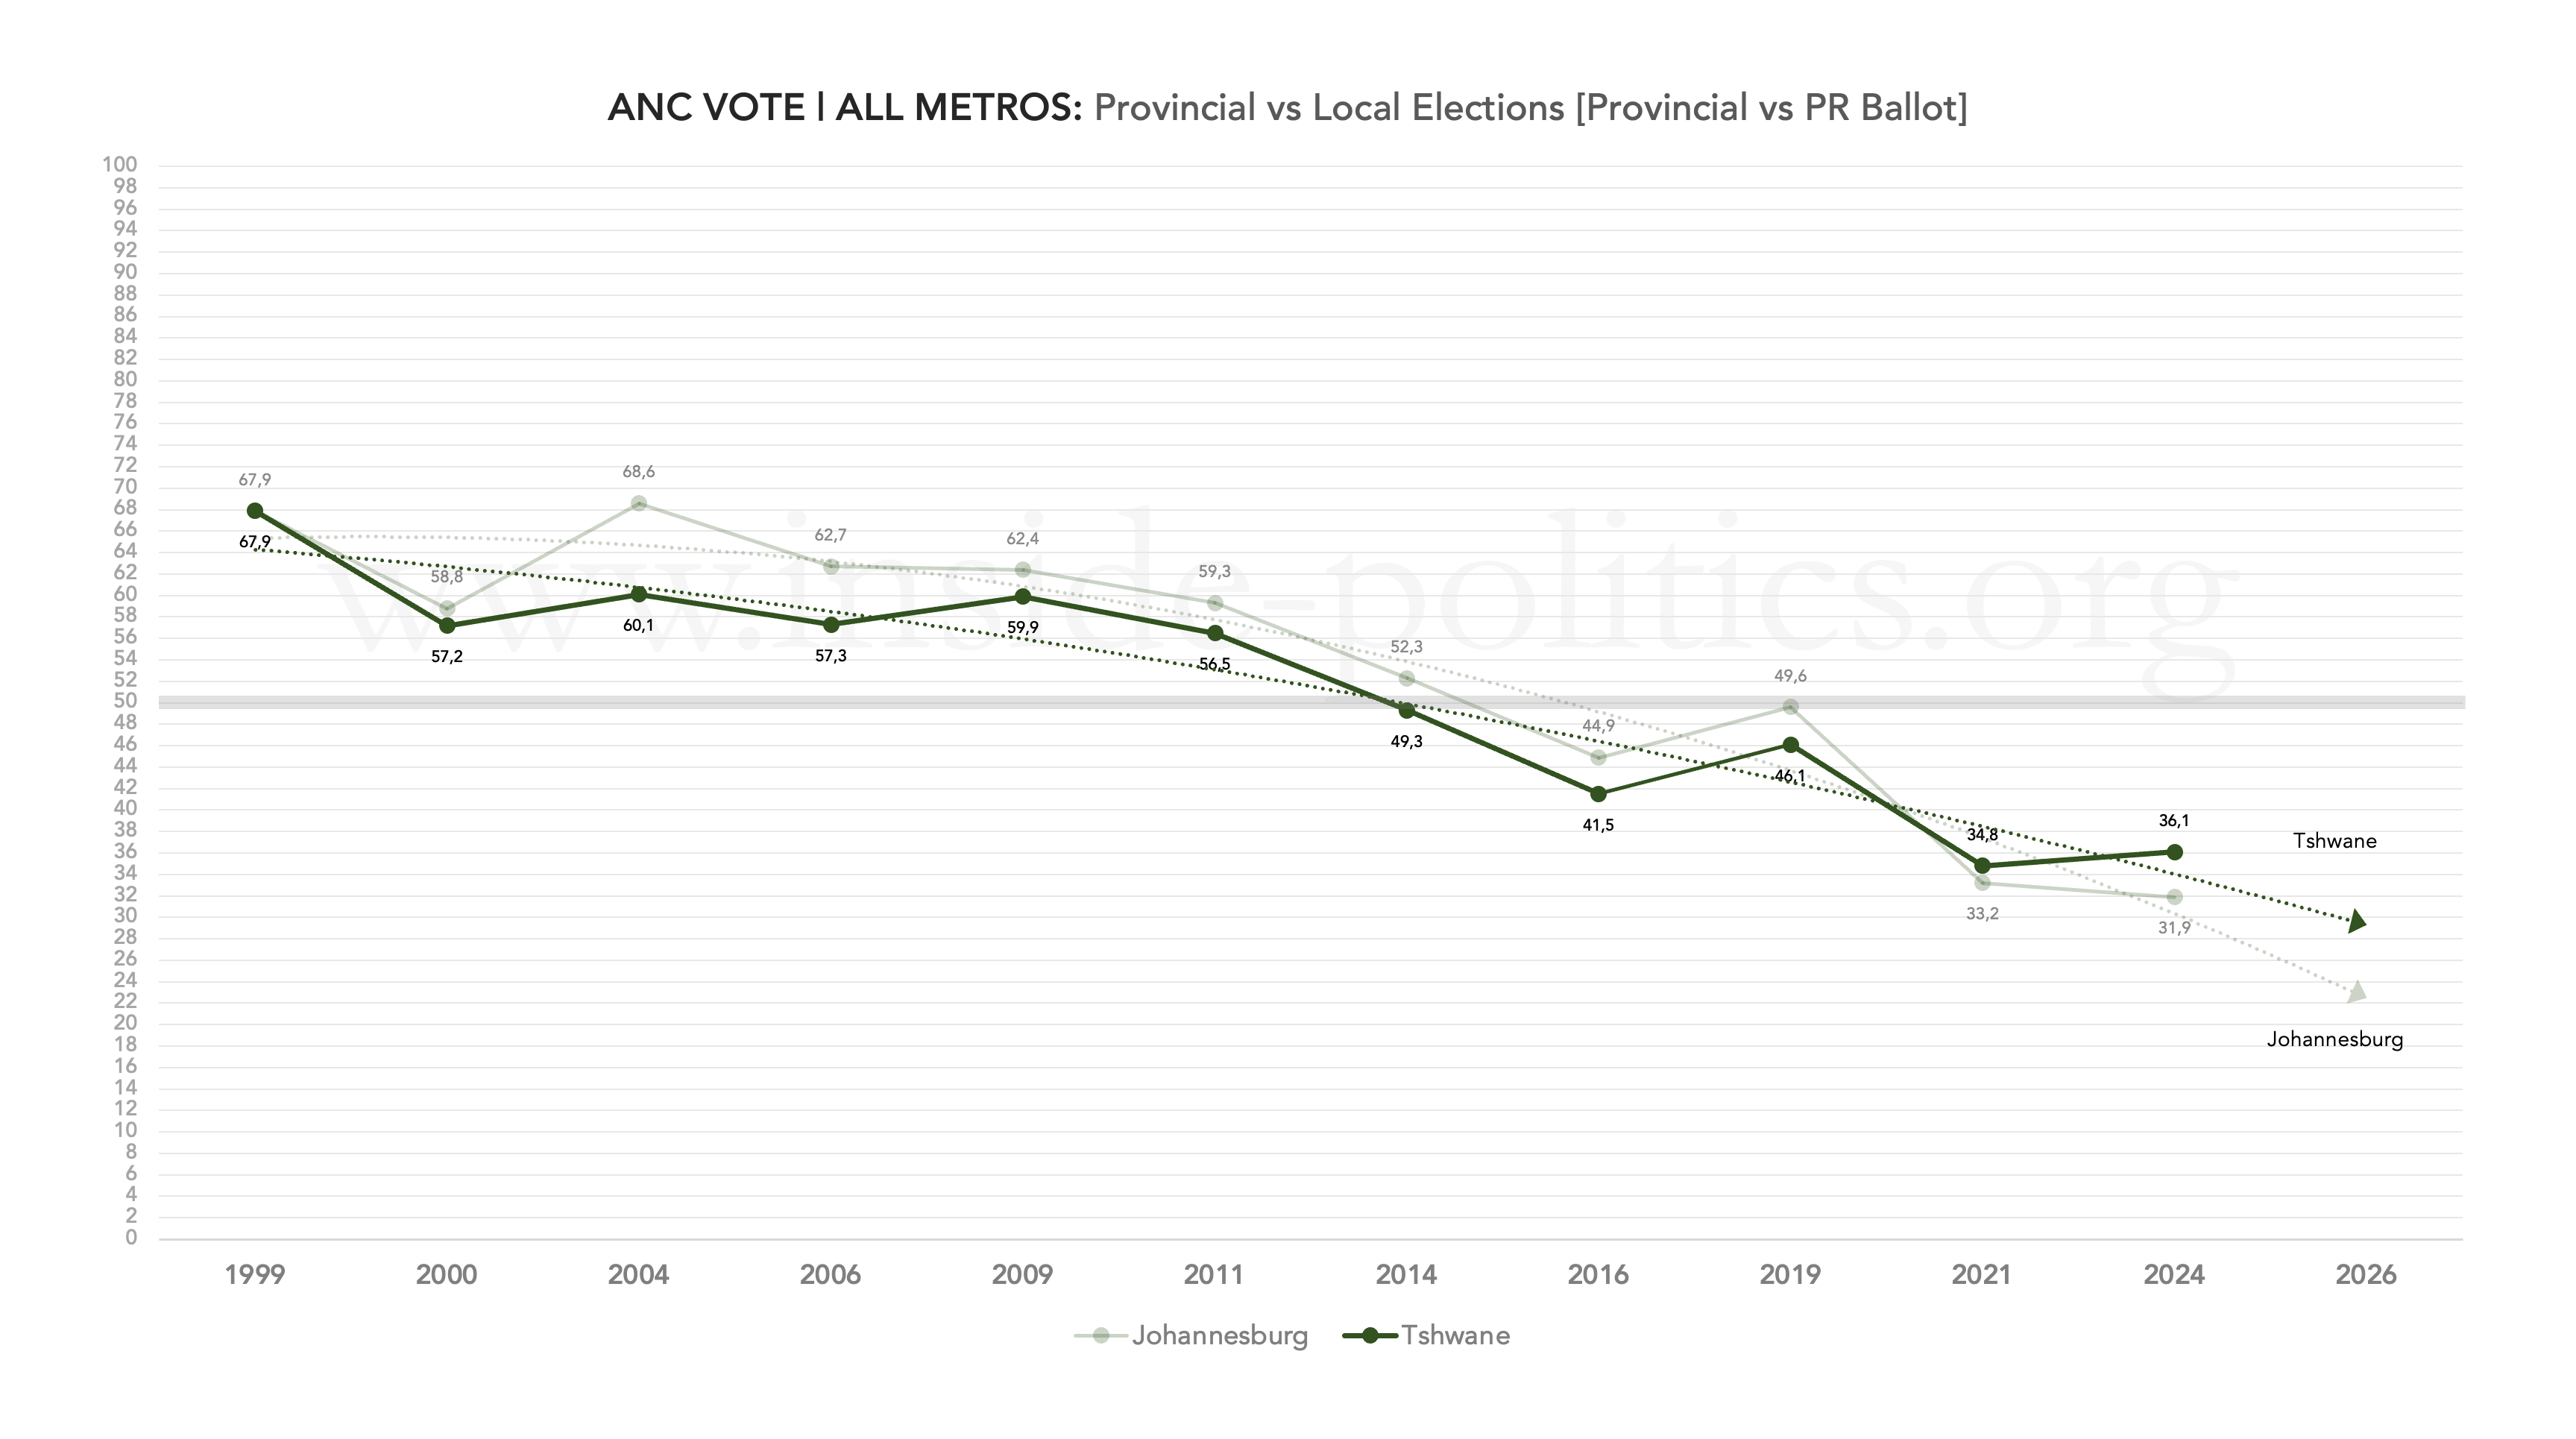
This graph does reveal one hopeful thing for the ANC. Although relative, it did overtake its performance in Johannesburg in 2021 (just) and 2024 (significantly). More importantly still, it did manage a slight “bump” in 2024, which will be encouraging for the party, at least in comparative terms. However, these things are relative, and the ANC in Tshwane, just like in Johannesburg, is in serious decline.
Slumps and bumps
The ANC’s traditional “slump” in local elections has worsened in Tshwane:
- 2004–2006: dropped 2.8 pts
- 2009–2011: dropped 3.4 pts
- 2014–2016: dropped 7.8 pts
- 2019–2021: dropped 11.3 pts
As the party managed just 36.1% in the last national elections, the historical data suggests, if the ANC isn’t on the verge of a cliff, it has already fallen off and is now in free fall in this metro. Its trendline suggests it is headed for the 20–30% bracket. An 11-pt slump in 2026/7 (the same as 2021) would put it on 25%.
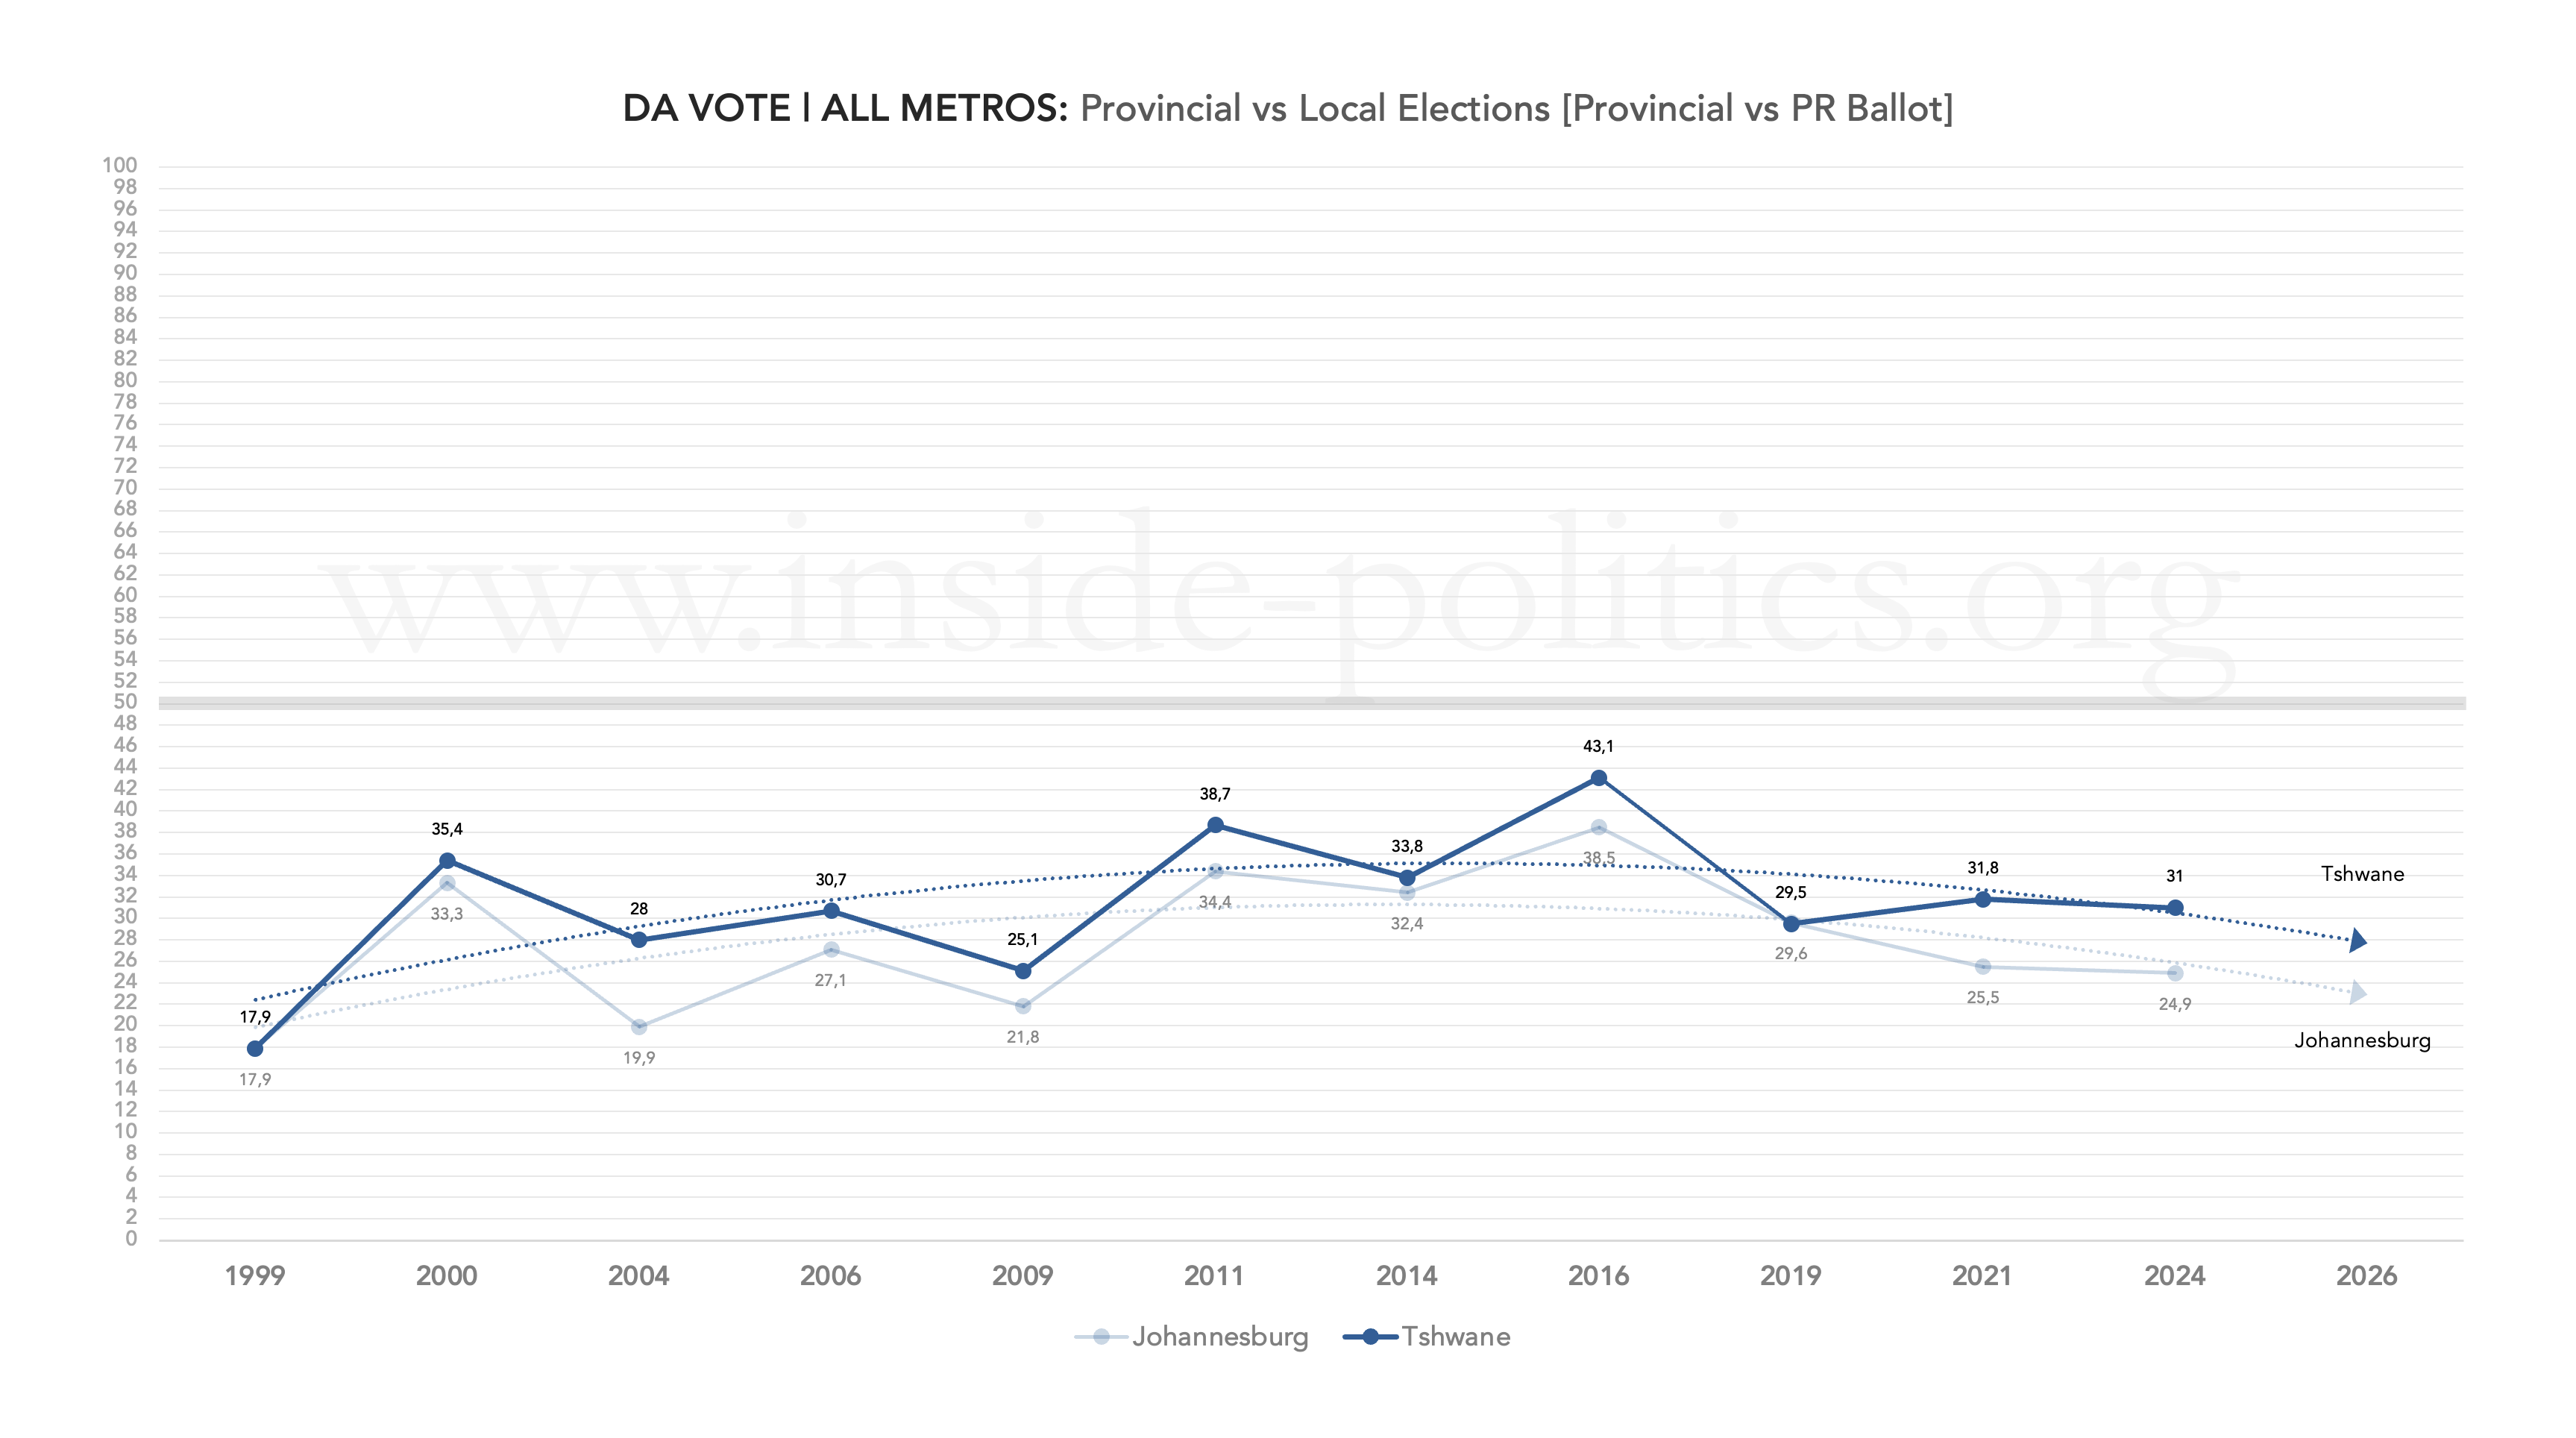
The DA, by comparison, fares a little better in Tshwane than it does in Johannesburg. But not by much. Its vote share in Tshwane over time looks like this (below):

There were significant electoral “bumps” for the DA in 2011 and 2016, and a much smaller one in 2021, which will be the subject of considerable concern for the party. As with Johannesburg, the DA in Tshwane needs to inject some real enthusiasm into its voters and potential voters alike, if it is going to take full advantage of the ANC’s decline.
But the situation is not as bad as in Johannesburg, where the party’s local election “bump” went negative in 2021. In Tshwane, that differential looks like this:
- 2004–2006: gained 2.7 pts
- 2009–2011: gained 13.6 pts
- 2014–2016: gained 9.3 pts
- 2019–2021: gained 2.3 pts
2.3 pts in 2021 is far from ideal, but it does suggest, in Tshwane, the DA has a better prospect of disproportionate turnout than it does in Johannesburg.
Tracking the DA’s vote share over time, and against Johannesburg (below), shows how the party performs slightly better in this metro and, as with previous elections, it is the urban centre where the DA is strongest, outside of Cape Town.
Let us now map the ANC’s and DA’s “provincial vs local” differentials (below).
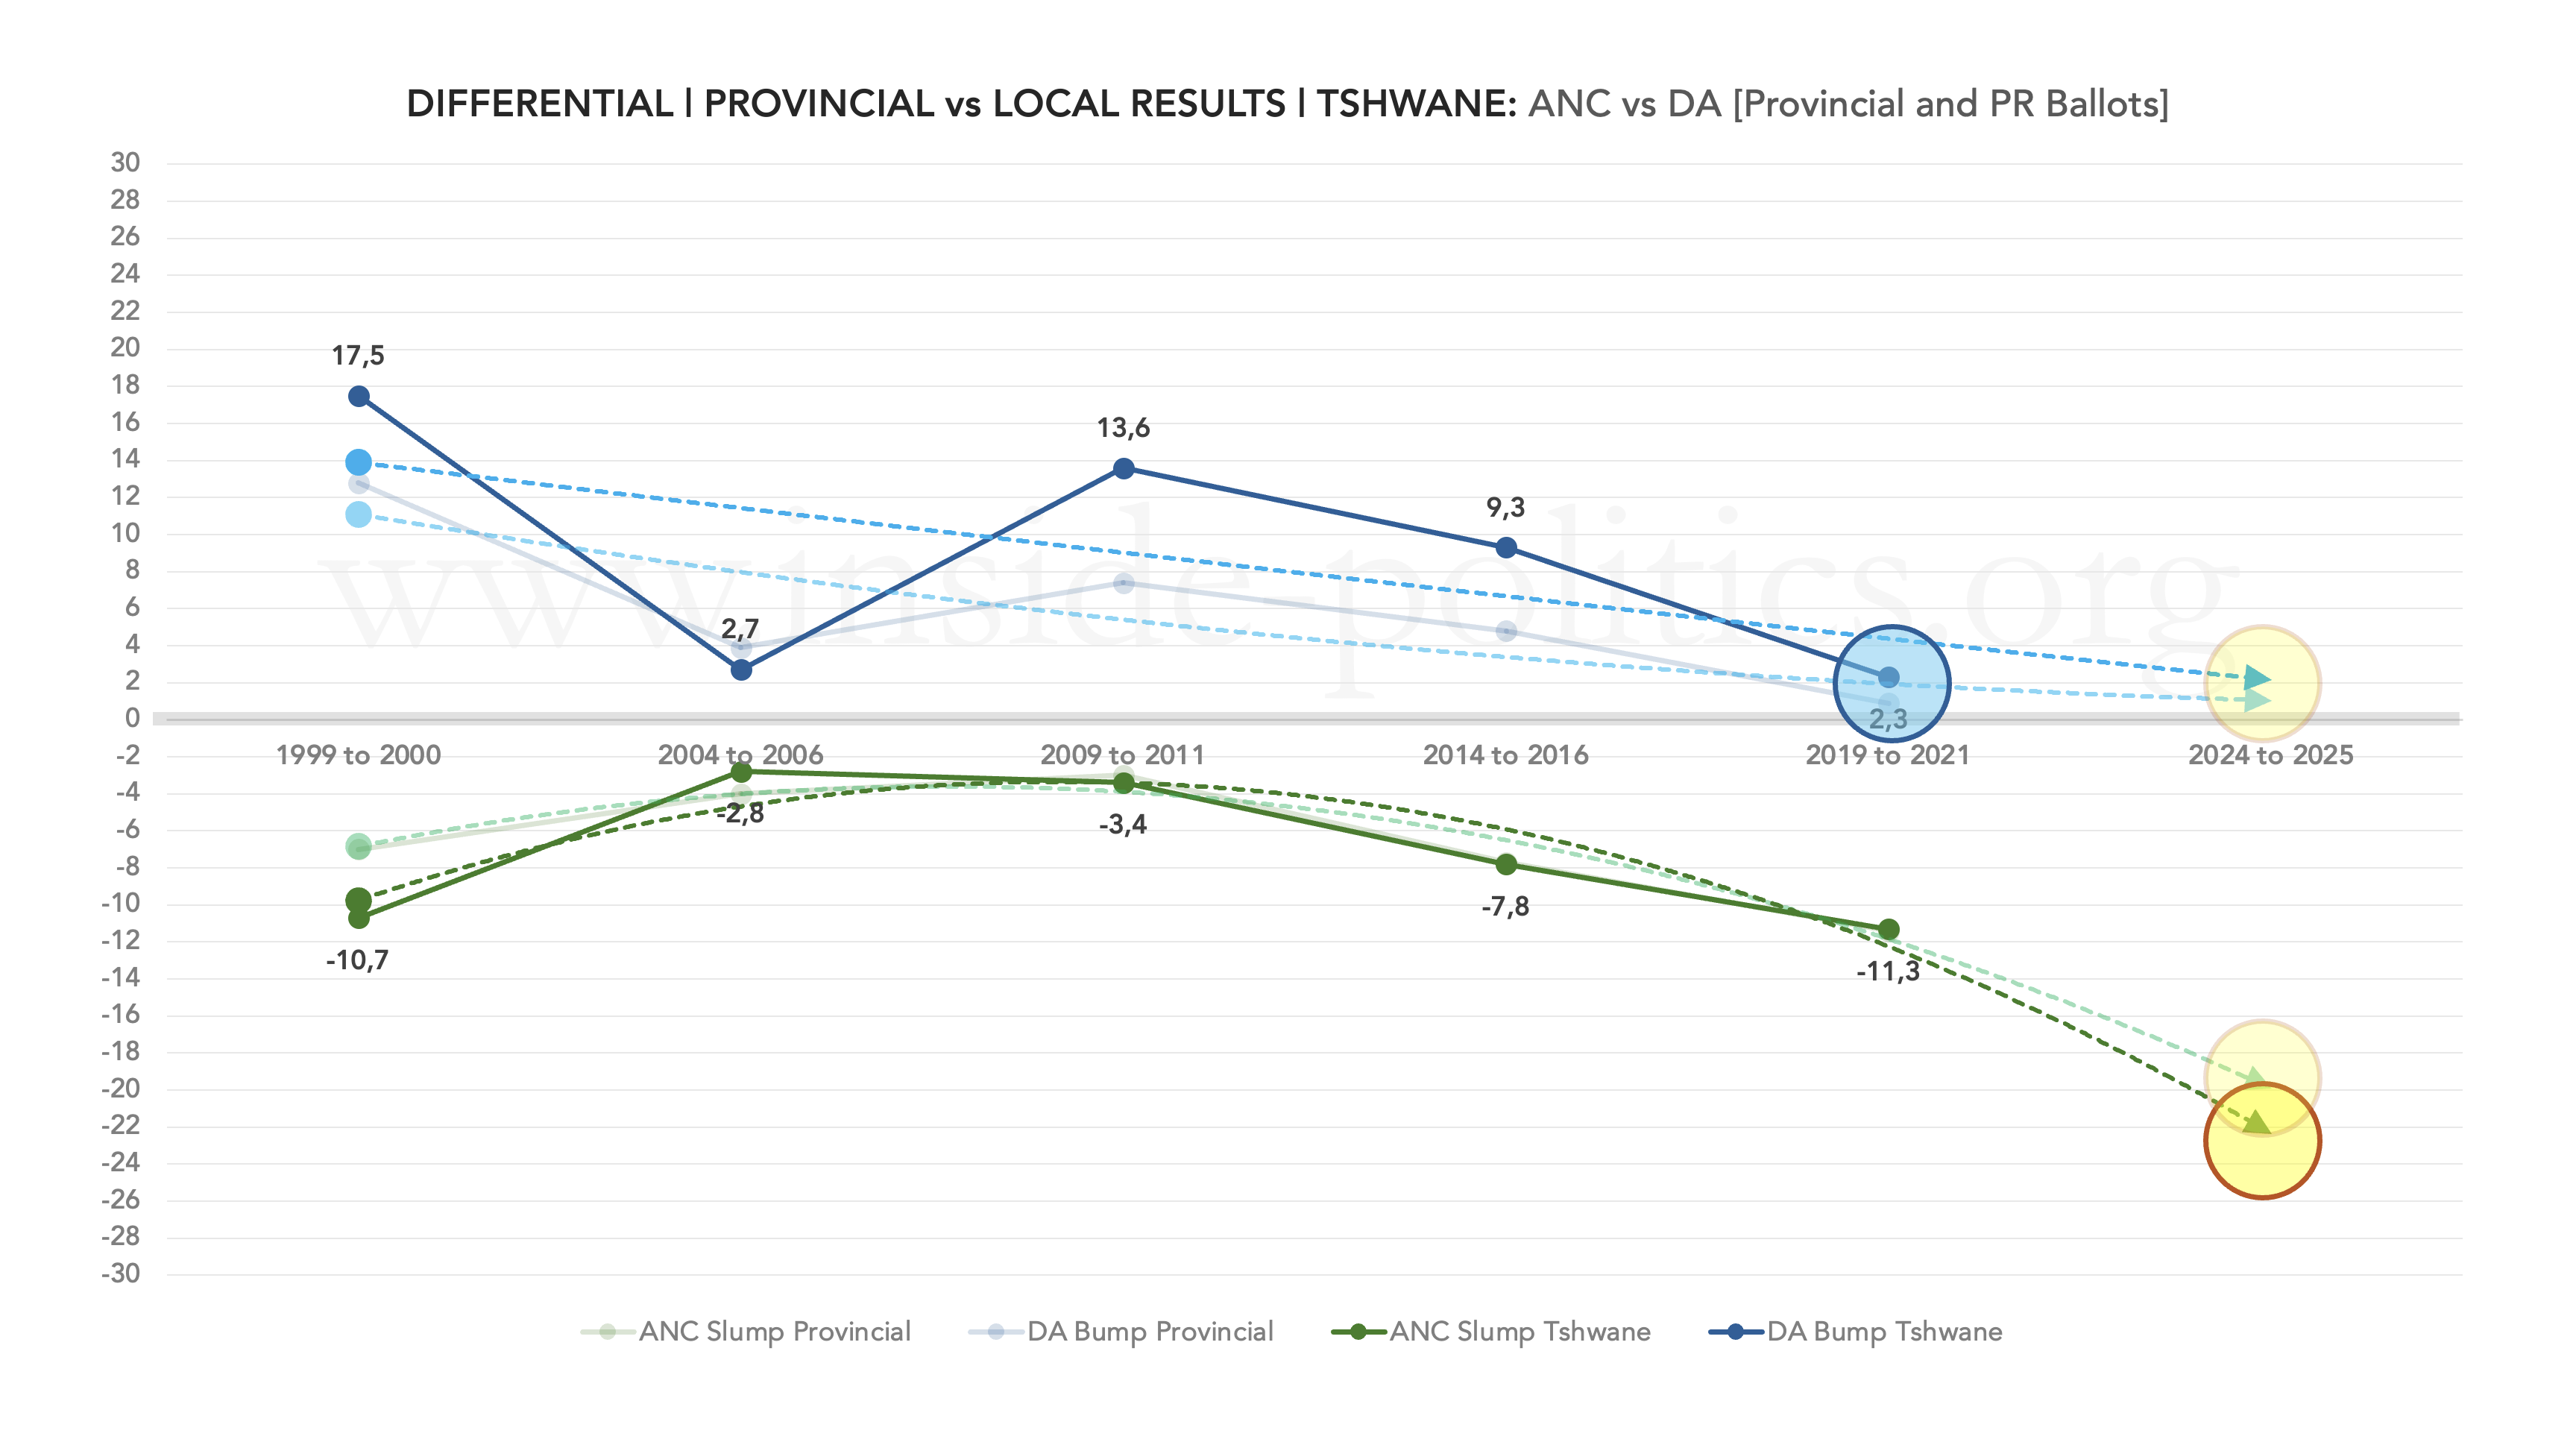
Both parties are in decline—the DA’s “bump” is getting smaller; the ANC’s “slump” is getting bigger, and exponentially so. You can see from this graph, if the DA manages just the smallest kick upwards in 2026/7, the gap between it and the ANC (which would need a miracle to reverse its decline) will immediately grow significantly and to the DA’s advantage. That said, the party is going to have to buck a trend to do that.
If we plot the ANC and DA vote share together (below), as with Johannesburg, you can see what a special election 2016 was for the DA, and where the ANC’s slump and the DA’s bump cross, giving the DA the majority for the first time. It is the kind of performance the DA needs to replicate in 2026/7.

A ward-by-ward view of Tshwane turnout
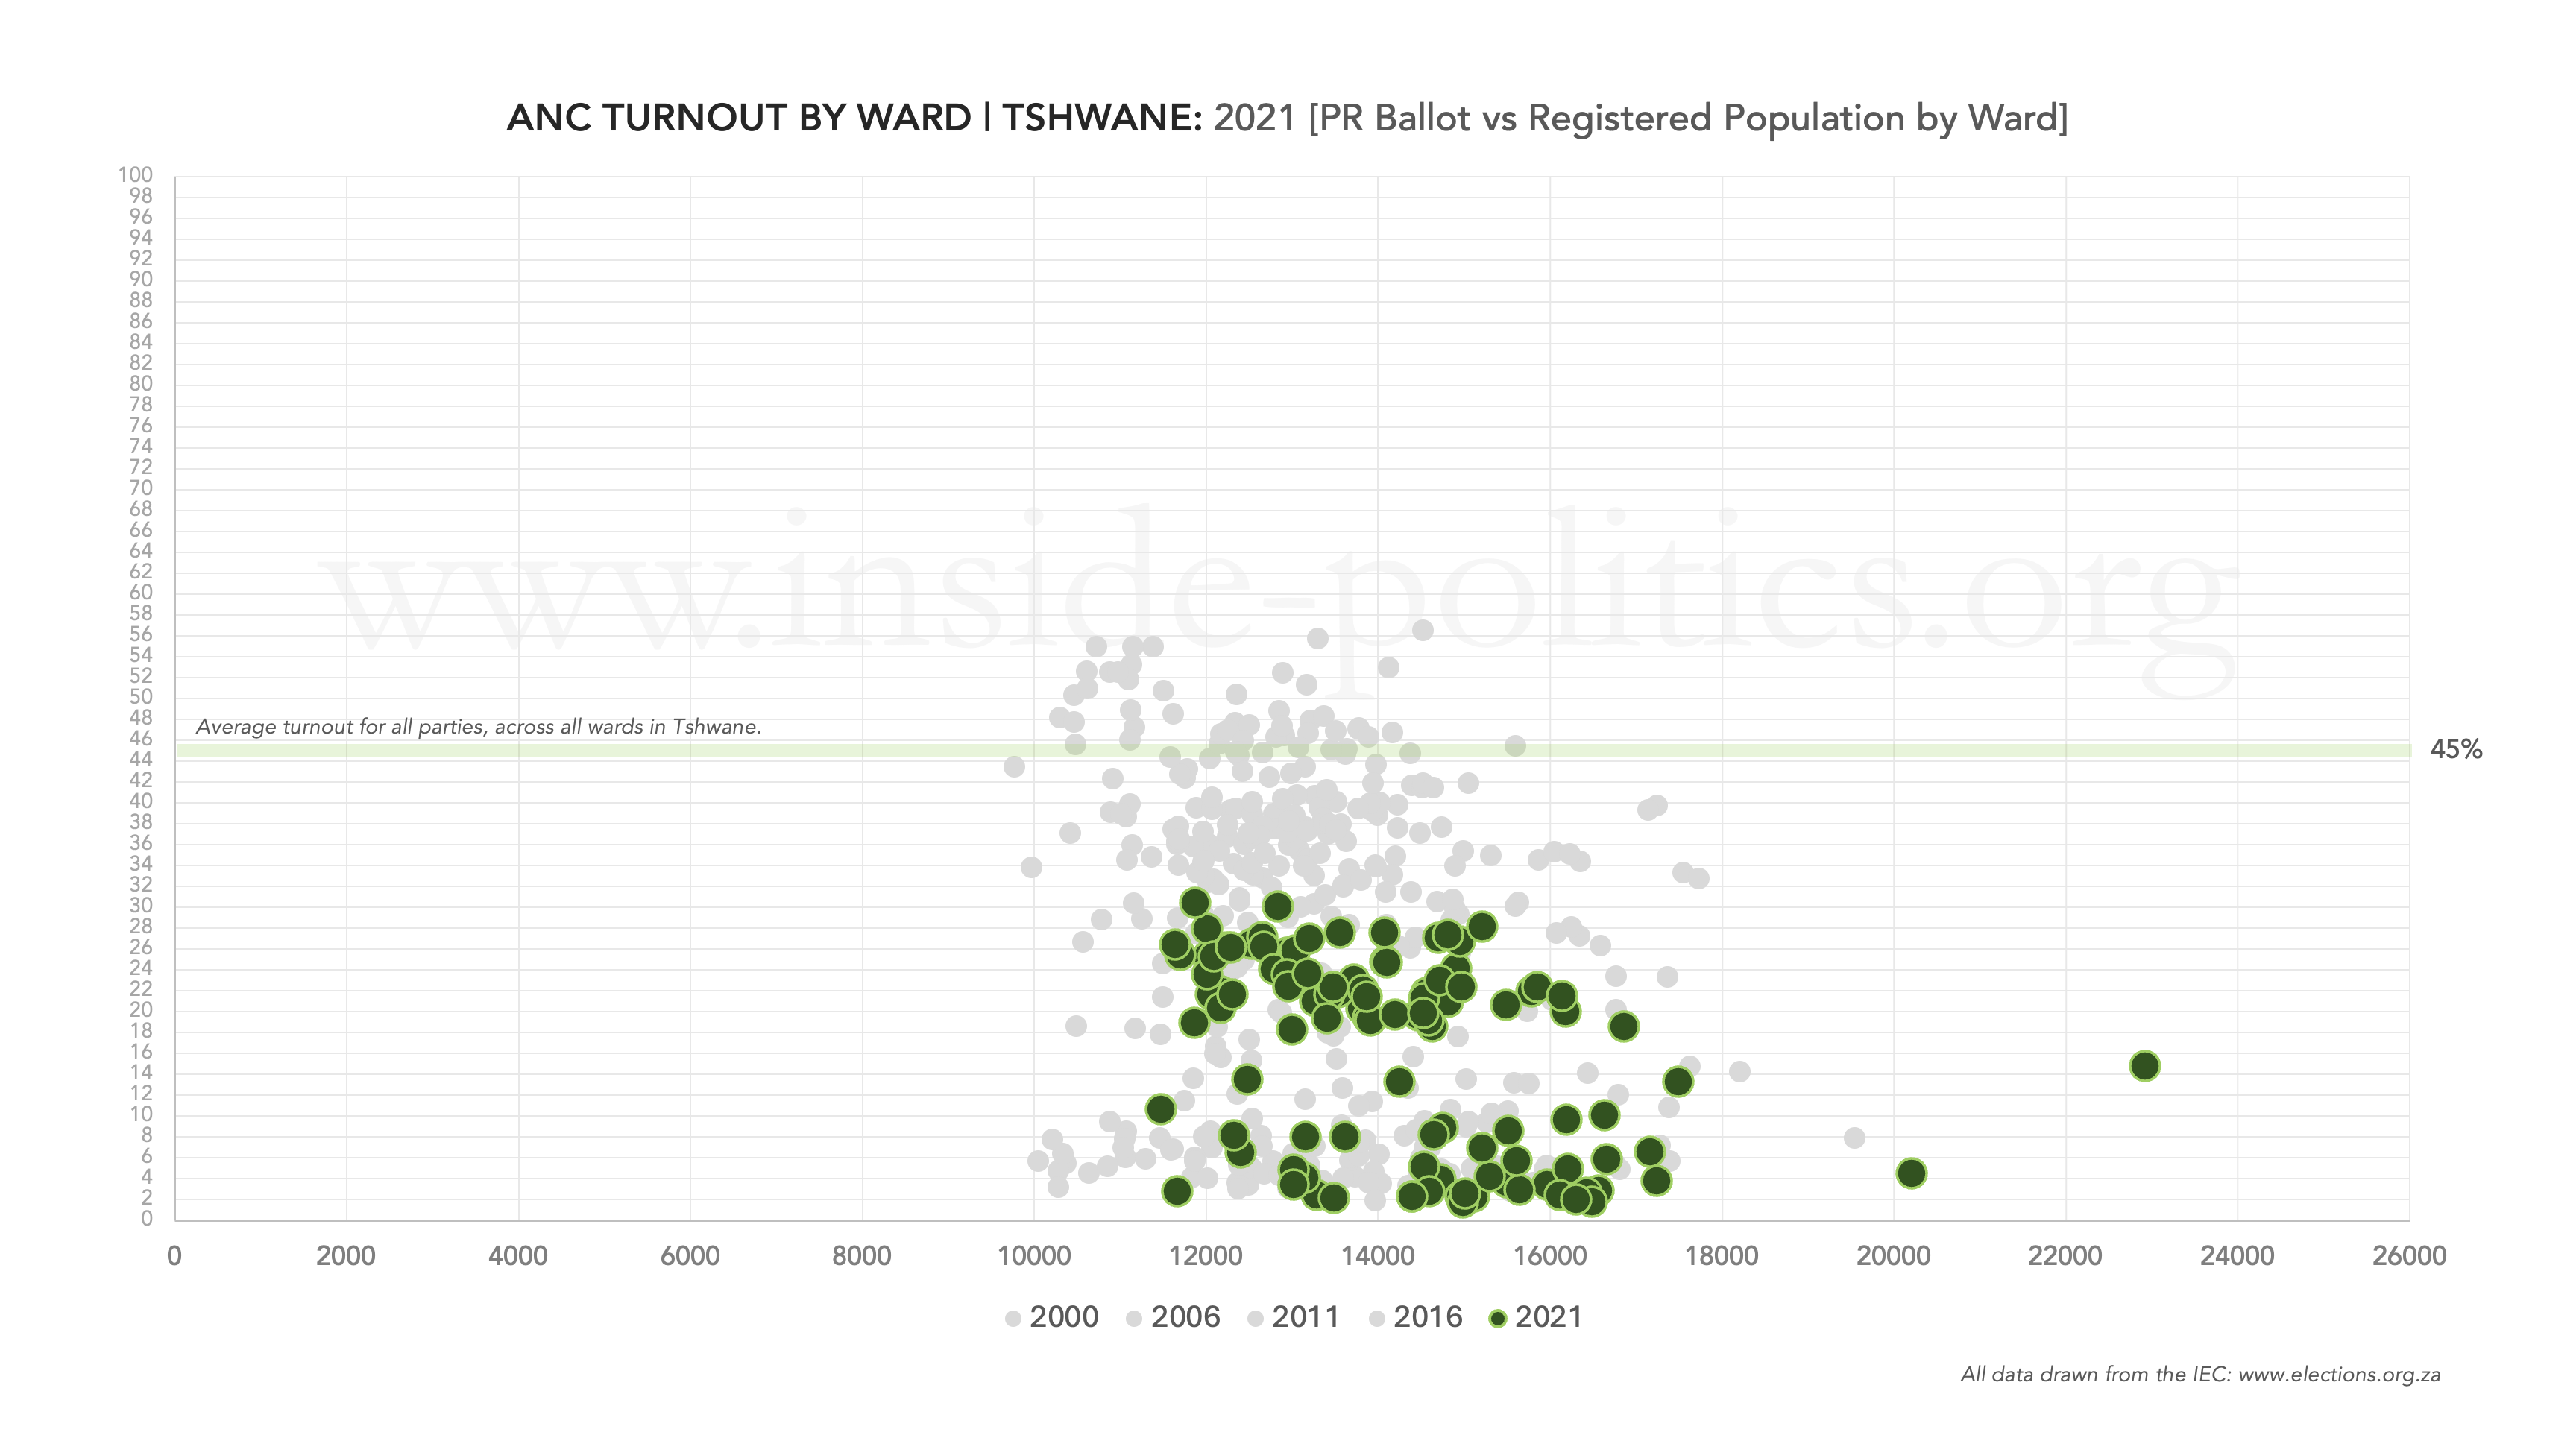
Let us now look at the ANC’s and DA’s performance at a more granular level, by the results in every ward in Tshwane, for all five of the last local government elections (2000, 2006, 2011, 2016 and 2021), starting with the ANC.
The scatter graph below shows ANC turnout (the ANC’s PR vote divided by the total registered voting population) in every ward in Tshwane, for 2000–2021 (every dot is a ward). The ANC’s turnout percentage runs up the Y-axis, and the size of the ward (in terms of registered voters) runs along the X-axis. So, what you want as a political party are dots up and towards the right-hand corner (big ward/high turnout).

Across all five elections, the ANC has an even spread of dots. But the consolidated graph masks some good elections and some bad ones. If we isolate the dots for a given year, we can see the difference. 2011 (below) was a good election for the ANC.

Notice the cluster of wards on or above the turnout average (55%) for 2011. ANC voters were enthused and turned out in relatively high numbers. 2016 (below) saw the beginning of a decline for the ANC. The primary cluster of ANC wards drops below the turnout average (59%).

It was 2021, however, that really cemented the ANC’s decline (below). The cluster of best-performing ANC wards drops significantly below the turnout average (45%), as a lack of enthusiasm squeezes them into an ever-narrowing band near the bottom.
If we turn to the DA now, the consolidated graph of all wards across all elections (below) demonstrates a far less even spread than the ANC. The bulk of wards are squashed into a group at the bottom—representing a significant number of wards where the DA gets very few votes. Instead, it relies on a smaller number of high-performing wards.
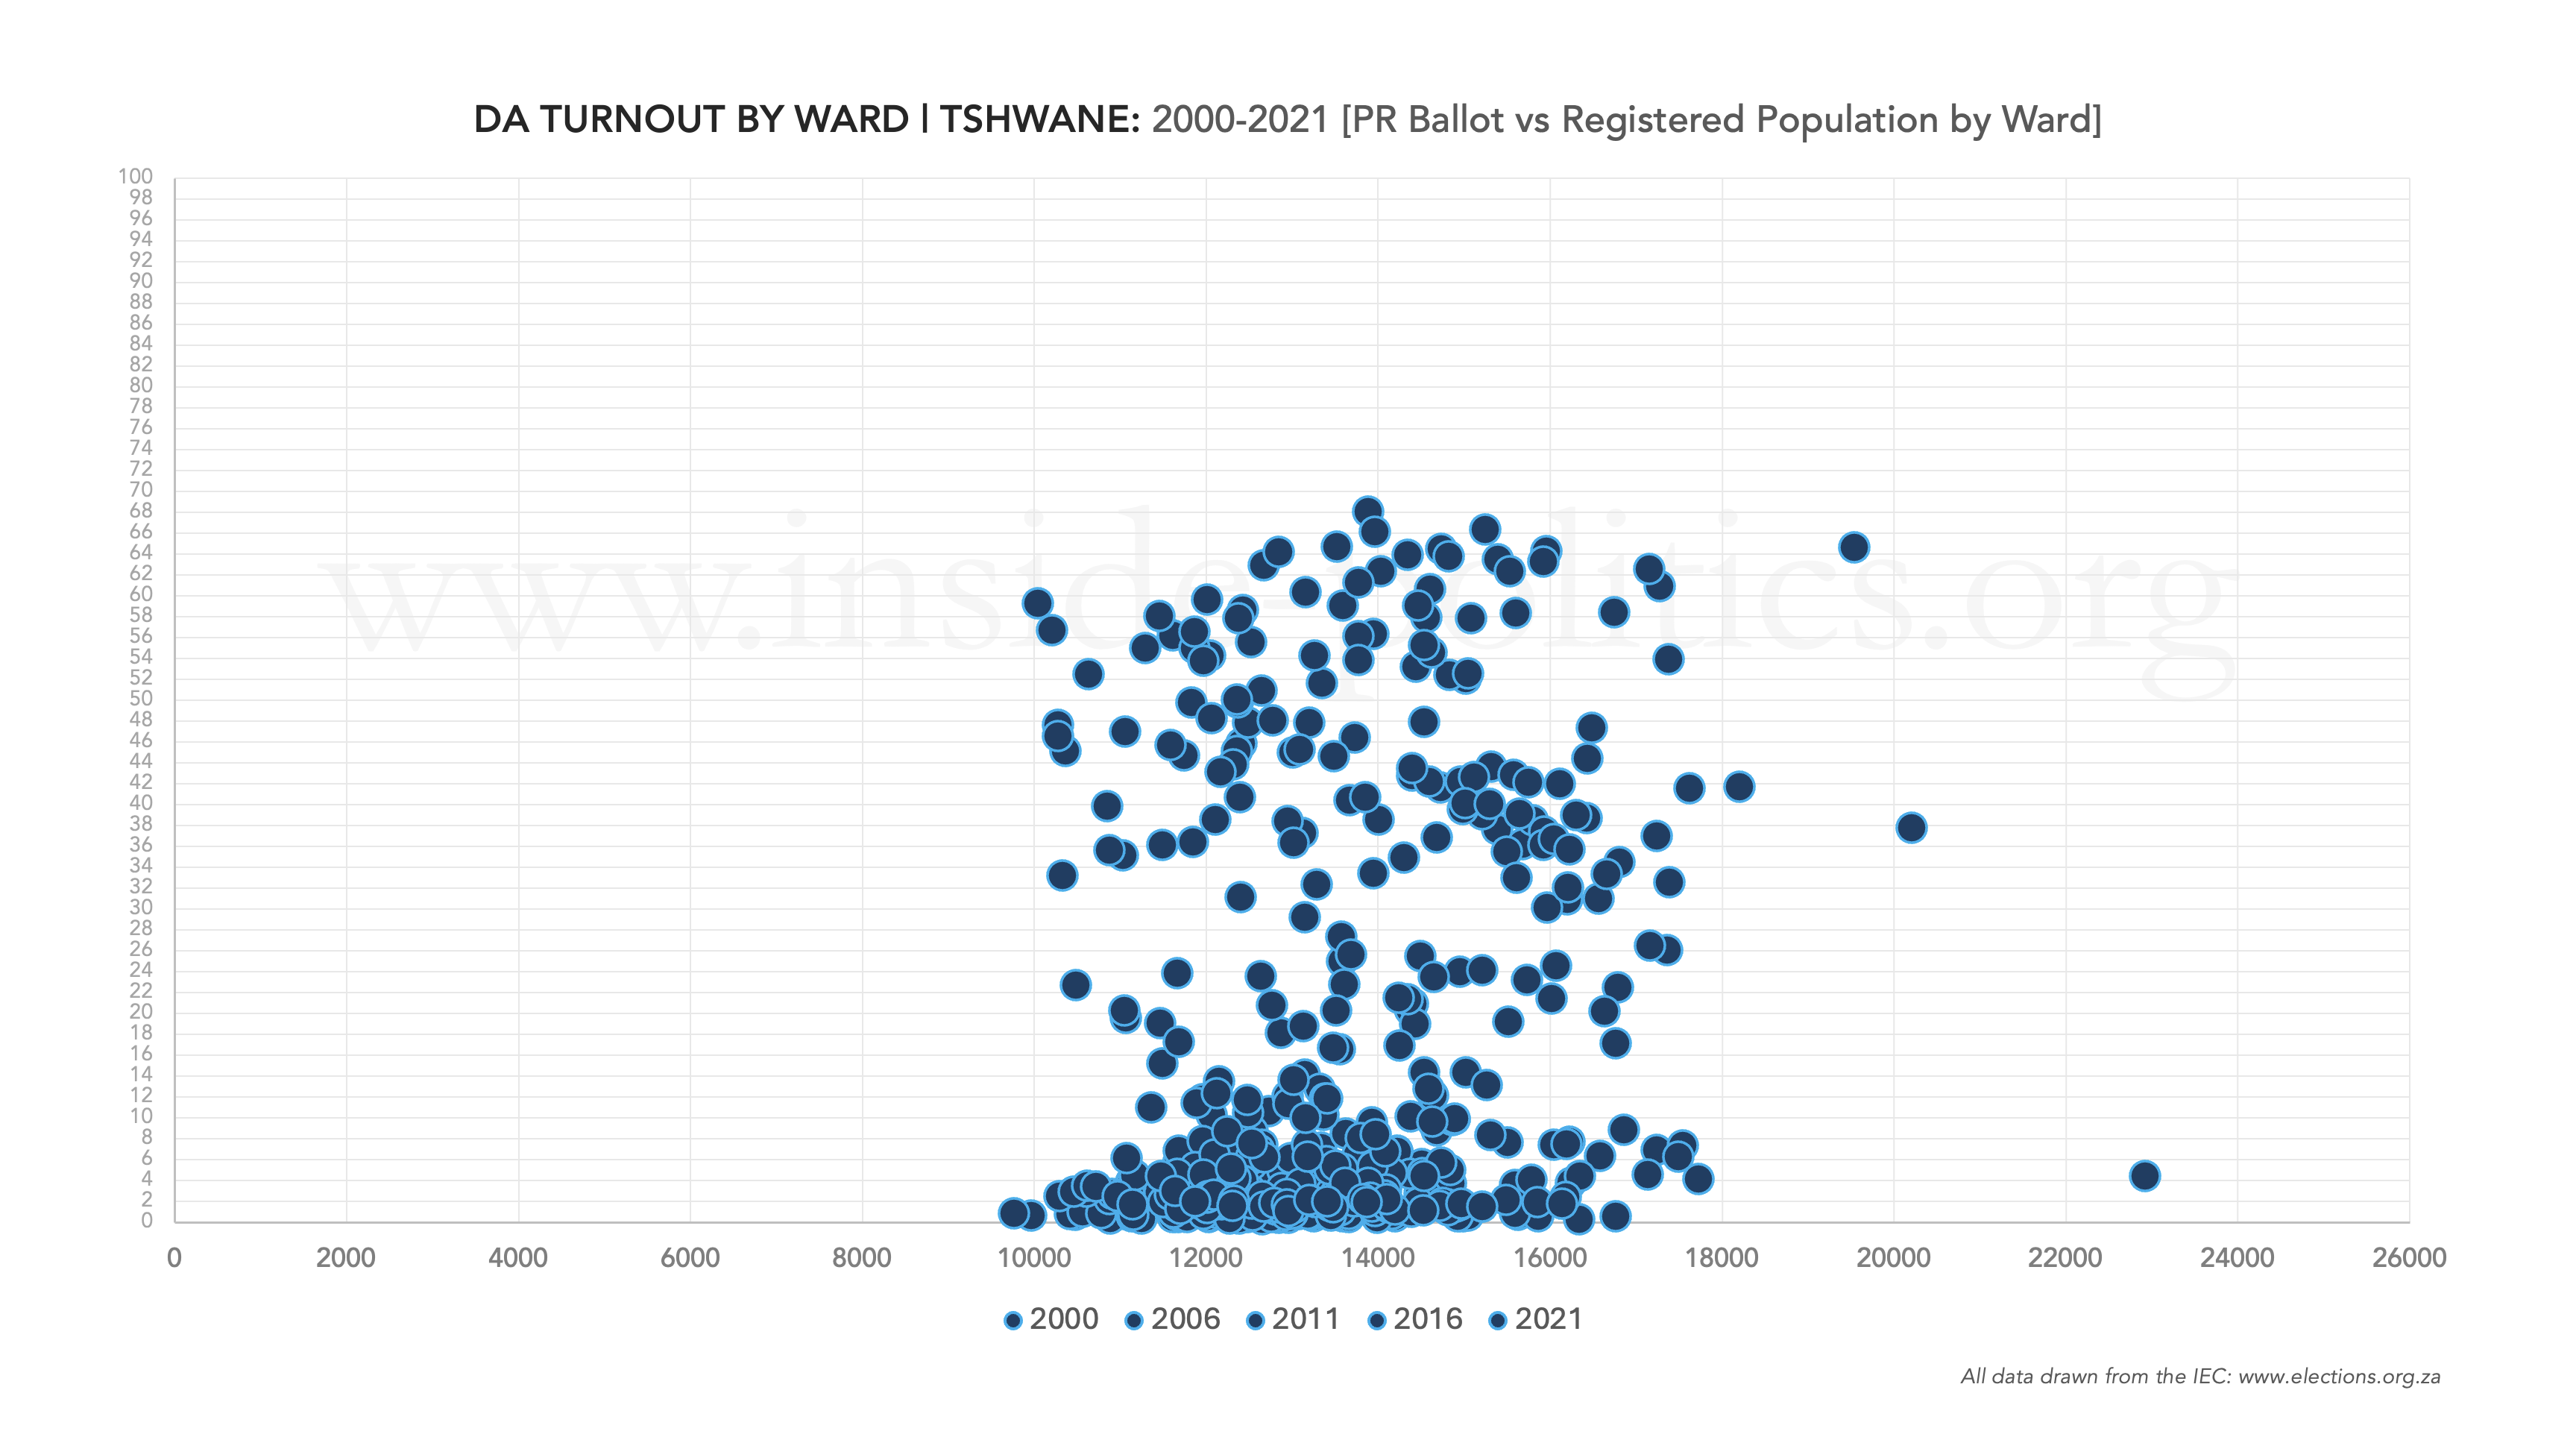
If we highlight just the wards for 2016 (below)—the DA’s best local government result by some distance—you can immediately see, like the ANC in 2011, how the cluster of the DA’s best-performing wards consolidates mostly above the turnout average (59%). And 59% is very high, so this is doubly impressive. In turn, and equally important, at the bottom of the graph, the remaining wards rise marginally above the floor, meaning the DA produced a small amount of support in a great many “non-DA” wards. These two things together delivered it a majority.

The DA’s problems in 2021 (below) are not as bad as Johannesburg. Its best-performing wards still managed to hover around the turnout average (45%), but given the drop in that average, they counted for far less and all those wards where the DA managed some nominal support in 2016 dropped back down to the floor.

Trade-offs
There is one final way of demonstrating good and bad elections for both the ANC and the DA. And that is to see how the votes of each party are affected by the performance of the other. If ANC votes go up, do DA votes go down?
To do this we again need to plot every ward as a dot on a grid. But, in this case, each dot represents the change in support. If the ANC did well in the ward, the dot moves up. If the DA did well, the dot moves to the right. In this way, we can split the chart into four quadrants:
- Q1 (top left): ANC up, DA down
- Q2 (top right): ANC up, DA up
- Q3 (bottom left): ANC down, DA down
- Q4 (bottom right): ANC down, DA up
So, from the ANC’s perspective, a good election is when a large number of dots are in Q1 (ANC up, DA down). From the DA’s perspective, a good election is when a large number of dots are in Q4 (ANC down, DA up). And from both parties’ perspective, the place you don’t want to be is Q3 (ANC down, DA down).
Because wards change, we can’t run this for all election years (you need consistent wards between elections to see the change), but we can run it for 2000 to 2006 (no ward change, 76 identical wards in both), 2011 to 2016 (not identical—105 to 107—but 105 are comparable) and 2016 to 2021 (no ward change, 107 identical wards).
If we do that, we get the following three graphs:
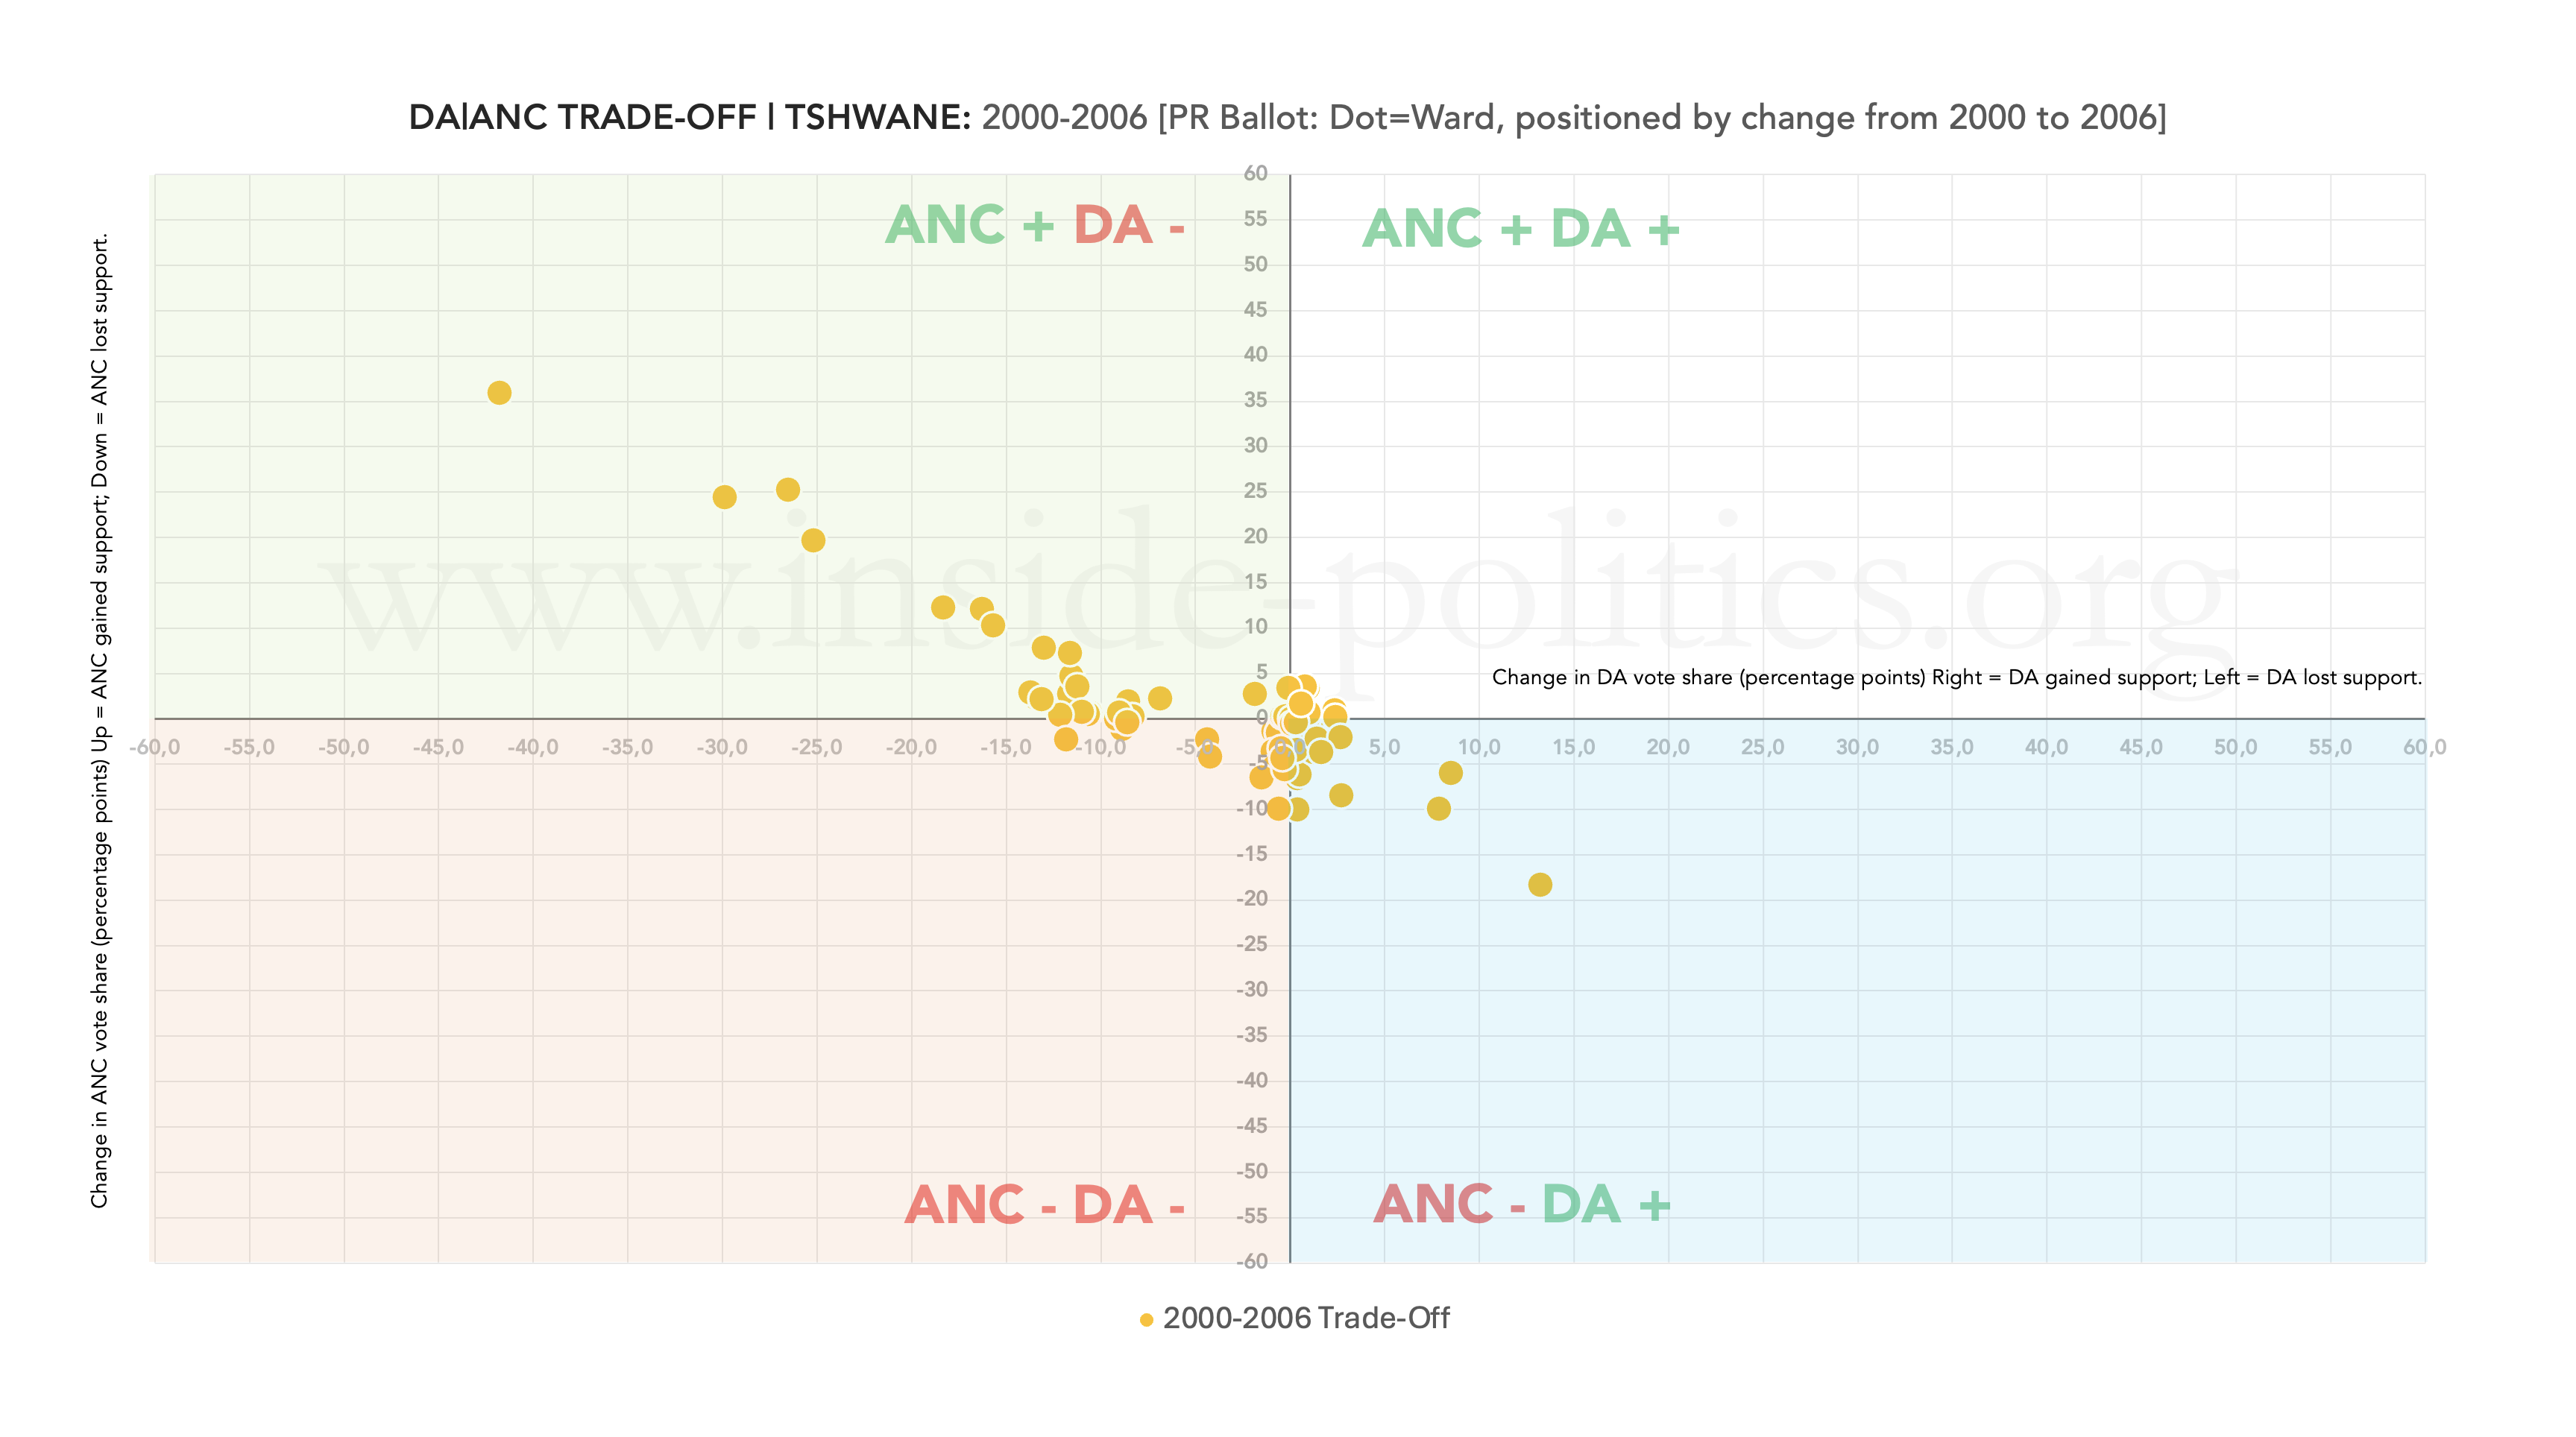
2000–2006 represents a good election for the ANC, with a significant number of wards in Q1 (ANC up, DA down).

2011–2016 represents a good election for the DA, with a significant number of wards in Q4 (ANC down, DA up).

2016–2021 represents a bad election for both parties, with a significant number of wards in Q3 (ANC down, DA down).
This might seem obvious, but there are important insights to be gained from this with regard to 2026/7. 1) Both parties have the potential to grow and, given the dire nature of the 2021 election, it will be instructive to see which wards go in which direction once we have the results. 2) There is clearly a strong correlation between the performance of the DA and the ANC, and the parties do feed off each other’s votes to a degree.
Conclusion
The trends that define Tshwane are similar to those that define Johannesburg: a marked decline in turnout, a significant decline in ANC support and the plateauing of the DA local election performance in 2021, reducing its ability to take full advantage of the ANC’s implosion.
However, there are important distinctions:
- The ANC did better in Tshwane than it did in Johannesburg in 2024, retaining some small national election bump and suggesting its decline here is more resilient than in Johannesburg.
- Likewise, unlike Johannesburg, the DA managed a small local election bump in 2021, suggesting, too, its decline in this metro might be easier to arrest.
- Related to this, the DA also has managed to keep its turnout differential positive, unlike in Johannesburg. And although declining, and small (2.3 pts), that is 6.4 pts better than Johannesburg (−4.1) in 2021, and that really is a significant difference.
- In turn, unlike Johannesburg (and taking into account the general decline in turnout), the DA in Tshwane did manage to keep its cluster of best-performing wards close to the turnout average in 2021. In Johannesburg, by contrast, its best-performing wards dropped significantly below the turnout average in 2021.
In summary, there are elements of hope for both parties in Tshwane but different kinds of hope. The ANC has the potential to perform better here than elsewhere, but it is doubtful it will reverse its long-term decline—the implosion is simply too far gone. The DA has the potential, if it can enthuse its voters, to overtake the ANC. To do this, it must generate a differential turnout in its favour. It cannot simply rely on the ANC’s decline. It is difficult to see it reproducing what happened in 2016, but even something half as good as that will make a profound impact.
This essay is the 2nd in an on-going series on Election 2026/7, for all other editions of this series, please click here: Election 2026/7
Discover more from inside politics
Subscribe to get the latest posts sent to your email.

I would love to see the same trends graphs for the EFF and ActionSA please.