
Election 2026/7 [5] Turnout, Mangaung, the ANC and DA
by The Editor

A comprehensive look at turnout trends in Mangaung, with a focus on the ANC and DA. The ANC is still in decline here, but there is no cliff its support has fallen off, at least not yet – more a slow, gradual erosion. As of 2024, the party is still above 50% in the metro, just, but all indications are this ANC majority will fall too, in the near future.
Turnout, Mangaung, the ANC and DA
By: Gareth van Onselen
Follow @GvanOnselen
21 October 2025
This essay is the 5th in an on-going series on Election 2026/7, for all other editions of this series, please click here: Election 2026/7
Introduction
This is the fifth essay in a series of in-depth, statistically driven analytical essays on the upcoming local government elections (to be held at some point between November 2026 and January 2027). Following our look at Johannesburg, Tshwane, Ekurhuleni and eThekwini, this essay focuses on Mangaung. Ultimately, we will look at all eight metros, before moving on to some consolidated national analysis. Next we will look at Nelson Mandela Bay.
Mangaung is something of a twilight zone, a small urban centre in the middle of a rural expanse. It is, perhaps, best understood as peri-urban. As such, it is more ambiguous, demonstrating the voting patterns of both rural and urban South Africa. When it comes to the ANC vote share, it has thus produced a more stable environment, as these two different trends cancel each other out to a degree. It makes for a more conventional set of numbers, and constitutes a break from the wild fluctuations that defined Johannesburg and eThekwini.
The ANC is still in decline here, but there is no cliff its support has fallen off, at least not yet – more a slow, gradual erosion. As of 2024, the party is still above 50% in the metro, just, but all indications are this ANC majority will fall too, in the near future.
Turnout: Mangaung
Starting with our standard turnout graph, below, which sets out the provincial and local election turnout results for Mangaung.

The period between 2014 and 2019 is interesting, particularly 2016, when the otherwise steep turnout differential became relatively shallow, certainly compared to the other metros. But that promising development (suggesting a marked increase in enthusiasm for local government elections) was short-lived and, in 2021, turnout dropped 20.2pts, down from 63.7% to 43.5%, and that does not bode well for 2026/7.
Turnout seems set to drop again in 2026/7, both the consolidated (local + provincial) and local specific trendlines suggest it will end up in the 30% bracket, if current patterns hold – more or less on par with the other metros.
Overlapping the ANC’s vote share onto turnout, as per the below, demonstrates better than any other metro, the relationship between the two. The ANC’s vote share stays firmly in the middle throughout, as opposed to, say, Johannesburg, Tshwane and Ekurhuleni, where it has started to separate from the turnout trendline, as it declines at a greater rate.

One of the reasons for this, is the more “rural” component of the ANC’s vote. Its numbers in 1999 (80.8%) and 2004 (77.6%) are the kinds of “super majorities” the ANC typically only gets in places like Limpopo or Mpumalanga, but not in urban centres. In Johannesburg, for example, the respective figures were 67.9% and 68.6% and, in Tshwane, 67.9% and 60.1%.
So one way of understanding the ANC’s decline here, is that it simply had a bigger base to start out with, some 10-15pts over the other metros, hence it has managed to hold onto its 50% majority, although only by its fingertips. Given the extent to which the ANC vote collapsed across the country in 2024, its 50.1% in Mangaung speaks to a certain residual resilience, absent in other metros.
It is also worth noting that the ANC’s fluctuation here, between local and provincial elections, is relatively small; suggesting that here too, is not as affected by disproportional turnout as it is in other urban centres.
If we add the ANC’s vote share in Mangaung to our composite list of ANC performances in other metros, you can see just how well the ANC does here, all things being relative.
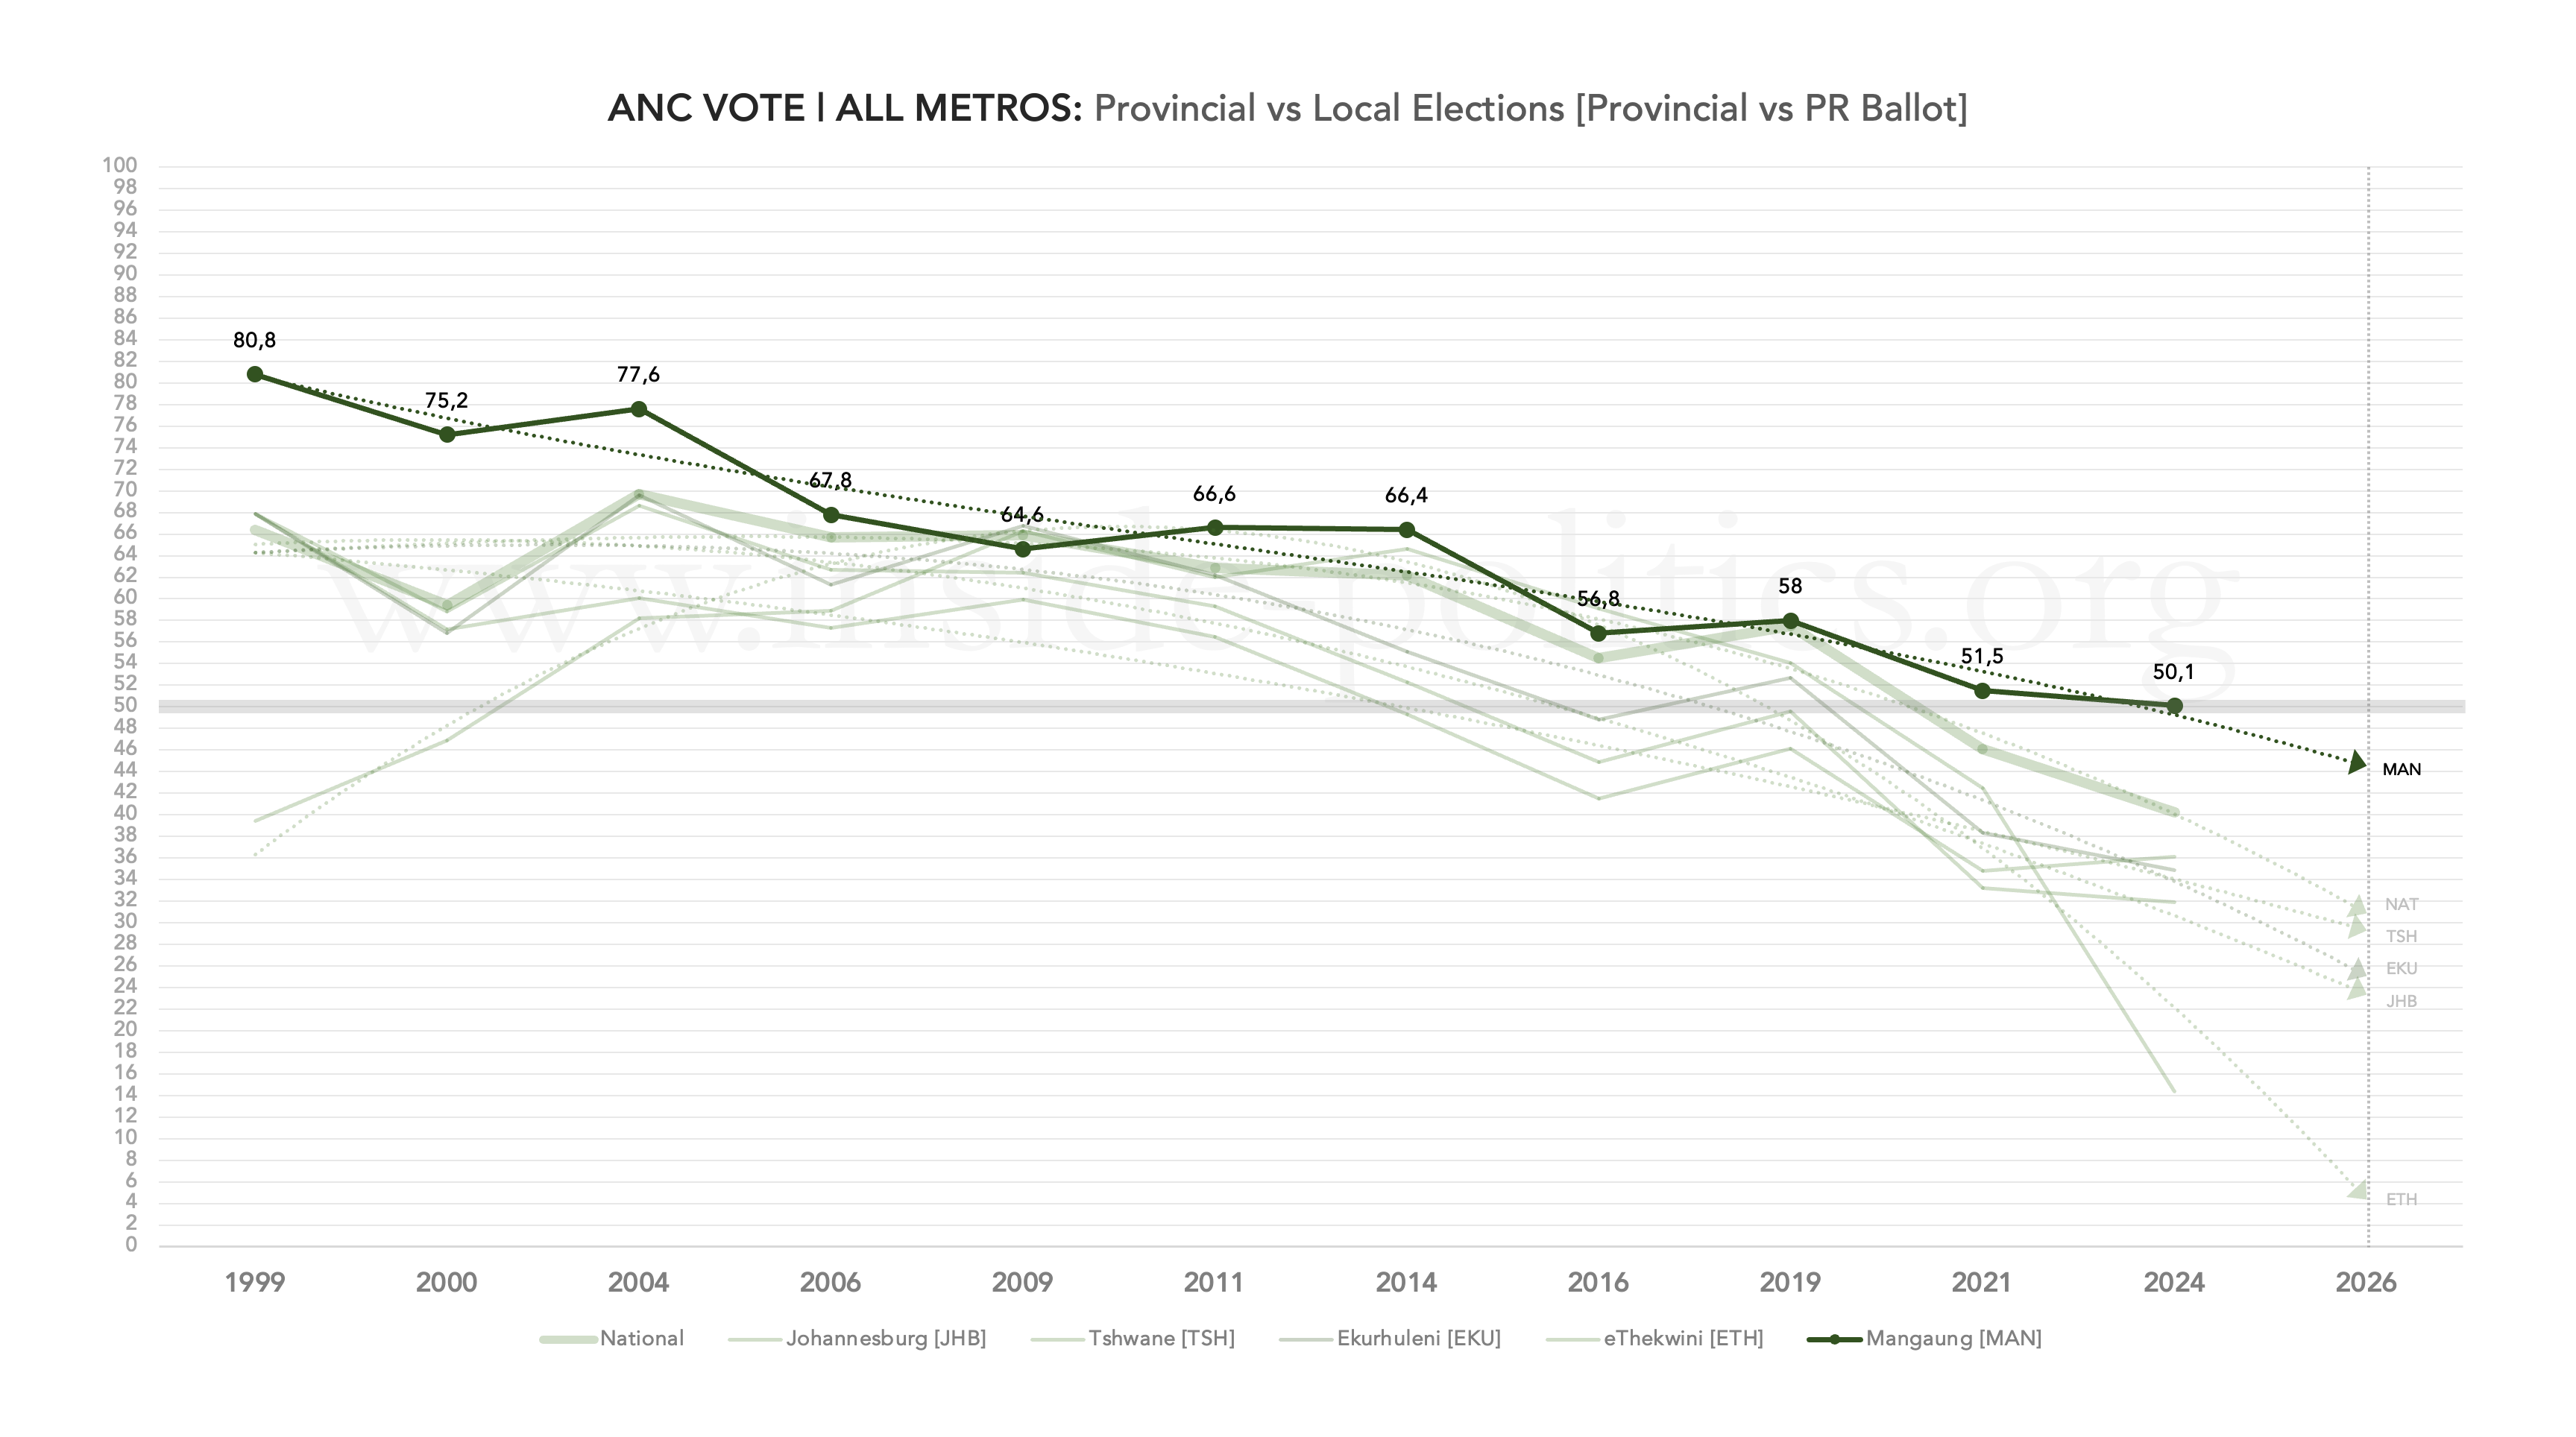
As of 2024, the ANC in Mangaung (50.1%) sits in first place, 9.9pts above its national percentage (40.2%), and 14pts above Tshwane (36.1%), which is in second place among the metros. So it really is something of an outlier, as far as the ANC is concerned. Only it and Buffalo City still boast an ANC majority, the last two forts standing on the urban battlefield.
Turning to the DA, its vote share in the metro is set out below, also mapped against turnout trends.

Given the peri-urban nature of the metro, and the initial size of the ANC’s majority in it, the DA has done well to solidify itself as a substantial opposition and, as with other metros, its vote share is slowly but gradually climbing up. However, as with other metros, it seems stuck in the 20%-30% bracket. To be even more specific, it seems stuck at 25%/26% in local elections, finishing on one or the other in 2011 (26.8%), 2016 (26.2%) and in 2021 (25.5%).
Each of those three local election results does, however, reflect a small local election “bump”, so the DA is still benefiting from some differential turnout:
- 2011: +11.4pts from 2009
- 2016: +5.3pts from 2014
- 2021: +4.2pts from 2019
The “bump” is shrinking but the fact that the DA vote share is growing, and that its growth is on the back of improving provincial performance rather than local ones, suggests the DA is facing something of a ceiling in Mangaung in local elections. It is obvious that the DA needs to break into new markets, but it is particularly true of Mangaung. Unlike, say, Johannesburg – where the party has lost some of its core base – in Mangaung its core base appears capped and it needs to be expanded upon, if it ever wants to break 30%.
In turn, the DA cannot rely on exponential ANC decline in Mangaung to make up the difference, as it does in other metros. The ANC is far tougher nut to crack here, and even though it will likely decline in 2026/7, there is not much to suggest it will be as dramatic as elsewhere.
Adding the DA’s vote share in Mangaung to our consolidated DA support graph, below, sees yet another metro fall into that thin band, between around 20% and 30%, where almost all DA urban support seems to fall. And we are beginning to see another pattern too: notice how all DA lines are starting to converge into a tighter and tighter band.
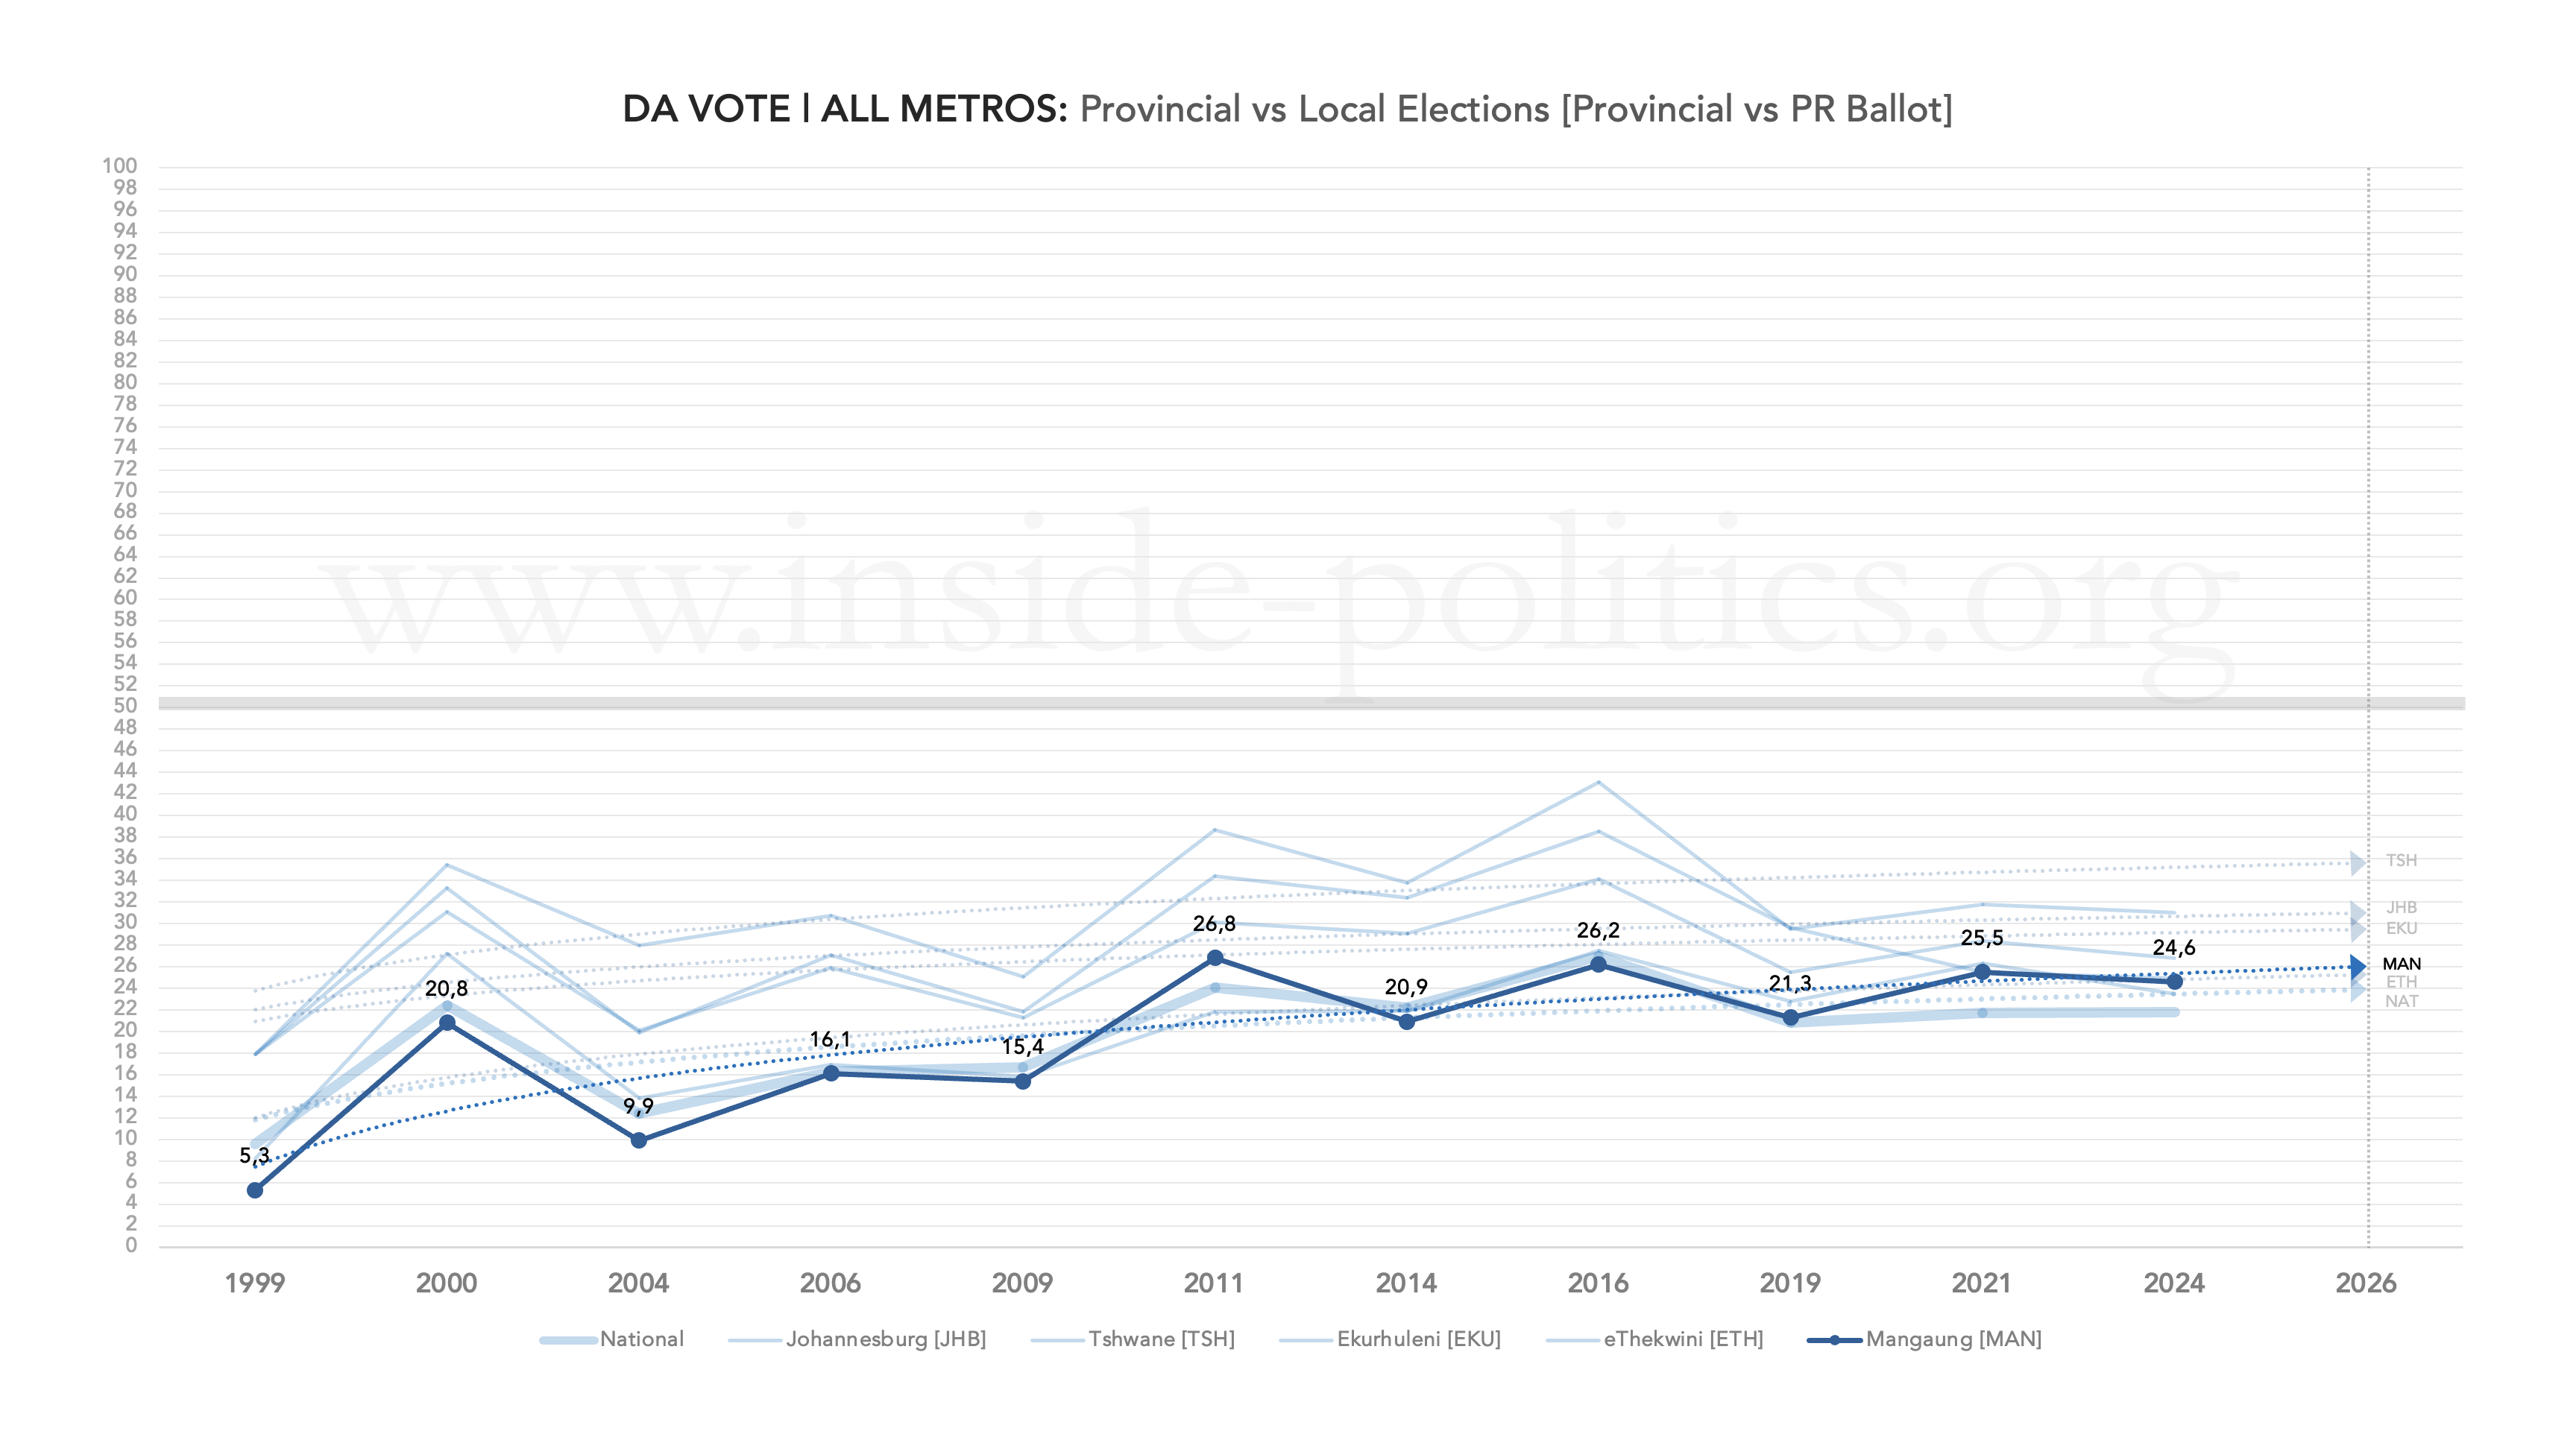
In 2016, the party’s spread – between its highest level of support (43,1%, Tshwane) and lowest (26.2%, Mangaung) – in those urban centres we have plotted so far, was 16.9pts. In 2021 those same five metros delivered a spread of just 6.1pts. So the DA’s ability to break into new markets is declining, and its vote share is getting squeezed into an ever-narrowing band in the metros.
Bumps and slumps
Plotting the ANC and DA turnout differentials (below, the difference in percentage points between a party’s provincial ballot and PR ballot performance) we can see that, as with other metros, the DA remains in positive territory, and in fact does slightly better in Mangaung than it does nationally.

The ANC is also a lot more stable than it is in other metros. In fact, it managed even to shrink its differential in 2021 (up from -9.6pts to -6.5pts) – so far, the only metro it has managed to do that in, and that will give something to hold onto. If it can do that again in 2026/7, it will lessen the DA’s ability to capitalise on its typical local election “bump”. The ANC’s performance in Mangaung on this front, is significantly better than its national showing and, again, speaks to that residual resilience.
Mangaung is also the first metro where the ANC and DA trendlines don’t seem set to overlap at some point in the very near future (in other metros the 30% line seems to be on or about the nexus). The graph below plots both parties on the same grid. As ever, there is always the possibility the ANC vote share collapses in Mangaung, 2026/7 but, even if it does, as of 2024 it has 25.5pts on the DA, so it would require something of eThekwini-like proportions to drop that far. Not impossible, but a very dramatic requirement.

A ward-by-ward view of Mangaung turnout
As in the previous essay, I have condensed each of the ward-turnout graphs into a single video.
What follows below are a series of five scatter graphs that shows ANC turnout (the ANC’s PR vote divided by the total registered voting population) in every Mangaung ward, starting with a combined graph and then one for each of the last five local elections – 2000, 2006, 2011, 2016 and 2021 (every dot is a ward). The ANC’s turnout percentage runs up the Y-axis, and the size of the ward (in terms of registered voters) runs along the X-axis. So, what you want as a political party are dots up and towards the right-hand corner (big ward/high turnout).
(The individual graphs are available on the resources page)
The ANC’s turnout, in 2016 and 2021, does demonstrate the same trends we have seen elsewhere – as it gets squeezed down into a band significantly below the turnout average for all parties, the result of increasing voter apathy – but it does manage to keep most wards off the bottom of the graph. In places like Gauteng, the ANC has hurt badly in wards where its vote share is weaker. In Mangaung, although all of the ANC vote is suppressed, very few wards have actually collapsed completely.
Looking at the DA’s turnout by ward, below, the first thing that strikes you is how few wards the DA relies upon to generate its percentage total. The 2021 graph sets them out most starkly: just 13 wards hover significantly above the bottom of the graph, with some of the best performing among them on or above the turnout average.
This speaks again to the DA’s current ceiling in Mangaung, and which capped its vote in 2011, 2016 and 2021 at around 25%. These 13 wards defined the DA’s turnout for all three of those election cycles but, in none of those election, perhaps with some small exceptions 2016, do the cluster of blue dots at the bottom move. If the DA wants to break its cap, these wards must deliver some nominal support in 2026/7 and rise off the floor. As things stand, however, they seem set in stone.
Finally, trade-offs and the relationship between the ANC and DA vote. If ANC votes go up, do DA votes go down? To track this we again need to plot every ward as a dot on a grid. But, in this case, each dot represents the change in support. If the ANC did well in the ward, the dot moves up. If the DA did well, the dot moves to the right. In this way, we can split the chart into four quadrants:
- Q1 (top left): ANC up, DA down
- Q2 (top right): ANC up, DA up
- Q3 (bottom left): ANC down, DA down
- Q4 (bottom right): ANC down, DA up
So, from the ANC’s perspective, a good election is when a large number of dots are in Q1 (ANC up, DA down). From the DA’s perspective, a good election is when a large number of dots are in Q4 (ANC down, DA up). And from both parties’ perspective, the place you don’t want to be is Q3 (ANC down, DA down).
Because wards change, we can’t run this for all election years (you need consistent wards between elections to see the change), but we can run it for 2000 to 2006 (43 identical wards in both), 2011 to 2016 (49) and 2016 to 2021 (50). If we do that, we get the following three graphs:


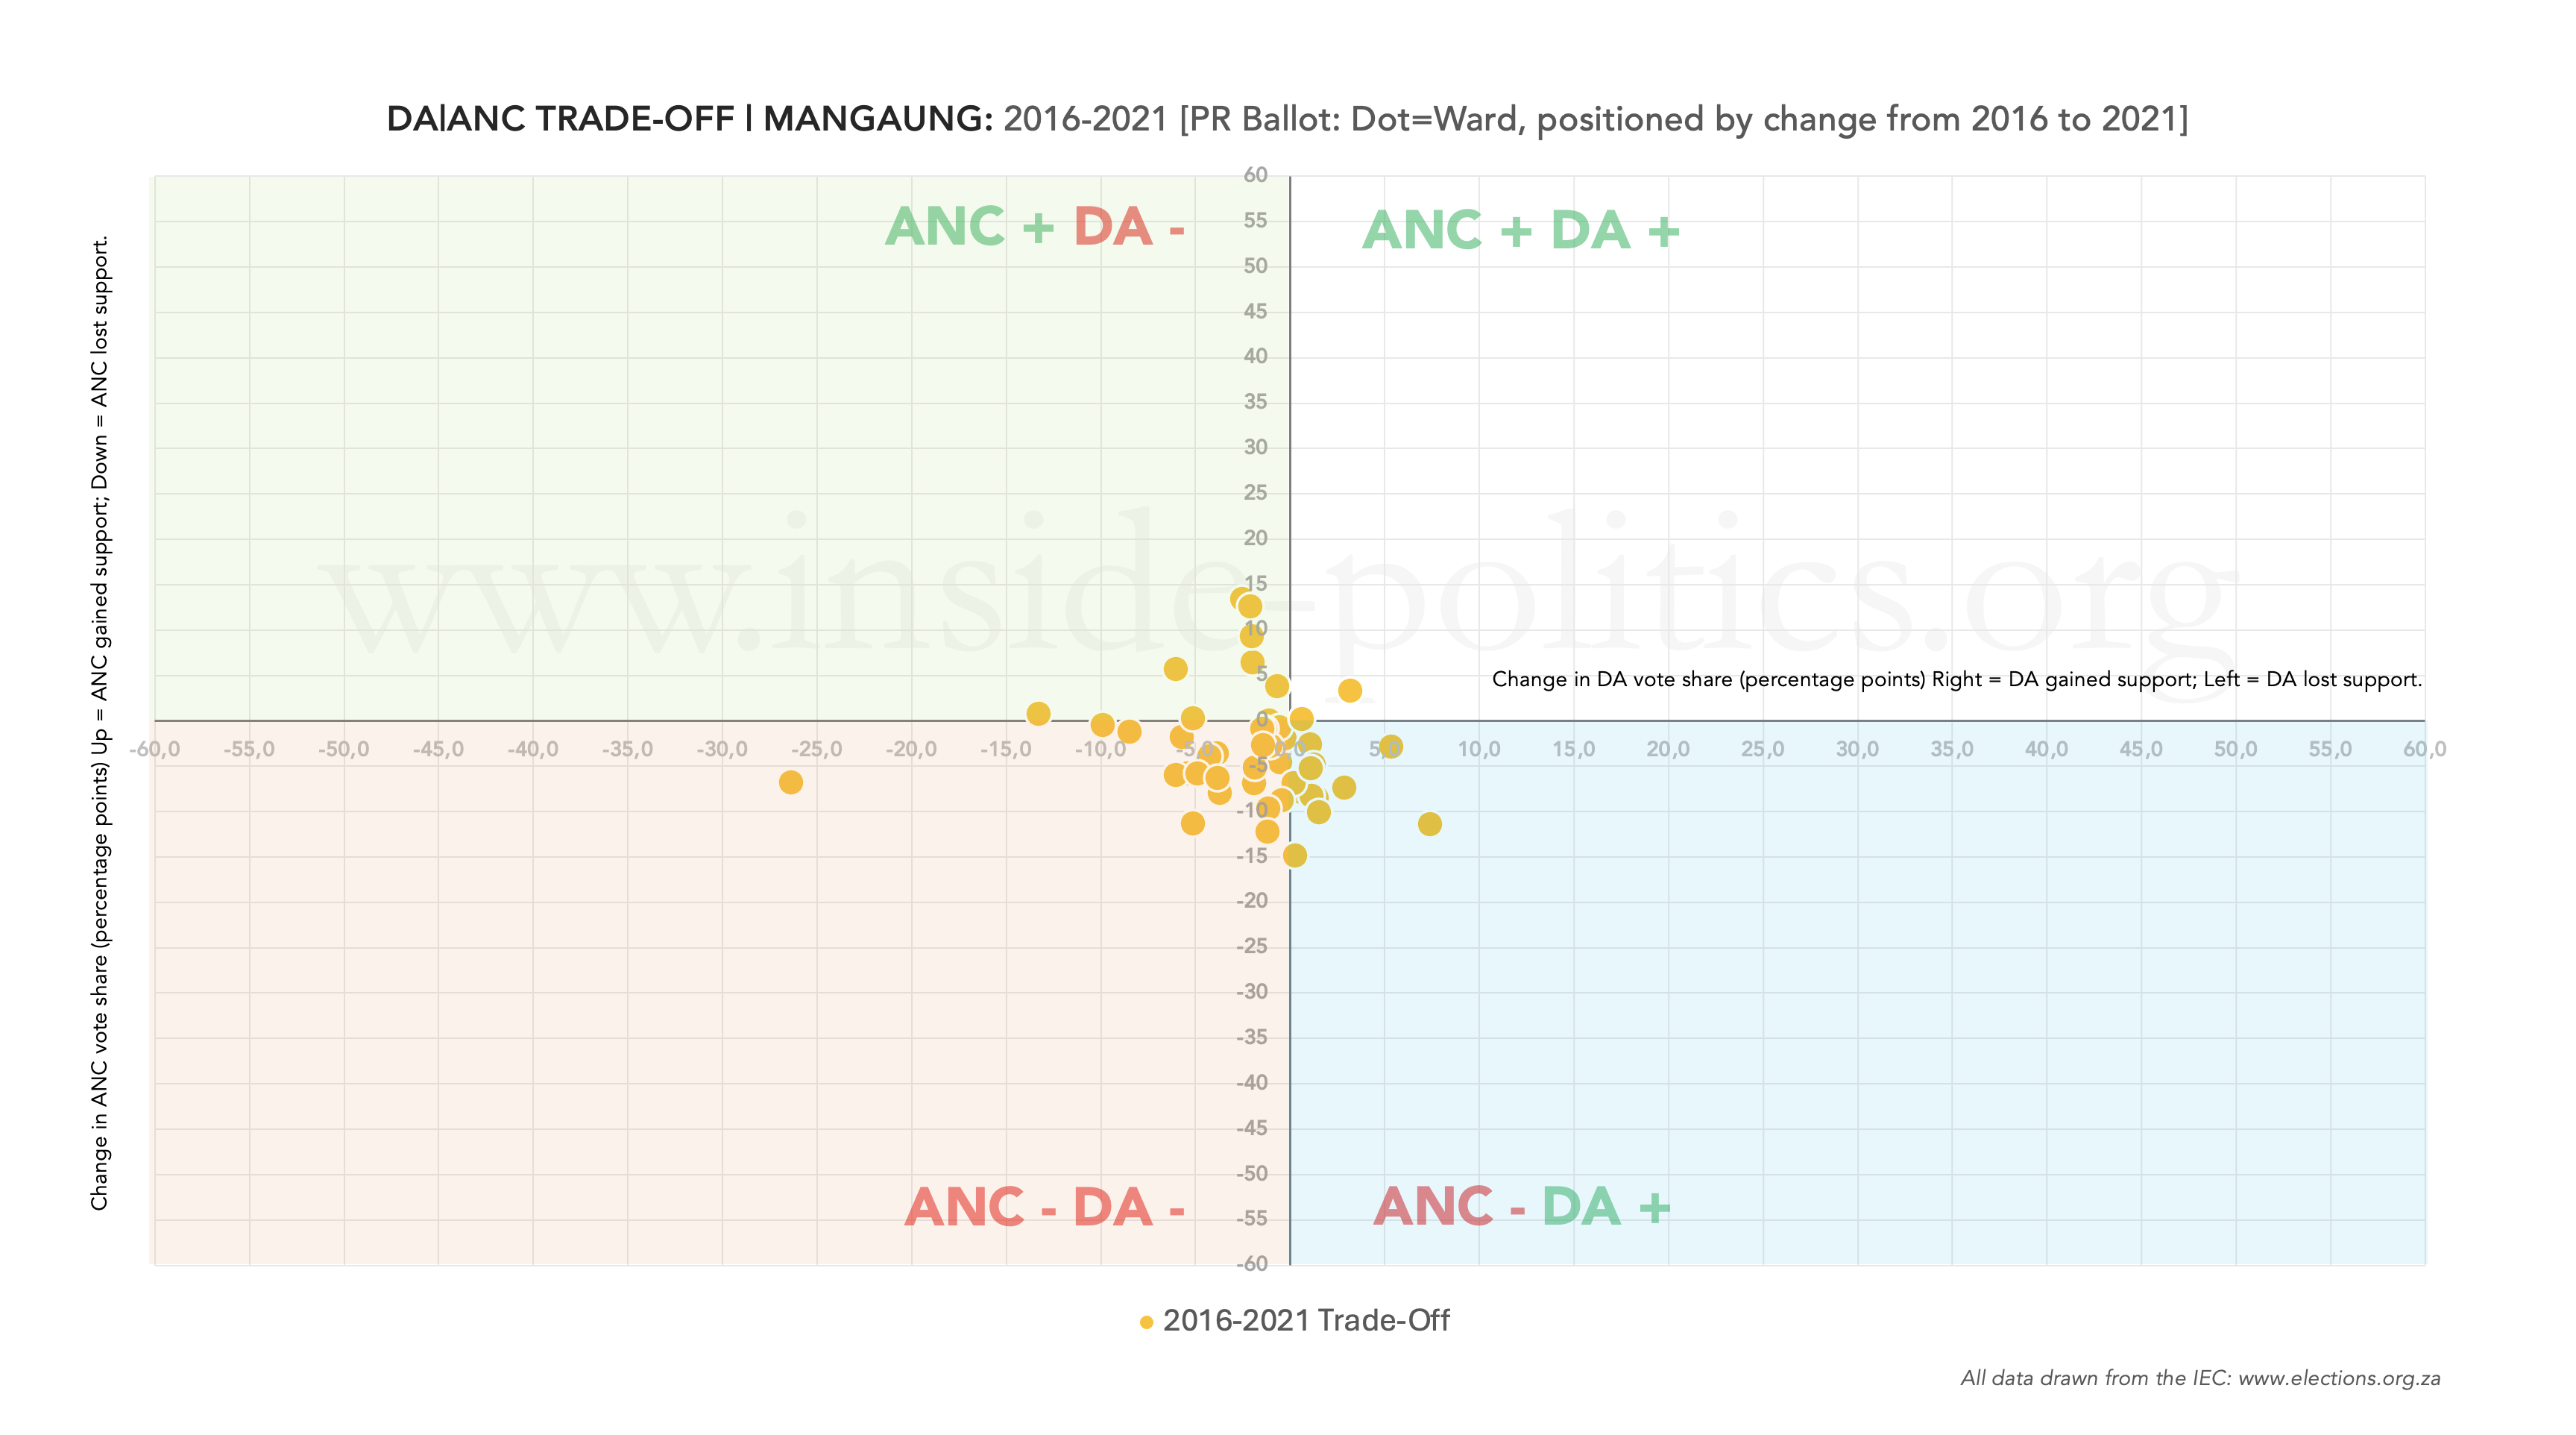
As the ANC’s vote share is more stable here, and the DA seems to have reached a ceiling, that consistency is reflected in the trade-off graphs. Outside of 2006, which was a good election for the ANC, both 2016 and 2021 demonstrate little movement, with the majority of dots, if not all, clumped in the centre, suggesting something of a stalemate between the two parties.
Conclusion
From the onset, we have said there are two ways in which the ANC vote can decline: gradually or dramatically. We have seen, in a range of metros now, that either is possible. In eThekwini, the ANC’s vote share has dramatically and instantaneously collapsed. In the Gauteng metros, its decline is more systematic. The thing with the ANC – and when it comes to those places that show a gradual decline – is that you never quite know where the cliff edge is. At any moment you feel its support could topple over the precipice. Ekurhuleni, for example, suggests such a drop is coming.
Mangaung is possibly also such a metro, although the ANC’s stability does make that more of an outlier scenario. Up until 2024, the ANC has fought tooth and nail to avoid a less-than-50% scenario; and it has, just. However, all indications are that it will drop below 50% in 2026/7 and the question is, how low will it go? Each of these metros are a bubble, with their own peculiarities but, only to an extent. A national ANC collapse will manifest in Mangaung too, and drag its support down with it.
Compounding that is the fragmentation of the ANC itself. As with previous years, this remains a problem in the province and metro, with endless small ANC breakaways. The EFF (even the SACP) can make an impact in the metro, and then there is MK, the prospects of which, if not substantial, will constitute another chip off the ANC block. More death by a thousand cuts, than a single knife, deep in the back.
At the other end of the spectrum lies the DA. It still enjoys a positive turnout differential and its trendline, although primarily by an improvement at provincial level, is positive. It is far behind the ANC, too far for the data to indicate it stands a good chance of emerging in 2026/7 as the biggest party, as the numbers do in other metros but, to do this, one of two things need to change.
First, the ANC vote share needs to collapse – something the DA has relied heavily upon in other metros, to make up for its apathy problems. Second, the DA needs to break through into the majority of wards in Mangaung, where its support is nominal. It doesn’t need much here, but more than it has got. Turnout is likely to drop again, and without new support, the DA’s ceiling will drop with it.
This essay is the 5th in an on-going series on Election 2026/7, for all other editions of this series, please click here: Election 2026/7
Discover more from inside politics
Subscribe to get the latest posts sent to your email.

You must be logged in to post a comment.