
Election 2026/7 [6] Turnout, Nelson Mandela Bay, the ANC and DA
by The Editor

A comprehensive look at turnout trends in Nelson Mandela Bay, with a focus on the ANC and DA. Both the ANC and the DA are decline here. Both had the potential for a 50% majority but, the data suggests, no more. Rather, what we are seeing is an attritional fight between the two for diminishing returns, and only more voter enthusiasm will solve that.
Turnout, Nelson Mandela Bay, the ANC and DA
By: Gareth van Onselen
Follow @GvanOnselen
27 October 2025
This essay is the 6th in an on-going series on Election 2026/7, for all other editions of this series, please click here: Election 2026/7
Introduction
This is the sixth essay in a series of in-depth, statistically driven analytical essays on the upcoming local government elections (to be held at some point between November 2026 and January 2027). Following our analyses of Johannesburg, Tshwane, Ekurhuleni, eThekwini, and Mangaung, this essay focuses on Nelson Mandela Bay (NMB). Ultimately, we will look at all eight metros before moving on to some consolidated national analysis. Next, we will look at Buffalo City.
NMB is unique among the metros in so far as both the ANC and the DA have had, for some time now, an equal chance of an outright majority, although neither has actually secured one. You could argue Tshwane is similar, but the two parties’ trendlines have only crossed once there; in NMB, they are completely intertwined.
Going all the way back to 2014, both parties have been locked in a battle of attrition, mostly in the 35%–45% bracket. It seems to be a downward spiral, as both have lost support recently. NMB remains about as close as the ANC and DA get to an equal footing in South Africa’s metros, and the latest chapter in that struggle for dominance is about to play out.
The result is a set of statistics that are far more even, with fewer extreme swings or outlier performances—rather a tooth-and-nail scrap for small gains. But the broader context, alluded to above, is what is all important: general enthusiasm (turnout) is declining in NMB, as it is elsewhere; as a result, both the ANC and DA are starting to trend downwards. It seems the prospect of any party securing a 50% majority is further away than it has been for a while, and it is the 40%, rather than 50%, barrier that will now determine the winner.
Turnout: Nelson Mandela Bay
Starting with the big picture and general turnout trends among all parties in NMB. The graph below sets out the provincial and local election turnout results for NMB:
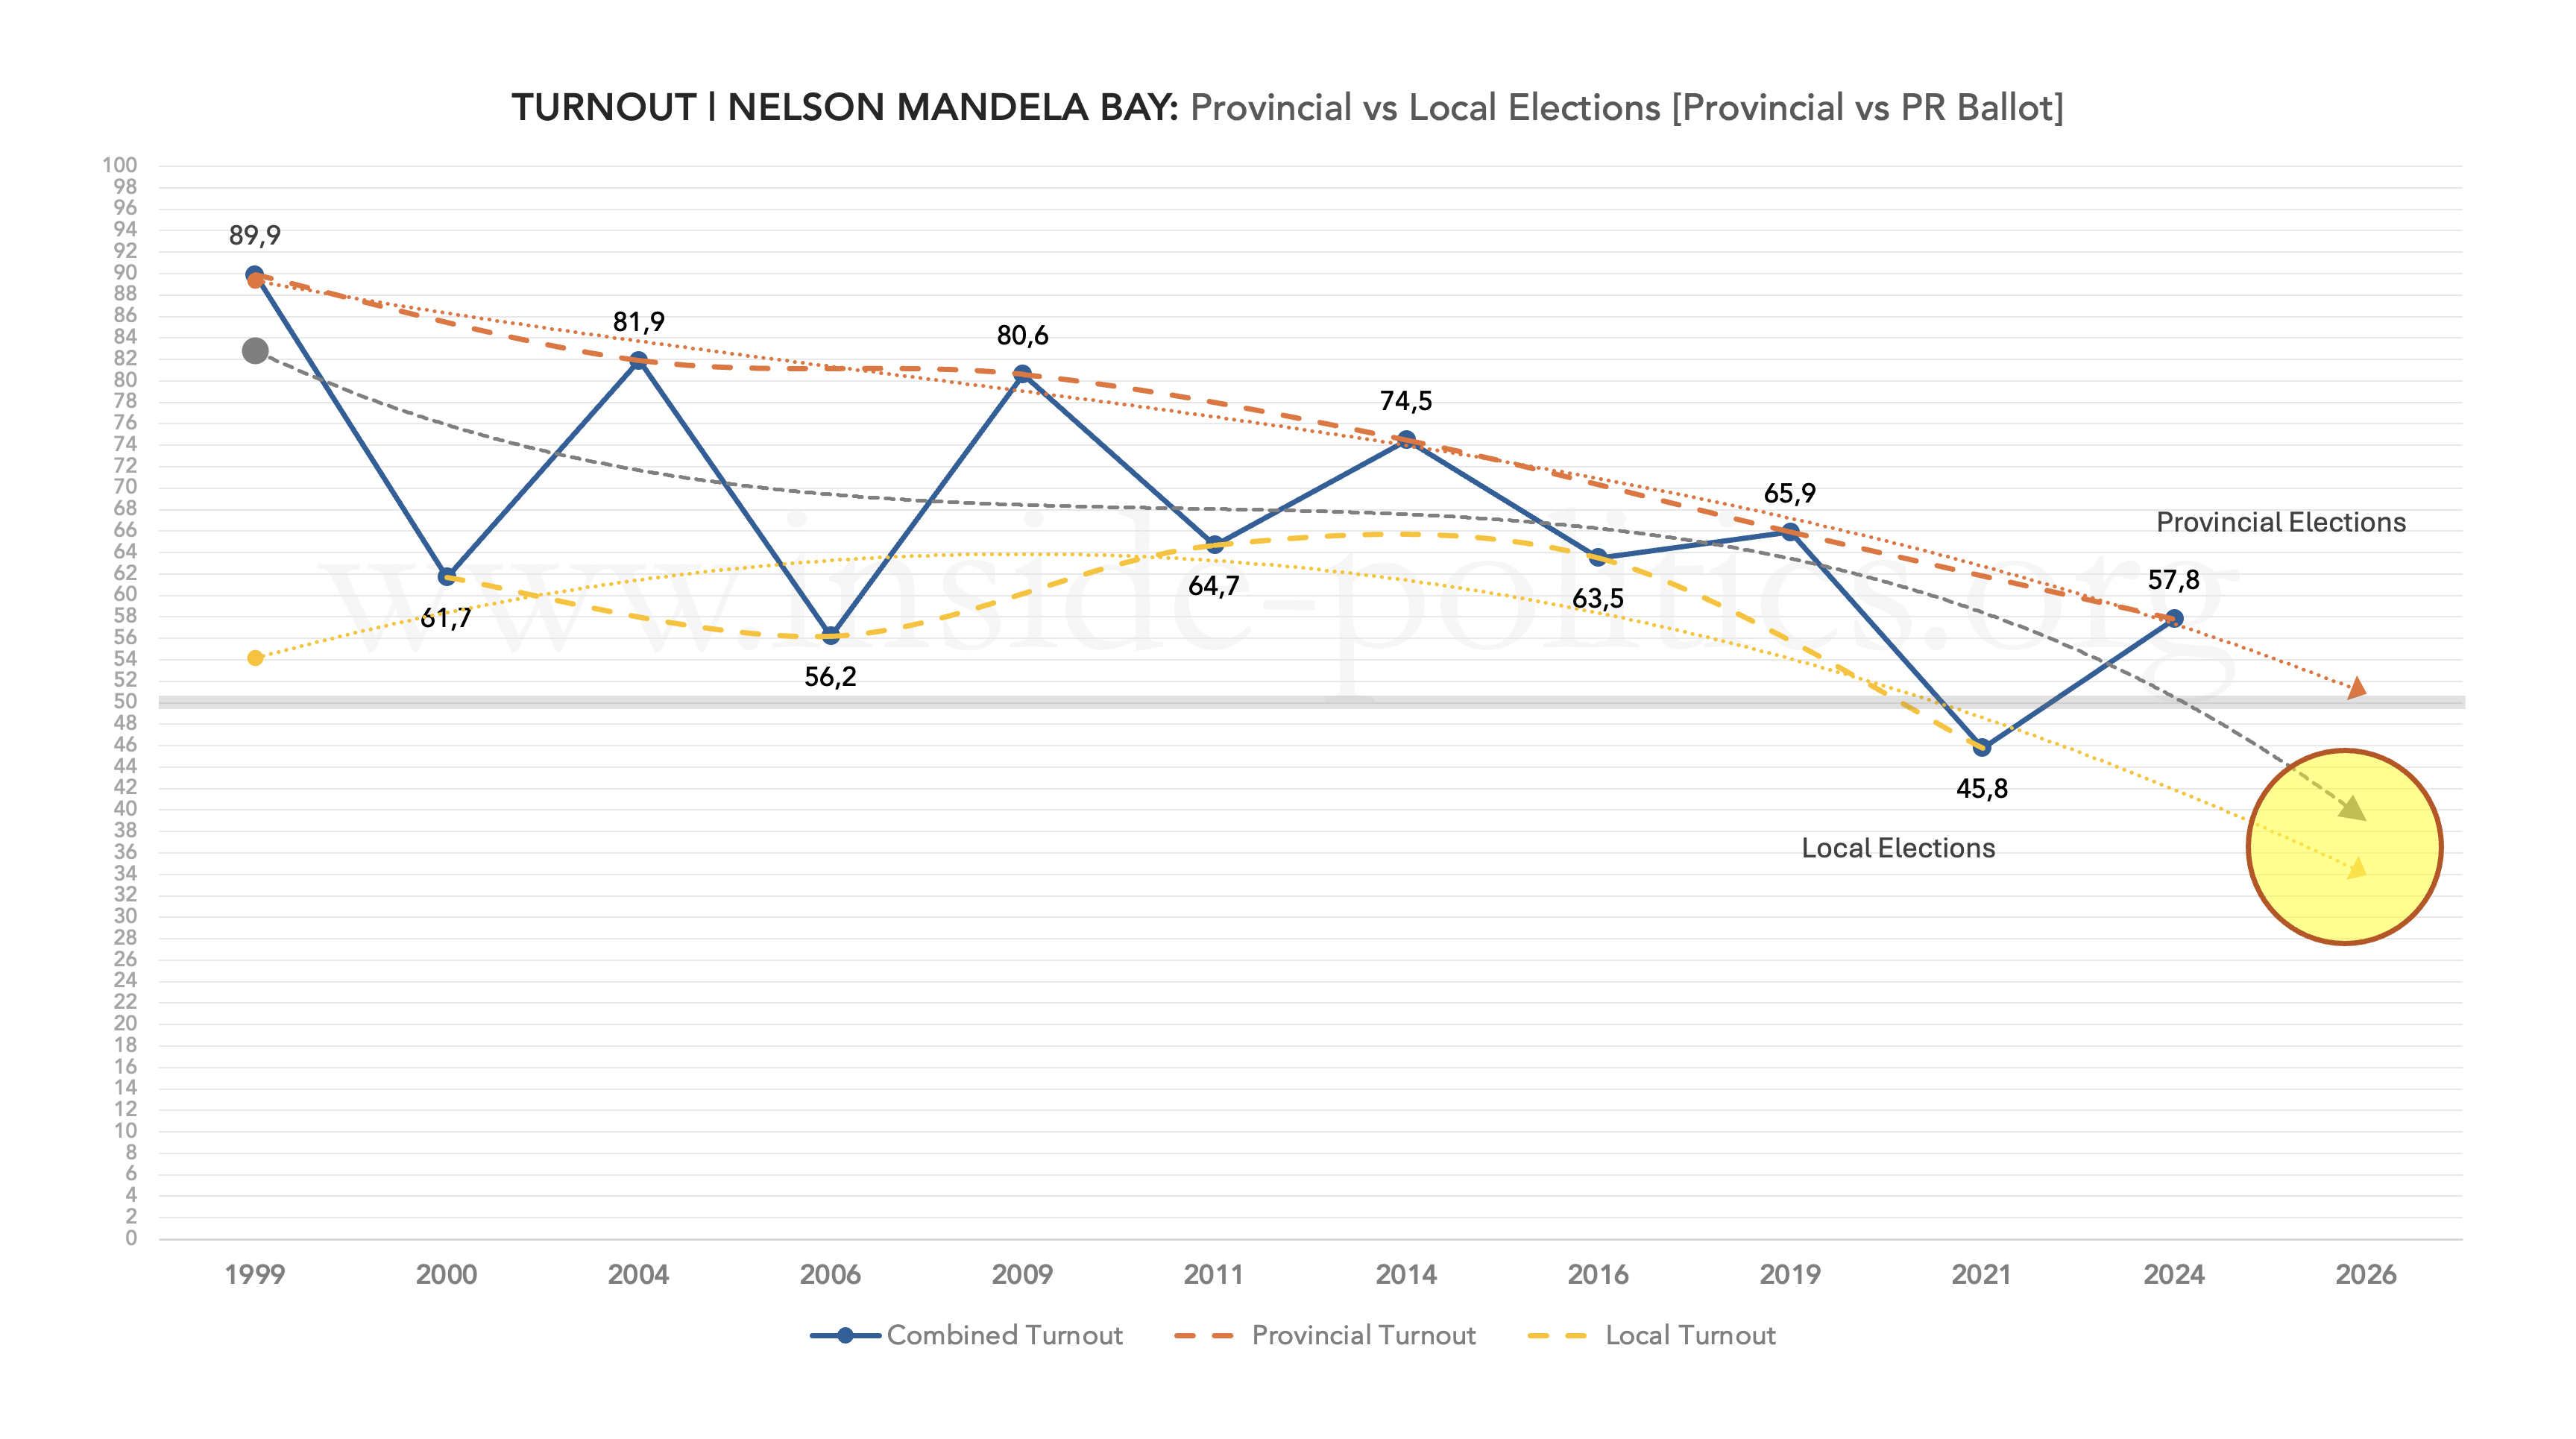
There was a monumental drop in turnout in the last local government elections (2021), down 20.1 points to 45.8% from 2019 and, perhaps more importantly, down 17.7 points from 63.5% in the last local government elections (2016)—a more accurate and direct comparator. Either way, turnout has gone through the floor in NMB, and that is a real problem. Fifty percent, for either party, is only possible if turnout spikes again. If it continues to decline, it is off the table.
Typically, as we have seen in previous essays, it is the ANC’s vote that is most negatively affected by lower turnout, because it is the bigger party. But not in NMB. In NMB, both parties are hurt. The trendline suggests a substantive further dip to come, down to below 40%.
Let’s see how that has impacted the ANC’s vote share, which is set out below (with the turnout tends faded in the background).

Unlike in places like Mangaung, the ANC’s vote share has not kept pace with declining turnout, departing from the general turnout trendline around 2009. The gap between the two increases from there. So ANC supporters, as with other metros, are generally far less enthusiastic than the average—and becoming even less so.
The last time the ANC achieved a 50% majority in the metro was 2011 (52.1%); since then, it has fallen to 38.2% in 2021, its lowest point. From its all-time high (73.8% in 1999) that represents a decline of 35.6 points.
The ANC’s trendline suggests it is set for a further drop, down to around 30%. And, if things worsen substantially, perhaps even into the 20%–30% bracket.
The party did manage a significant bump in the 2019 national and provincial elections, but that bump vanished in 2024. In fact, it declined—by a mere 1.4 points—but enough to ensure that its base provincial support, on which the party heavily relies in local elections, is severely diminished. Thus, its further decline appears inevitable, barring a miracle.
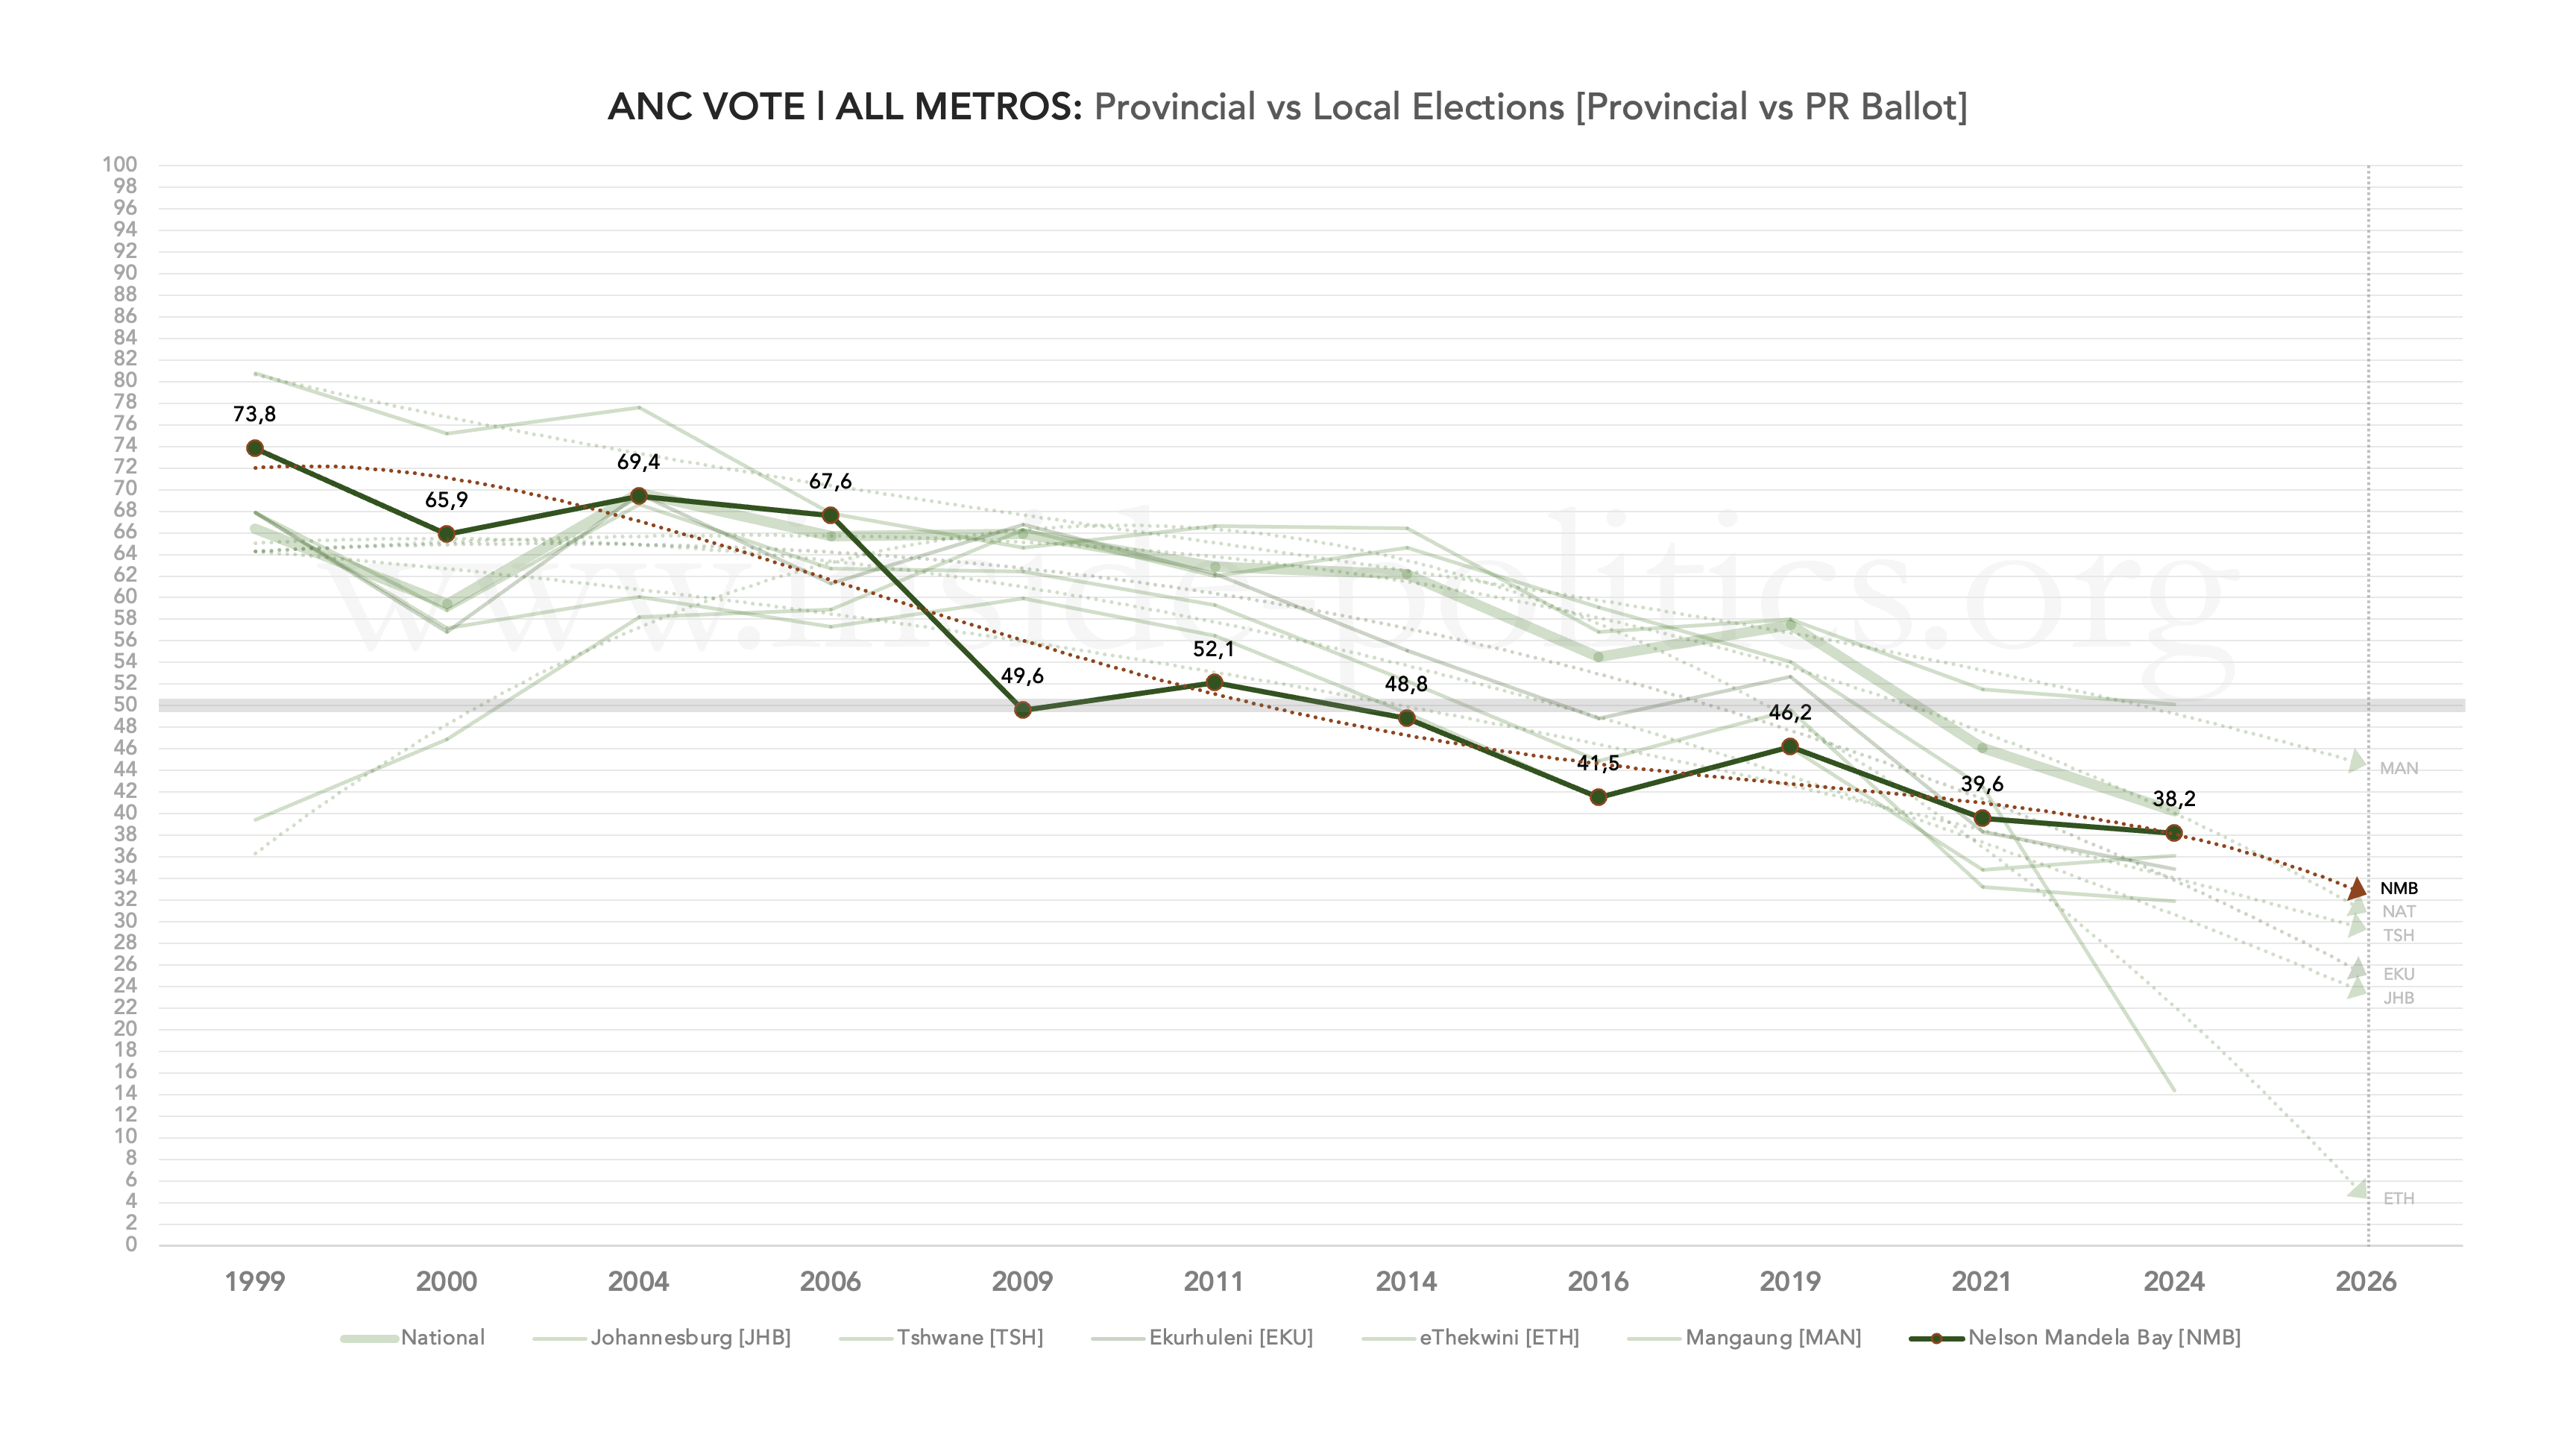
If we look at the composite graph of all ANC metro performances (below, which we are building up as we go), it does marginally better in NMB than it does in Gauteng, but not by much. The key insight here, ignoring the trendlines, is that with the exception of Mangaung, as of 2024, all ANC metro performances to date are well below the 40% barrier. As the party almost without fail performs worse in local than in provincial elections—whether its vote share is rising or falling—the scene seems set for a very bad set of results in 2026/7.
The DA’s vote share, below, appears at first glance far more positive, but there are worrying signs on closer inspection.

Let us start with the big picture: the DA has made remarkable inroads in NMB. Its rise, from a paltry 6.3% in 1999 to the verge of an outright majority in 2016 (46.7%), was meteoric. It was boosted, along the way, by disproportionately good local government performances, particularly 2011 (when it jumped 16.1 points from 2006) and 2016 (when it jumped 6.5 points from 2011). Since then, progress has been hard going.
As of 2024, the DA is on 36.2%, a substantial decline (of 10.5 points) from its all-time high in 2016. And while it did manage a small local election “bump” in 2021 (of 0.6 points), it was too small to be meaningful. Thus, in NMB as elsewhere, the DA, like the ANC, has a big turnout problem. To reach 50%, it will need the ANC vote to implode (possible) but also its voters to become significantly more enthusiastic (less likely). Regardless of how it gets there, it will want to grow, and all things being relative, its most realistic target as things stand is 40%; anything above that would rely on something really special happening.
Turning to the DA’s composite support graph, below, NMB breaks the mould somewhat—the first metro to fall outside the narrow band most DA support seems stuck in. However, one must be cautious reading this. Because of its excellent past local government results, the trendline predicts a bump in 2026/7. That might not happen, in which case it would seem headed for the same band all the metros, so far, fall into.

Bumps and Slumps
Let’s look now at the ANC’s and DA’s turnout differentials (the difference between their performance on the provincial and PR ballot). The graph below sets them out for NMB.
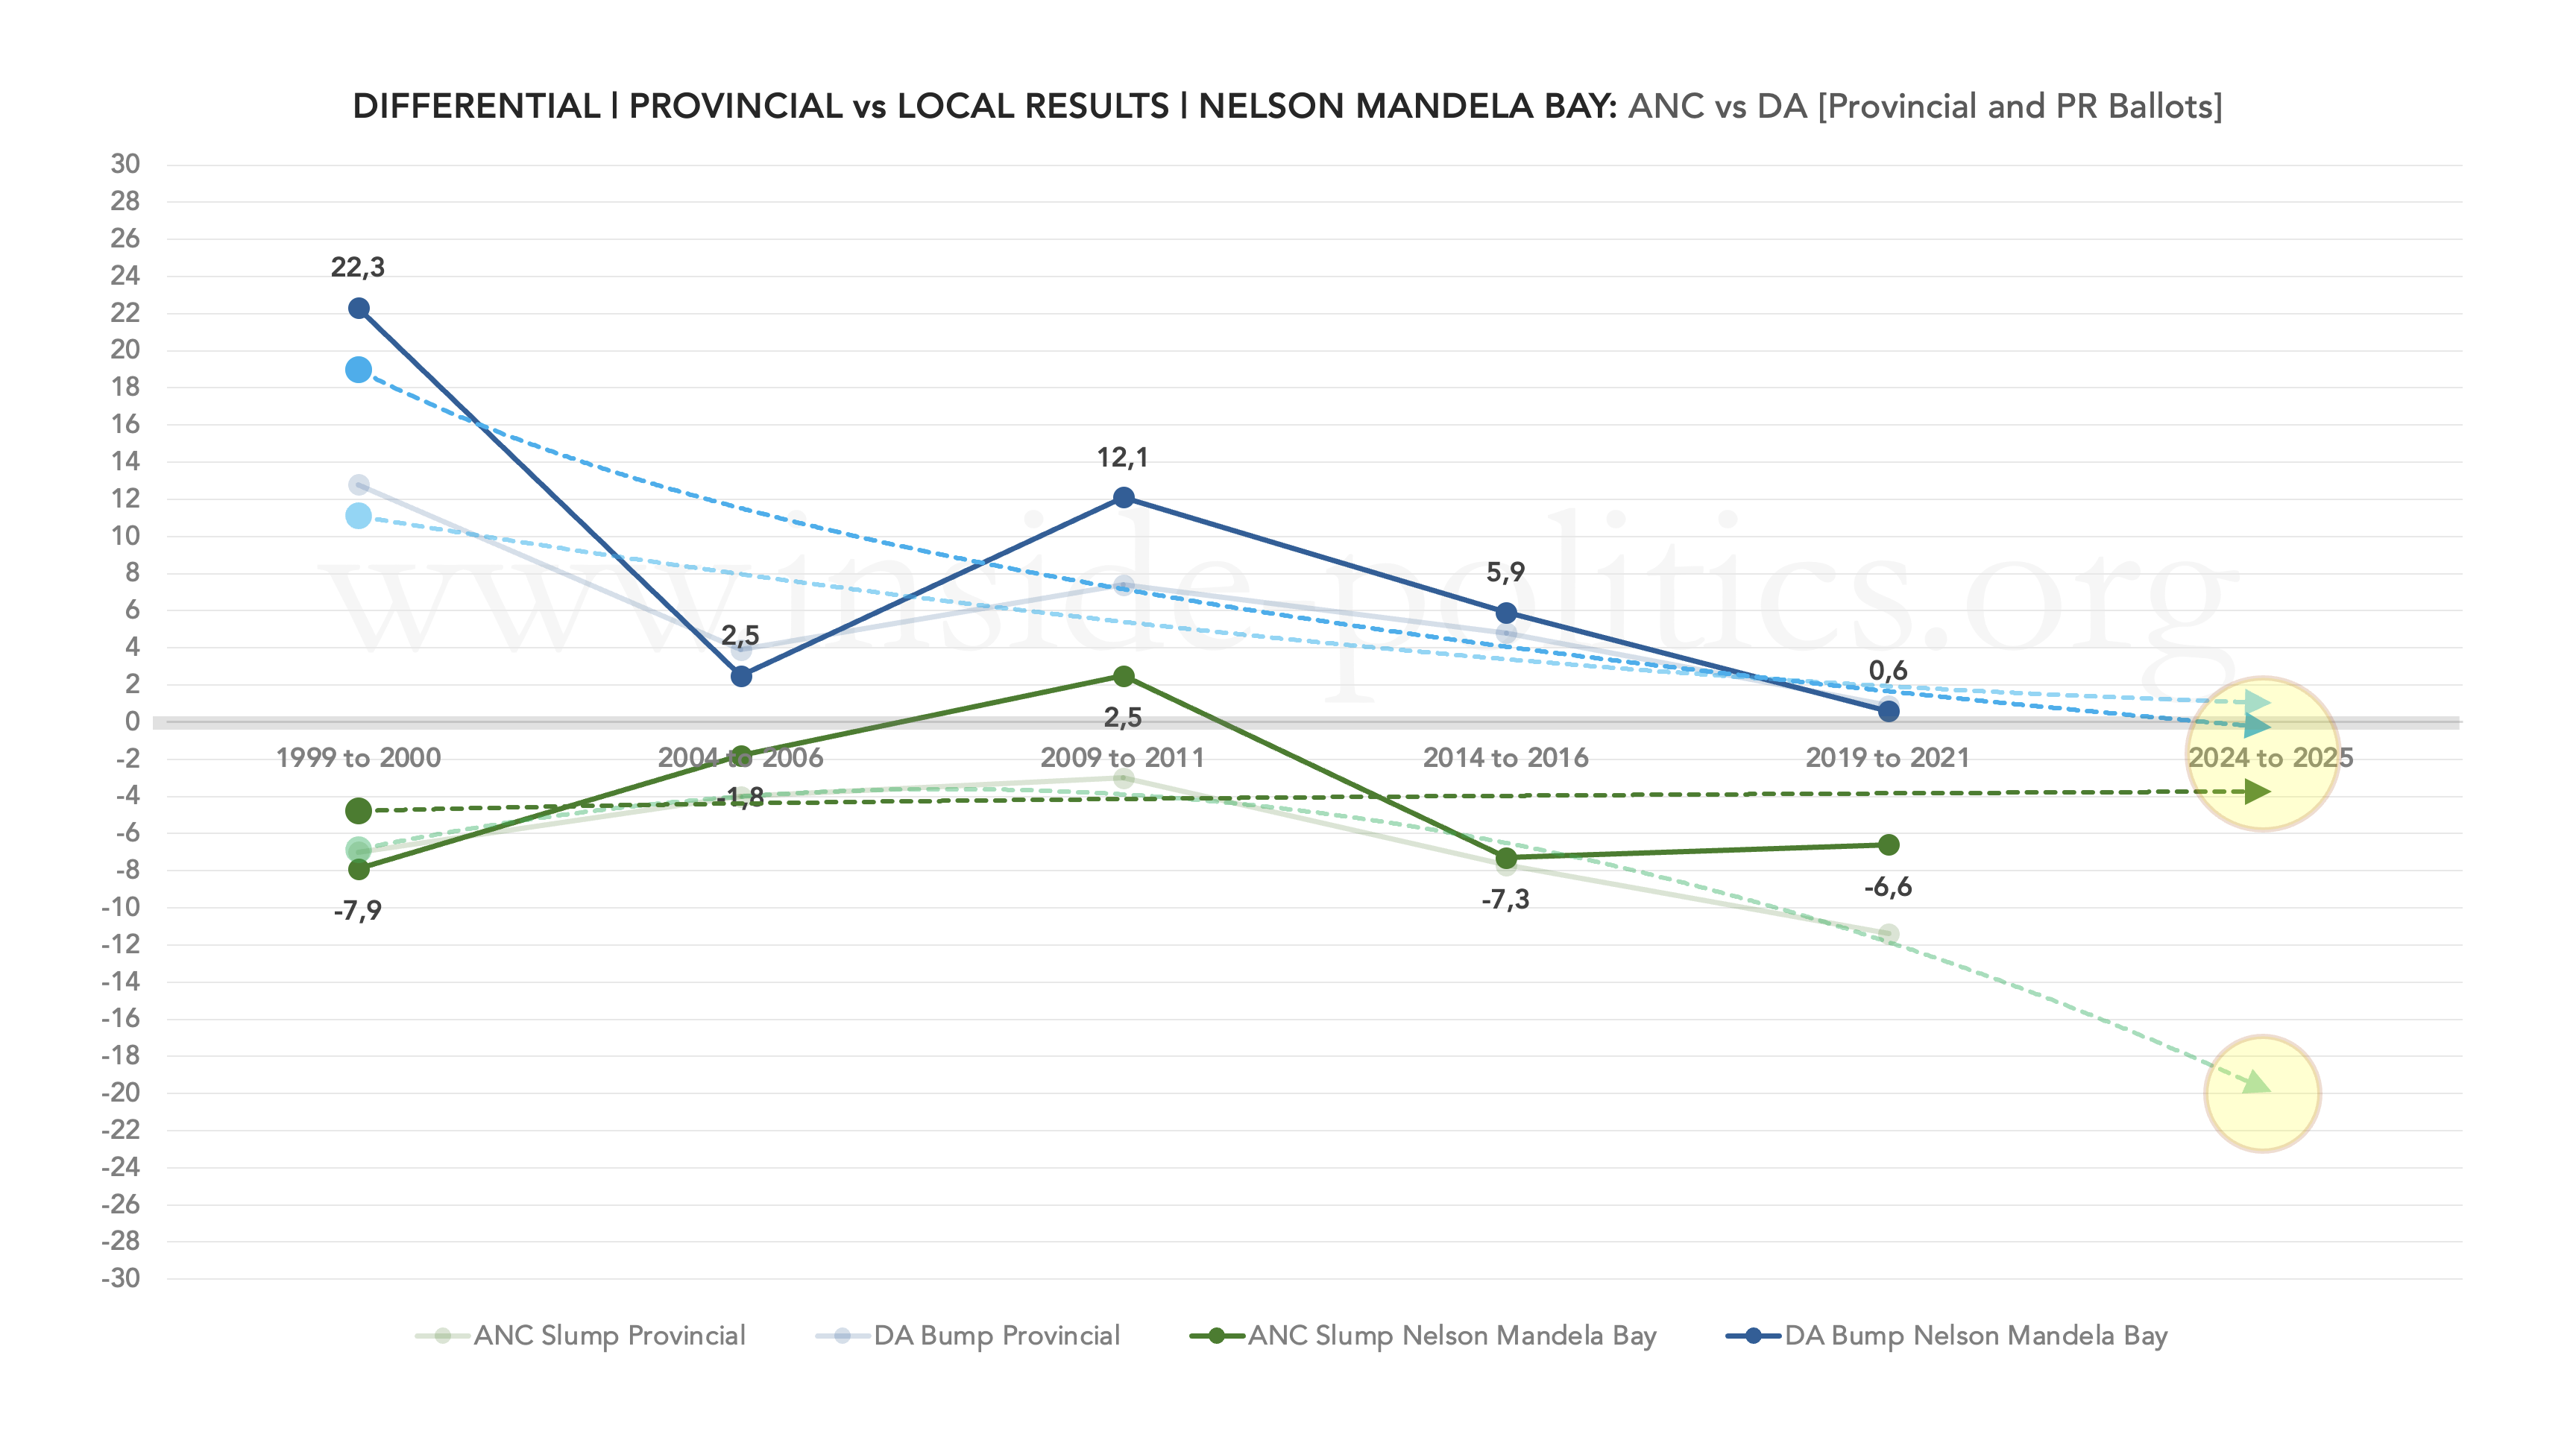
For the last three full election cycles (2009–2011, 2014–2016, and 2019–2021) each party fared as follows:
ANC:
- 2009–2011: +2.5 points
- 2014–2016: −7.3 points
- 2019–2021: −6.6 points
DA:
- 2009–2011: +12.1 points
- 2014–2016: +5.9 points
- 2019–2021: +0.6 points
Remarkably, the ANC achieved a positive differential in 2011—that is almost without precedent for the party. Also unique (to date) is the fact that, while it did slump to −7.3 points in 2016, it actually managed to reduce that slump (to −6.6 points) in 2021—and remember that was a year turnout across the board plummeted. The result is a smooth trendline for the ANC—admittedly marginally below zero—but a world apart from other metros, where it tends to slope down at a dramatic rate.
The DA, unusually, fares much worse. Its turnout differential has crashed; with it, its ability to take disproportionate advantage of the ANC’s typically poorer local government performance. As of 2021, the DA’s trendline is hovering just above zero. And while that trendline suggests it will level out (as with its vote share, based on good historical performances), the last three dots suggest otherwise: that it too, like Johannesburg, is headed firmly into negative territory. If that happens, it will be a real crisis for the DA’s prospects.
Finally, before moving onto a more granular, ward-by-ward analysis, below is what the ANC and DA vote share looks like when plotted on the same graph.

From it, you can see two things clearly:
- How interwoven the two parties are, as each battles for ascendency; and
- How both are slowly spiralling downwards, like two protagonists locked in an underwater conflict, throttling each other as they slowly sink.
In 2014, both parties were in the 40%–50% bracket. As of 2024, they are both in the 30%–40% bracket.
A Ward-by-Ward View of Nelson Mandela Bay Turnout
As in previous essays, I have condensed each of the ward-turnout graphs into a single timelapse video.
It comprises a series of six scatter graphs that show ANC turnout (the ANC’s PR vote divided by the total registered voting population) in every NMB ward, starting with a combined graph and then one for each of the last five local elections—2000, 2006, 2011, 2016, and 2021. Each dot represents a ward. The ANC’s turnout percentage runs up the Y-axis, and the size of the ward (in terms of registered voters) runs along the X-axis. So, what you want as a political party are dots up and toward the right-hand corner (big ward/high turnout).
(The individual graphs are available on the Resources page.)
The ANC to date has been incapable of escaping the suffocating effect of declining turnout among its supporters, and it is no different in NMB. But the decline is pronounced here. Consider the ANC’s performance in 2000 and 2006. In both years it had phenomenally good elections, with a significant number of wards not just on the turnout average but above it.
Since then, two things have happened:
- General turnout has declined; and
- The ANC’s turnout has declined even more.
So, like the DA, and regardless of its earlier success, in both 2016 and 2021 all its dots sat well below the turnout average. It is now, as in every other metro, a party suffering a decline in enthusiasm far in excess of the general sentiment, which itself was fairly dismal.
The DA’s graphs, below, are perhaps a little more positive, but there is a strong case to be made it is following the pattern set by the ANC—it just hasn’t fully played out yet.
In 2011 and 2016 were its zenith: high general turnout and exceptionally good turnout in DA strongholds (on or above the turnout average). 2021 was a different story—turnout dropped dramatically, and the DA’s turnout did in turn. Although some of its wards still manage to break the average, and sit above it, most dropped—and those already below the average dropped further still. Those strongholds offer some hope for the DA. The ANC, by contrast, cannot rely on its strongholds to perform in this way.
Trade-Offs
As usual, to conclude this analysis: trade-offs and the relationship between the ANC and DA vote. If ANC votes go up, do DA votes go down? To track this, we again need to plot every ward as a dot on a grid. But in this case, each dot represents the change in support, not a ward. If the ANC gained in the ward, the dot moves up; if the DA gained, the dot moves right. In this way, we can split the chart into four quadrants:
- Q1 (top left): ANC up, DA down
- Q2 (top right): ANC up, DA up
- Q3 (bottom left): ANC down, DA down
- Q4 (bottom right): ANC down, DA up
So, from the ANC’s perspective, a good election is when a large number of dots are in Q1 (ANC up, DA down). From the DA’s perspective, a good election is when a large number of dots are in Q4 (ANC down, DA up). And from both parties’ perspective, the place you don’t want to be is Q3 (ANC down, DA down).
Because wards change, we can’t run this for all election years (you need consistent wards between elections to see the change), but we can run it for 2000 to 2006 (54 identical wards in both), 2011 to 2016 (60), and 2016 to 2021 (60). If we do that, we get the following three graphs:

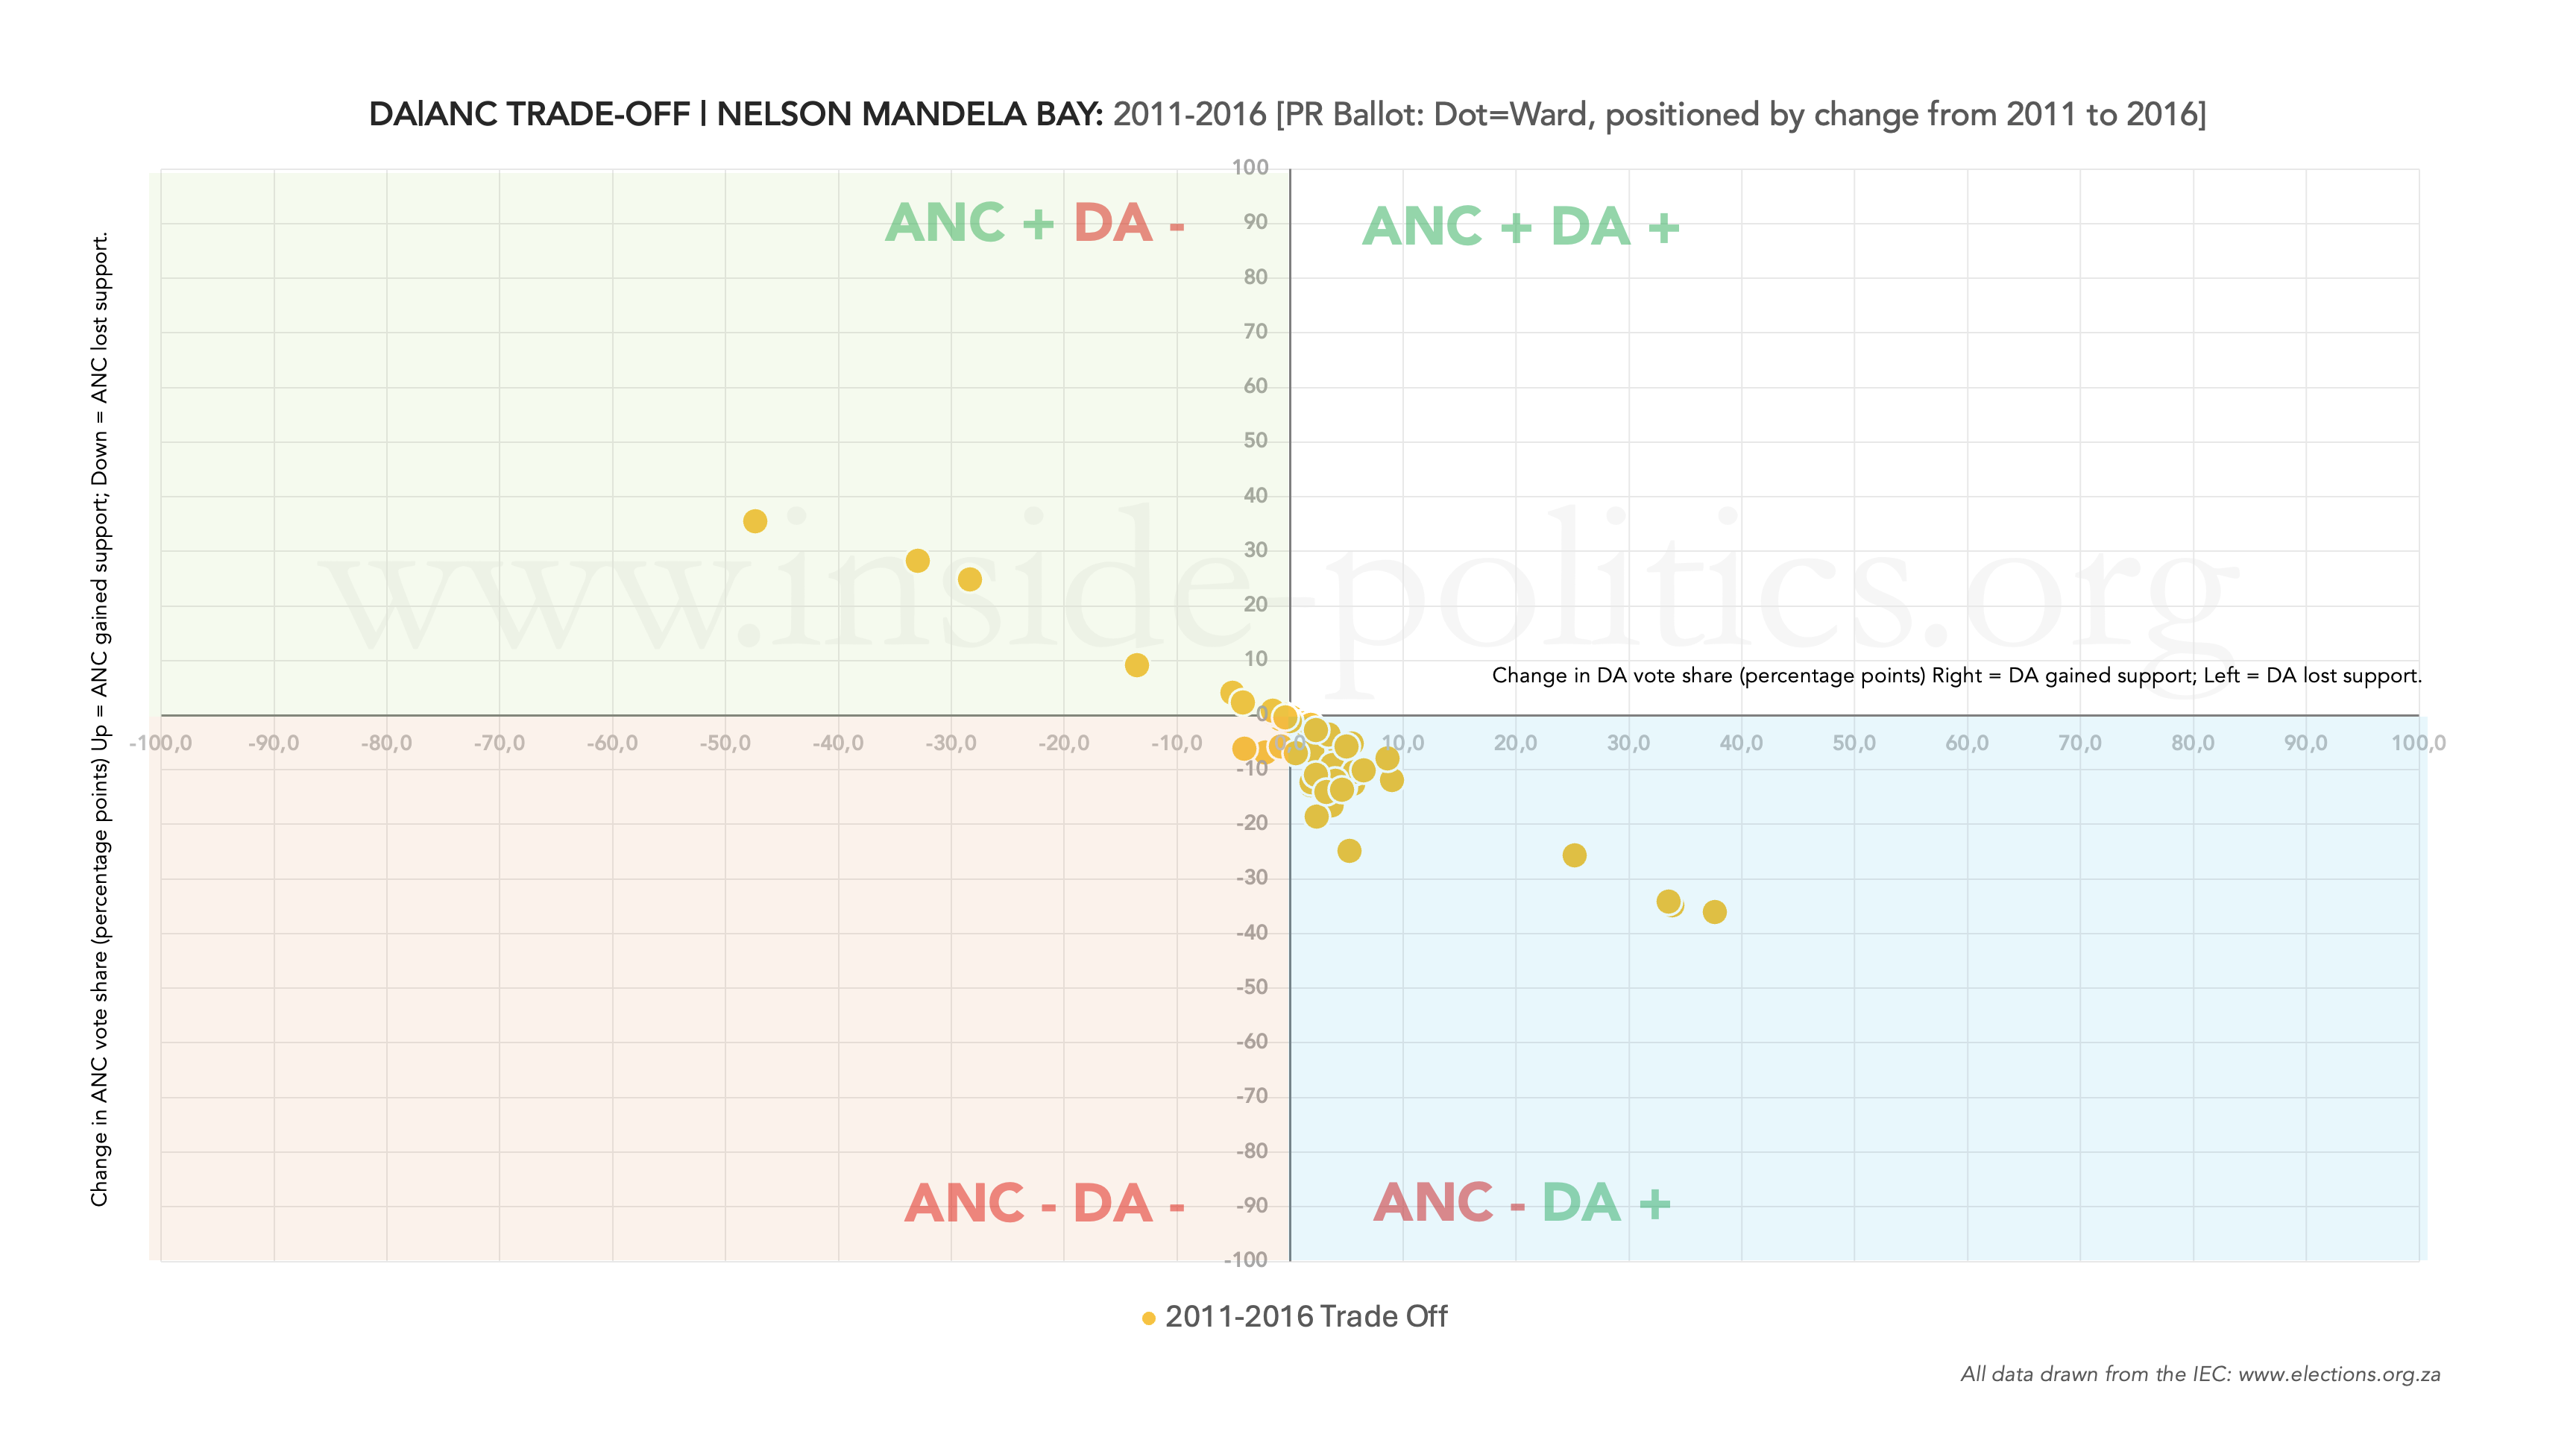
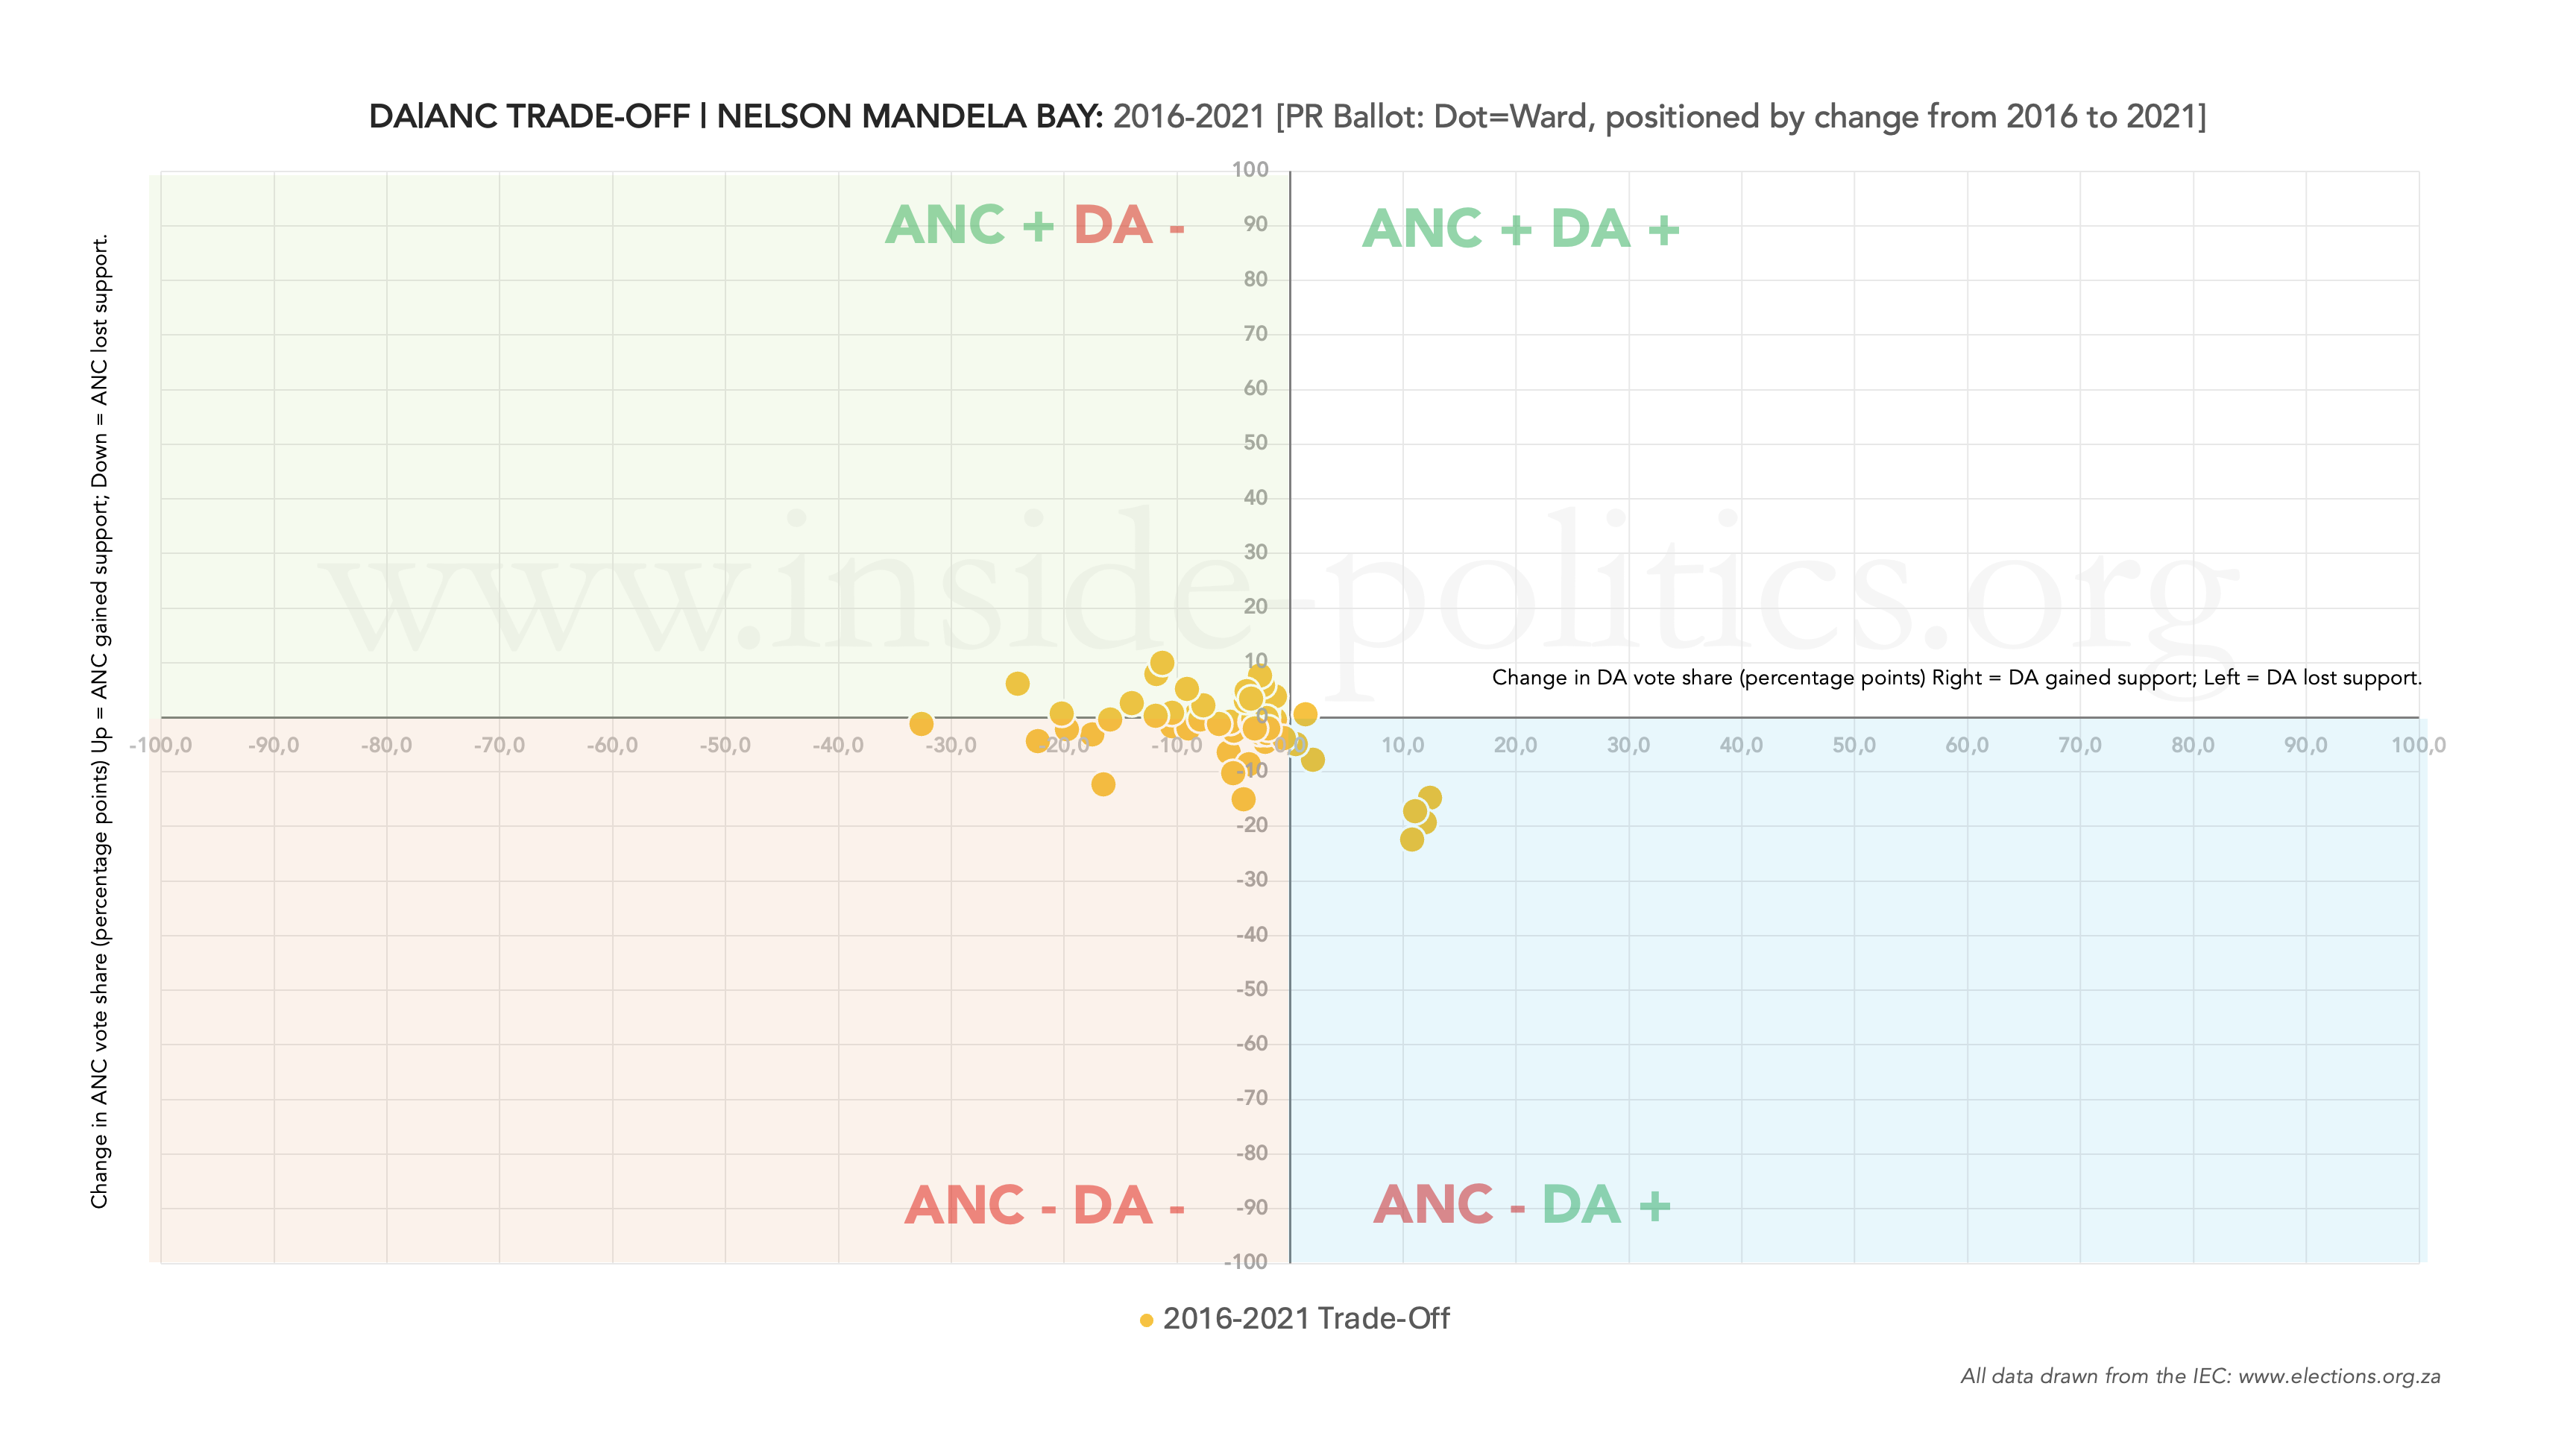
Although not a video, it is helpful to look at these three graphs as a timelapse. Do that and you can see the diagonal spread of dots from 11 o’clock to 5 o’clock in 2006 (in which both the DA and ANC did well) shortens in 2016 and by 2021 vanishes altogether, with all dots clumped in the middle—suggesting no comparative movement at all.
This suggests that while both the ANC and DA were able to win support in a number of wards early on, by 2021 they had been reduced to stalemate: no new votes, and no movement. If that pattern continues in 2026/7, those dots—for both parties—are likely to all move into Q3, and you don’t want to be there.
Conclusion
NMB is unique in so far as it constitutes a classical democratic contest—two large parties fighting for dominance and an outright majority. But it is also an unusual contest, because the result has not been one party rising to the fore but rather both parties dragging each other down.
So the big question is: where are these other votes going? Both the ANC and DA have demonstrated historically that they have the potential for a 50% majority. Now both seem only able to boast the possibility of a simple majority, and 40% is the goal. The specific answer to that question lies in a separate essay, but the general answer is easy to deduce: new parties are making up the difference. Long term, this suggests that NMB might soon lose its defining two-party characteristic—if it hasn’t already—and become just as complicated as the other metros.
As far as those two parties go, though, we do know the following:
- The ANC’s vote share is in decline and, while it does seem capable of resisting the DA’s traditional turnout differential, that is a relative benefit. Enthusiasm amongst its supporters is declining faster than the average.
- The DA’s vote share is also in decline. It will be hoping 2026/7 will see a spike in enthusiasm. It can rely on the fact that its bigger strongholds are generally more motivated than the average, but it cannot wholly rely on that.
It is hard to say to what degree the ANC and DA are responsible for their collective decline. Has the reliance on unstable coalitions done their prospects more harm than good? You feel, if the DA had just managed to breach 50% in 2016, its prospects might have been different. That lack of real control, and the messiness that accompanied it, has perhaps seen a number of potential ANC and DA voters return to smaller parties that can afford to be less compromising.
A rising tide lifts all ships. But the tide in NMB is going out. The ANC and DA aren’t quite stranded yet, but as the water drops, so too does their potential – it becomes a game of diminishing returns – and a 50% majority for either party in the metro will now rely on a 2026/7 Christmas miracle, more than anything else.
This essay is the 6th in an on-going series on Election 2026/7, for all other editions of this series, please click here: Election 2026/7
Discover more from inside politics
Subscribe to get the latest posts sent to your email.

You must be logged in to post a comment.