
Election 2026/7 [8] Turnout, Cape Town, the ANC and DA
by The Editor

A comprehensive look at turnout trends in Cape Town, with a focus on the ANC and DA. The DA’s urban stronghold, which boasted a 66% majority at one stage, now sits in the 50% bracket. The ANC has faded away into obscurity and, in its wake, the rise of smaller parties, along with declining turnout, would now seem to pose the biggest threat to the DA’s dominance.
Turnout, Cape Town, the ANC and DA
By: Gareth van Onselen
Follow @GvanOnselen
27 November 2025
This essay is the 8th in an on-going series on Election 2026/7, for all other editions of this series, please click here:Election 2026/7
Introduction
This is the eighth in a series of in-depth, statistically driven analytical essays on the upcoming local government elections (to be held at some point between November 2026 and January 2027). Following our analyses of Johannesburg, Tshwane, Ekurhuleni, eThekwini, Mangaung, Nelson Mandela Bay and Buffalo City, this essay looks at Cape Town, the last of South Africa’s eight metropolitans. Next, we will look at some heat maps of the metros (which I am excited to show you), before returning to a composite analysis of all eight metros, now that we have a consolidated data set.
Cape Town is the DA’s metropolitan stronghold and the backbone of the party’s urban support. The party has had a grip on power here since 2006 and an outright majority in the metro since 2011. It is, simultaneously, the ANC’s weakest metro. Its support in Cape Town has systematically retreated to the edge of oblivion, as it has—in the Western Cape generally—been unable, and perhaps unwilling, to adapt to the demands of opposition politics.
The city is, in many ways, a laboratory. In it, the conditions have been created for life after the ANC, and it has produced a litmus test that suggests that, should the DA ever gain an outright majority in any other metro, the ANC will likewise disintegrate. That seems unlikely, at least in the short term, which is perhaps why the ANC cares so little for Cape Town generally. It regards the city as a demographic outlier, about which little can be done electorally. The DA, however, sees Cape Town as a beacon to be replicated elsewhere; and the recipe through which it got there—consolidation, coalition and then complete control—is the formula on which it bases much of its contemporary politics.
Thus, statistically, in almost every way, Cape Town is the opposite of its metropolitan counterparts: an upside-down world that confounds the ANC as much as it has seen its vote share decimated.
Turnout: Cape Town
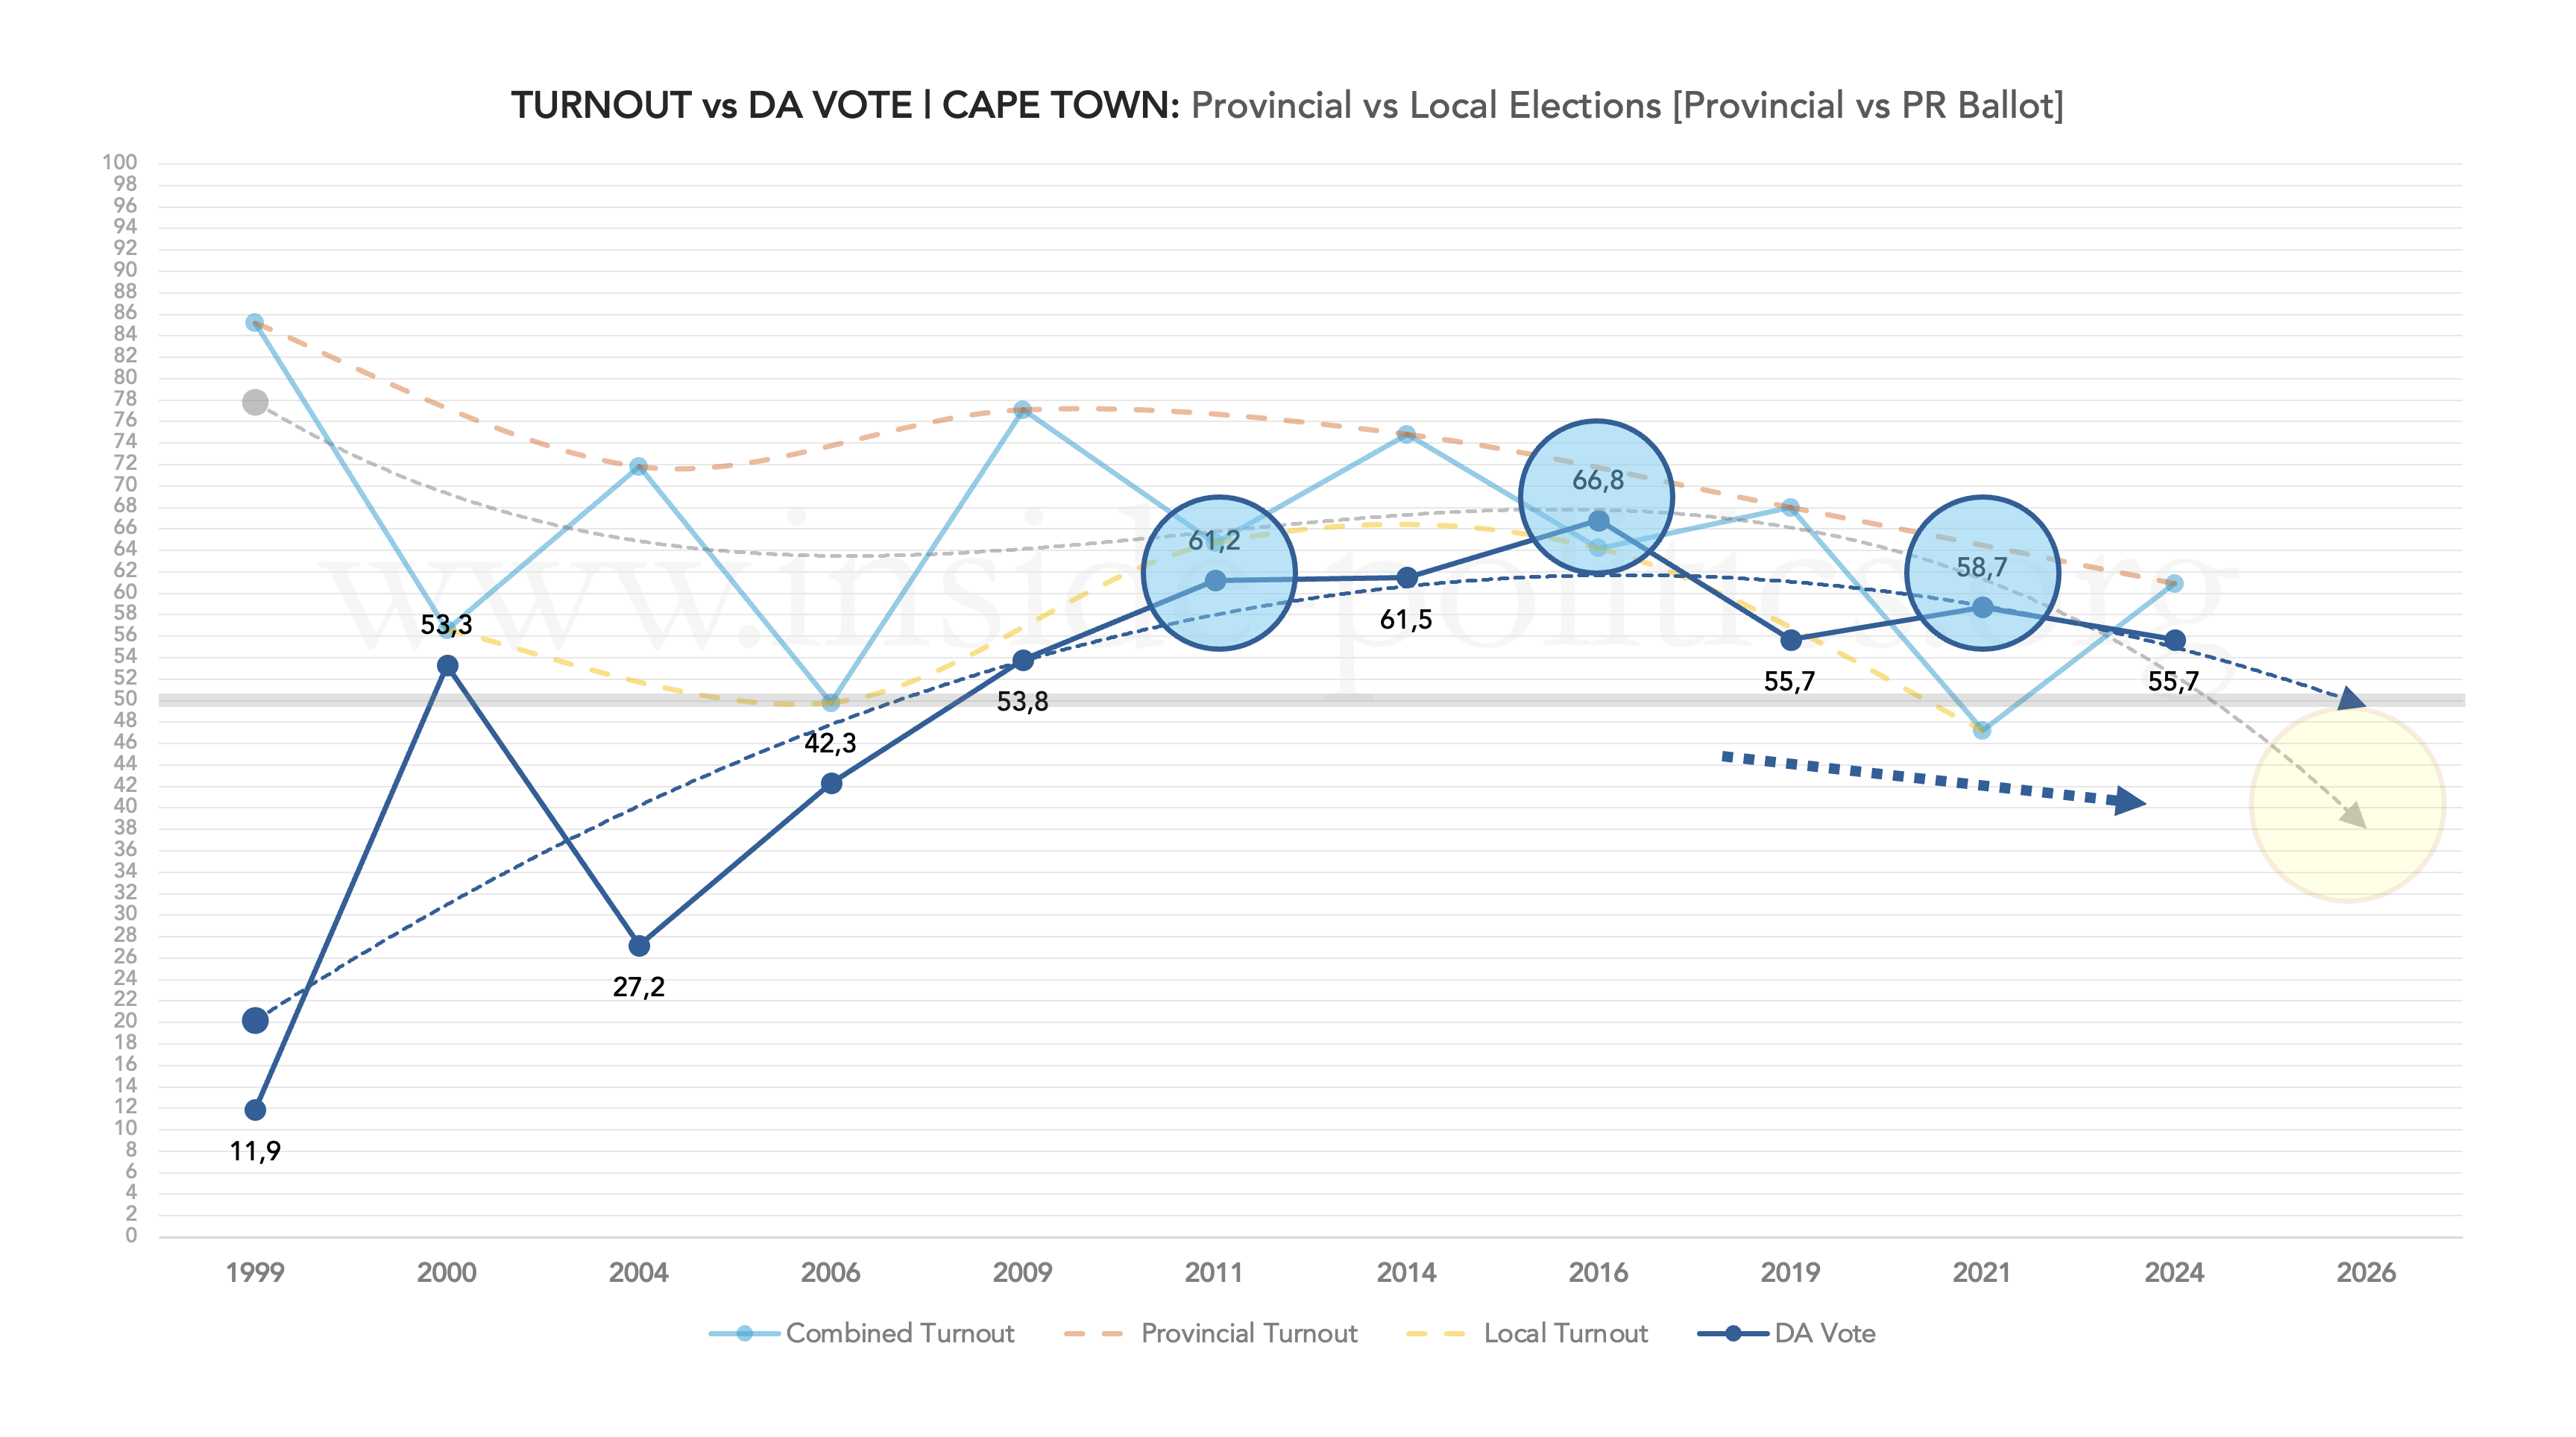
The DA’s golden period in Cape Town ran for a decade, from around 2009 to 2019. Although turnout fluctuated between national and local elections, as it does everywhere, for those ten years the graph (below) flattens significantly. Between 2011 and 2016, only 10 points separated the turnout high in 2014 (74%) from its lows in 2011 and 2016 (both 64%). That is quite something—and it was enthusiasm among DA voters that produced it.

Since 2016, however, it has been tougher going. Turnout plummeted in 2021 (down 17 points from 2016)—again, as it did everywhere. There was a recovery in 2024 (back up to 61%), but not quite to the highs the DA is capable of achieving. The result of all that is that, instead of the DA enjoying a 60%-plus majority, it is now firmly in the 50% bracket—still comfortably above 50%, but more fragile than it has been for some considerable time.
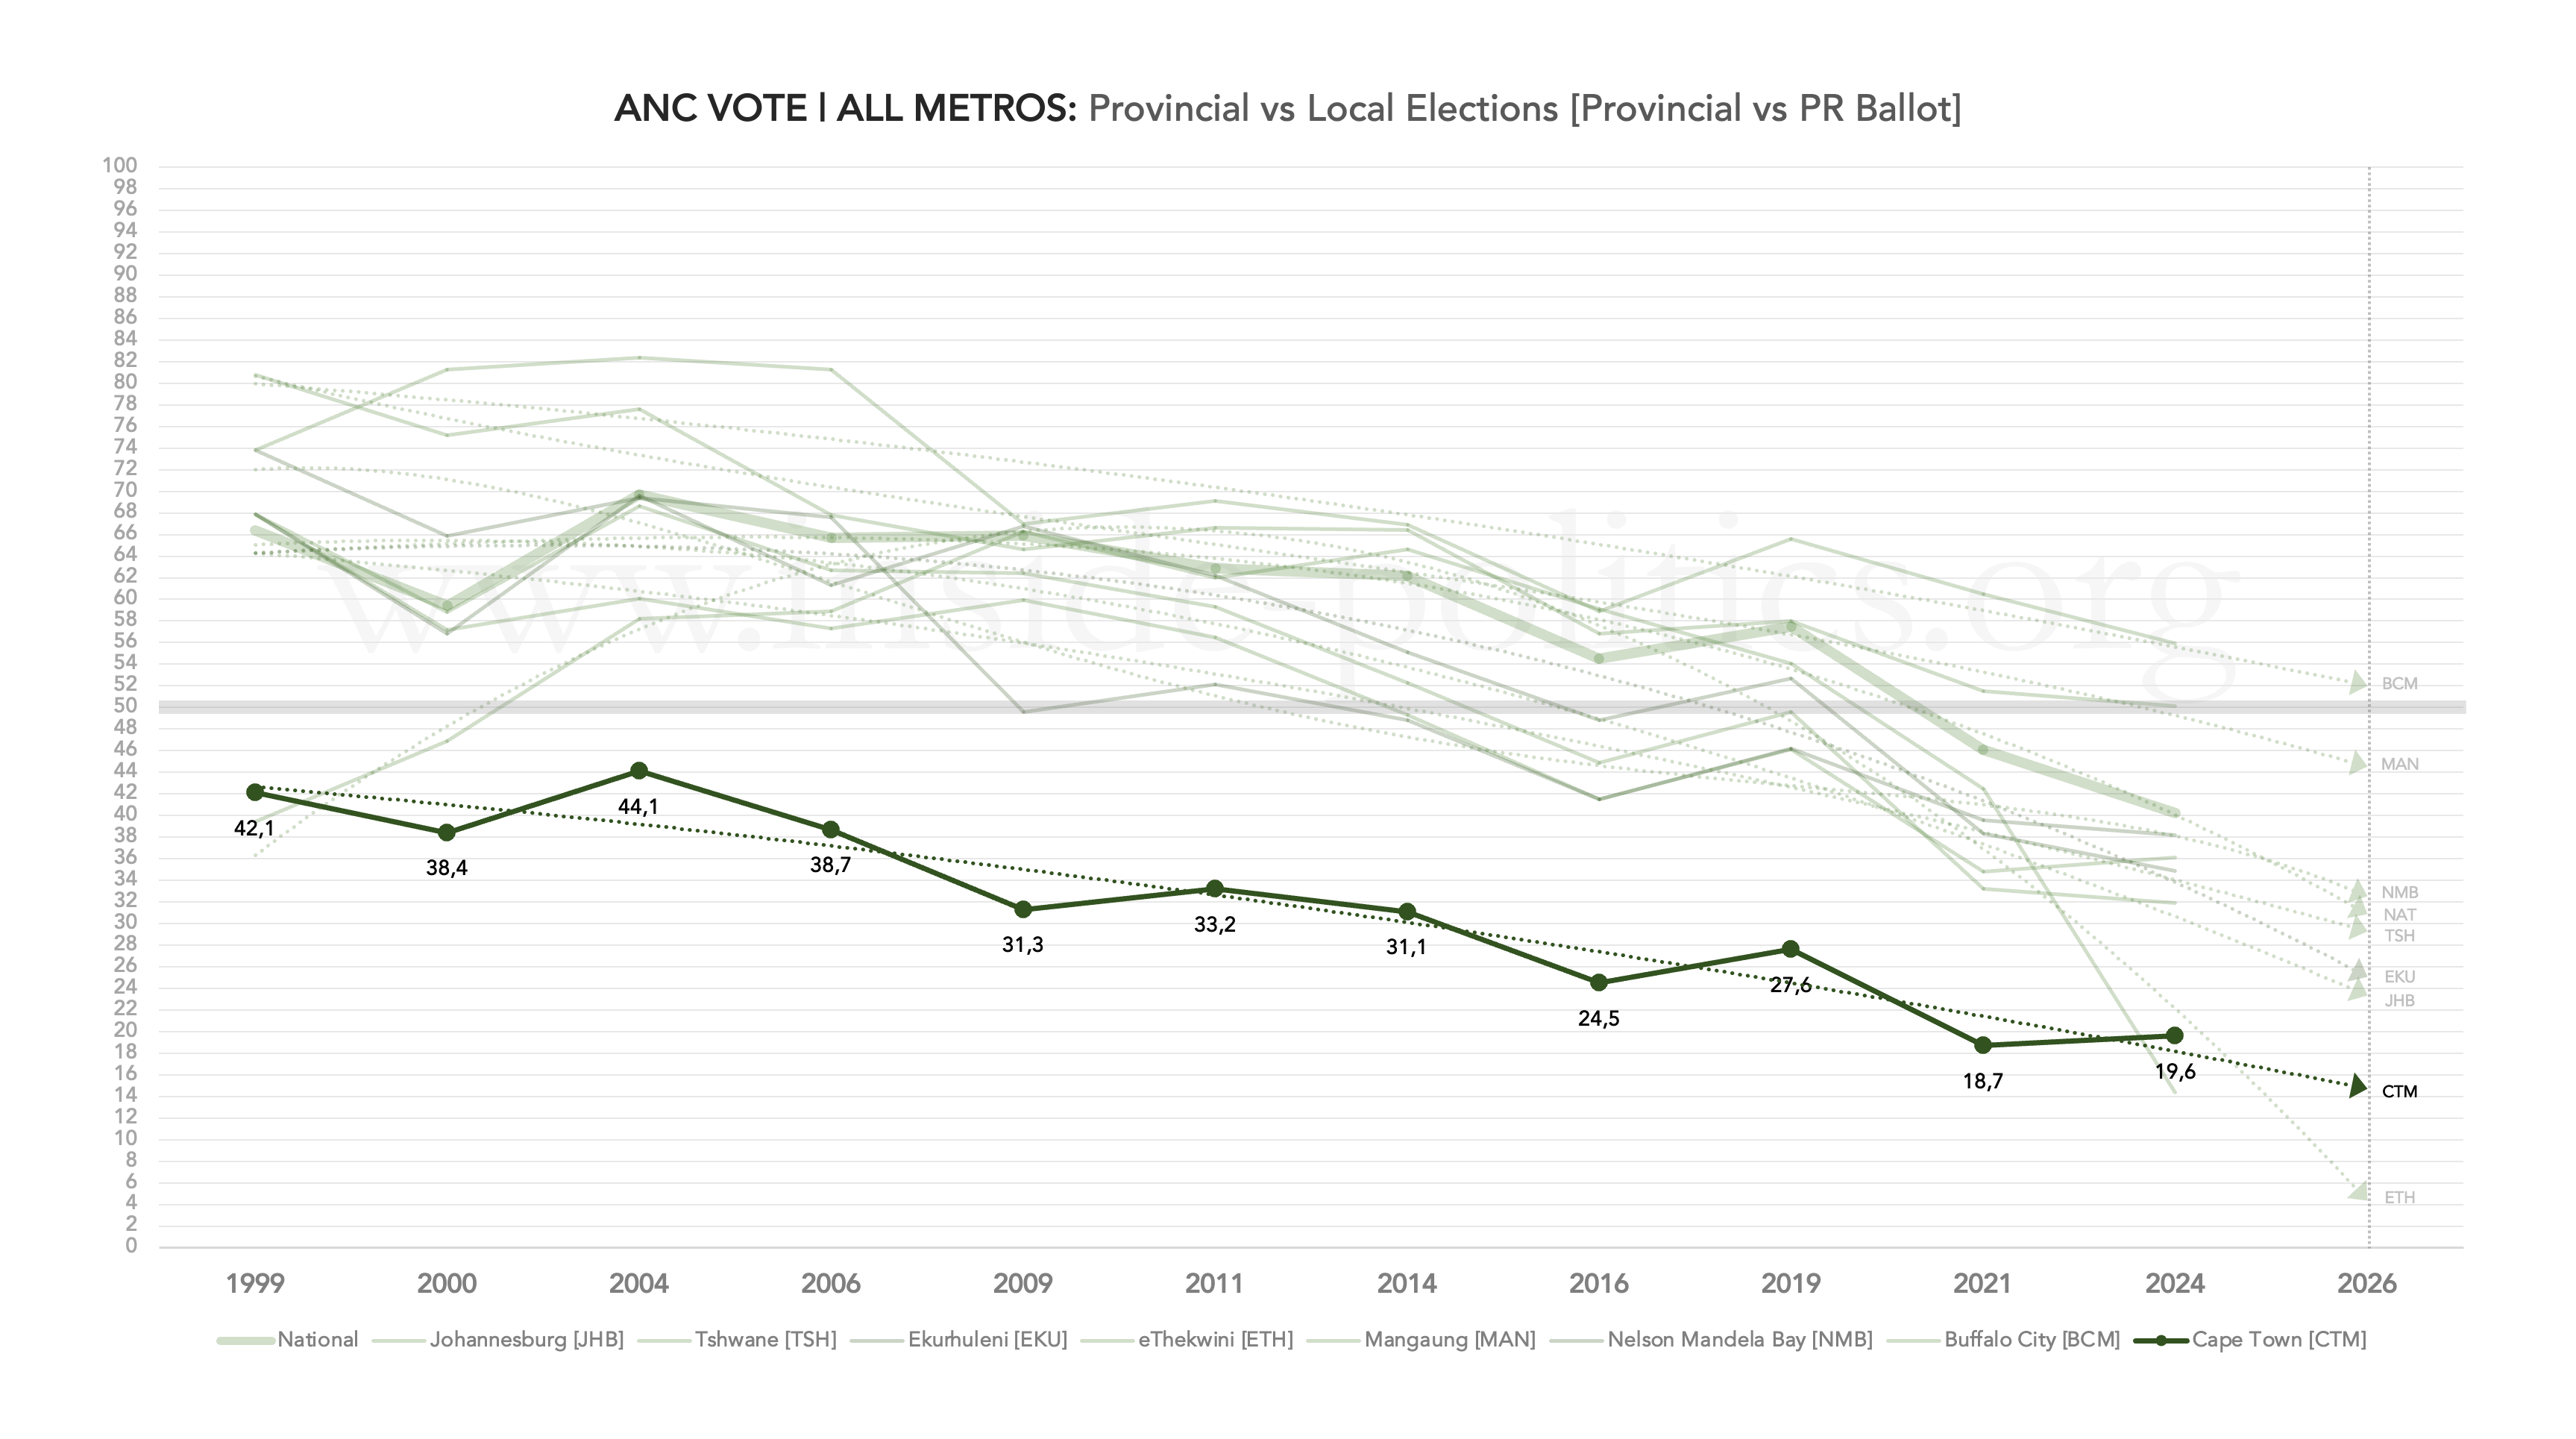
As for the ANC, its fortunes are best illustrated by its support levels, set out in the graph below.

What differentiates this graph from the other ANC metro support graphs is how systematic the ANC’s decline has been in Cape Town. For the most part, and in most metros, the ANC was more or less okay between 1999 and 2011—some decline, but nothing that could not be explained by general democratic apathy. 2014 was when things started to go seriously wrong. But in Cape Town it was ten years earlier, in 2004. And since then, its line is almost straight in how consistently its support has fallen.
As a result, its vote share has detached completely from general turnout trends—a sure sign that apathy alone is not enough to explain the ANC’s implosion. It has lost a significant number of voters, and they appear to be gone for good.
eThekwini, where the ANC was wiped off the map in 2024, slightly pips Cape Town as the party’s worst performance. But the ANC will likely bounce back a bit there. In Cape Town, the consolidated (and now complete) metro performances below suggest that the ANC has not yet bottomed out—more on that when we look at turnout differentials.
The DA’s graph, below, shows a dramatic rise to above 50% and then a flattening of the curve.
The trendline is probably a bit cruel to the DA here, as it fails to account for the local-election “bump” the DA typically experiences (see the three blue circles). For those interested, the DA’s artificial spike in 2000—when the party was formed—is responsible for this. So the party’s real battleground is likely between 55% and 60%, rather than between 55% and 50%. But, as elsewhere, it is turnout that determines which of the two is more likely.
2016 and 2021 are worth noting. The DA beat the turnout trendline in both those years—the only times it has ever done so, in any metro, in any election. And while its percentages are generally not enough to do that in most places (it came close in NMB in 2021), they suggest that general turnout patterns and the DA’s particular turnout dynamics in Cape Town are very different. The DA is able to deliver a powerful differential, even in elections like 2021, when Covid suppressed turnout across the board.
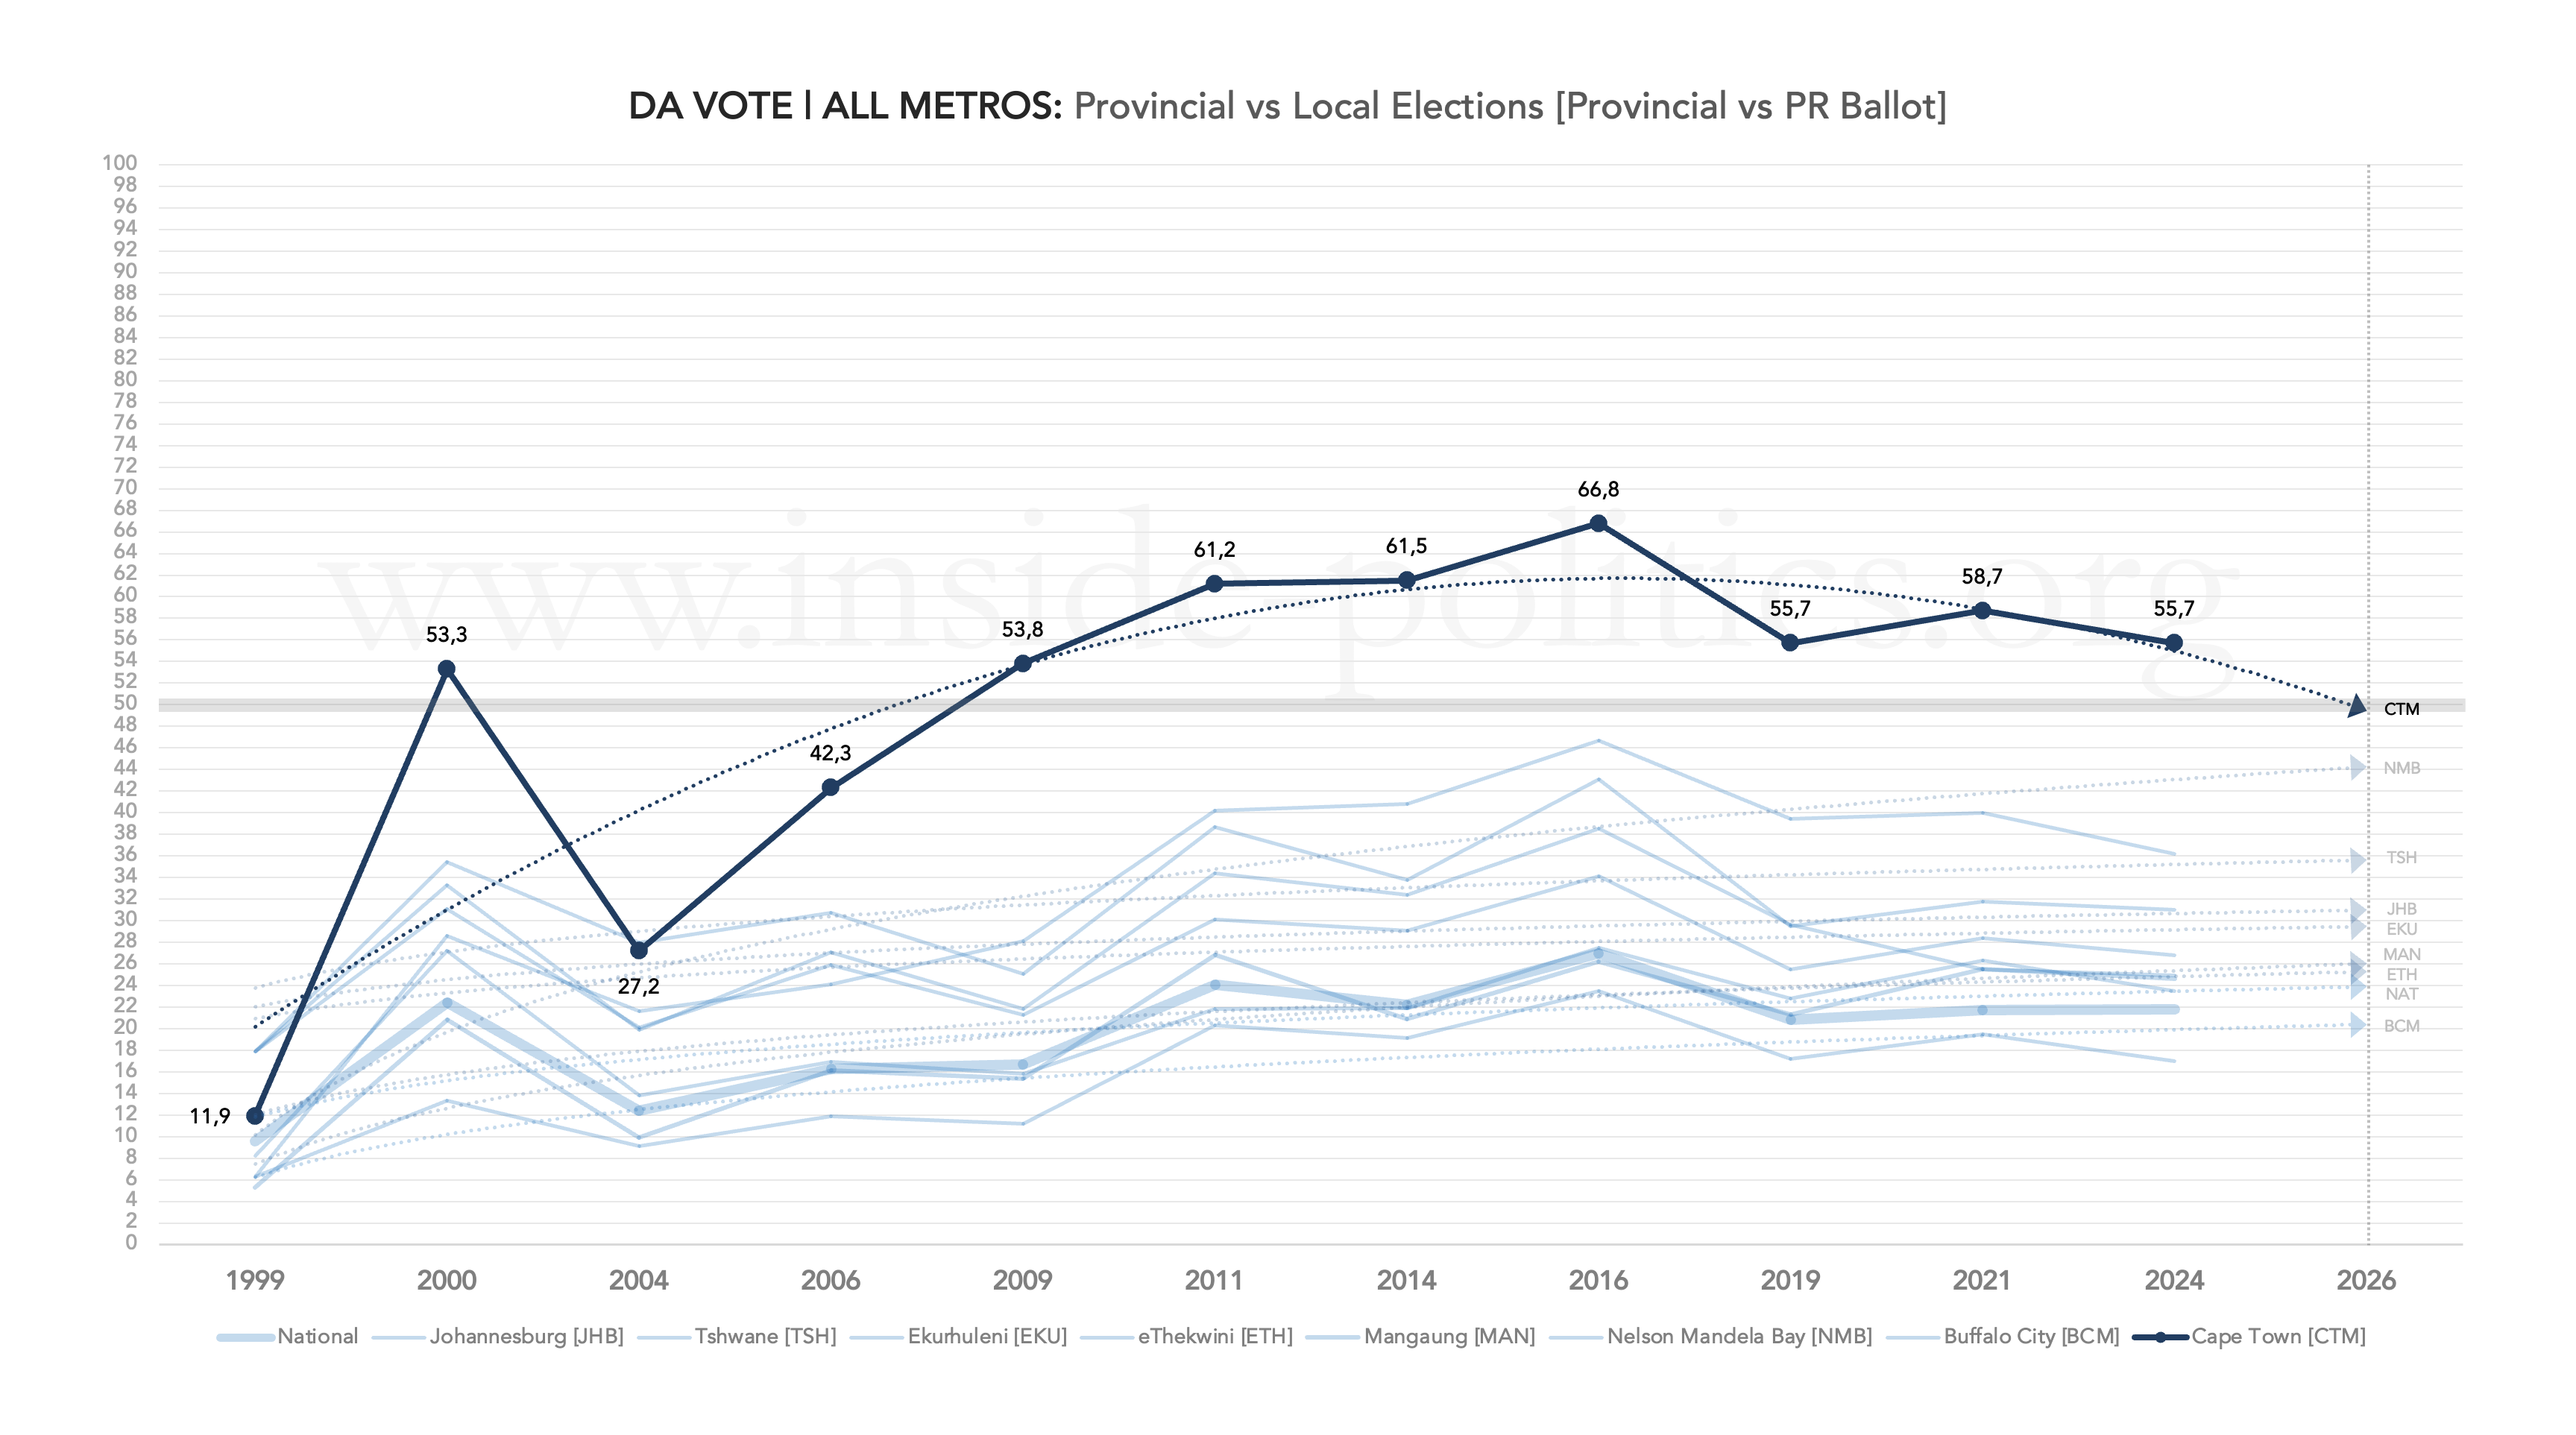
Among all metros (above), the DA’s performance in Cape Town is only unique in that it has breached the 50% line. Otherwise, the pattern evident in almost all metros is present here: systematic growth up until 2016, and then a levelling off.
Bumps and slumps
Let’s turn to turnout differentials. The graph below sets out the ANC’s and DA’s turnout differentials (between their performance on the provincial ballot, in national elections, and the PR ballot, in local elections).
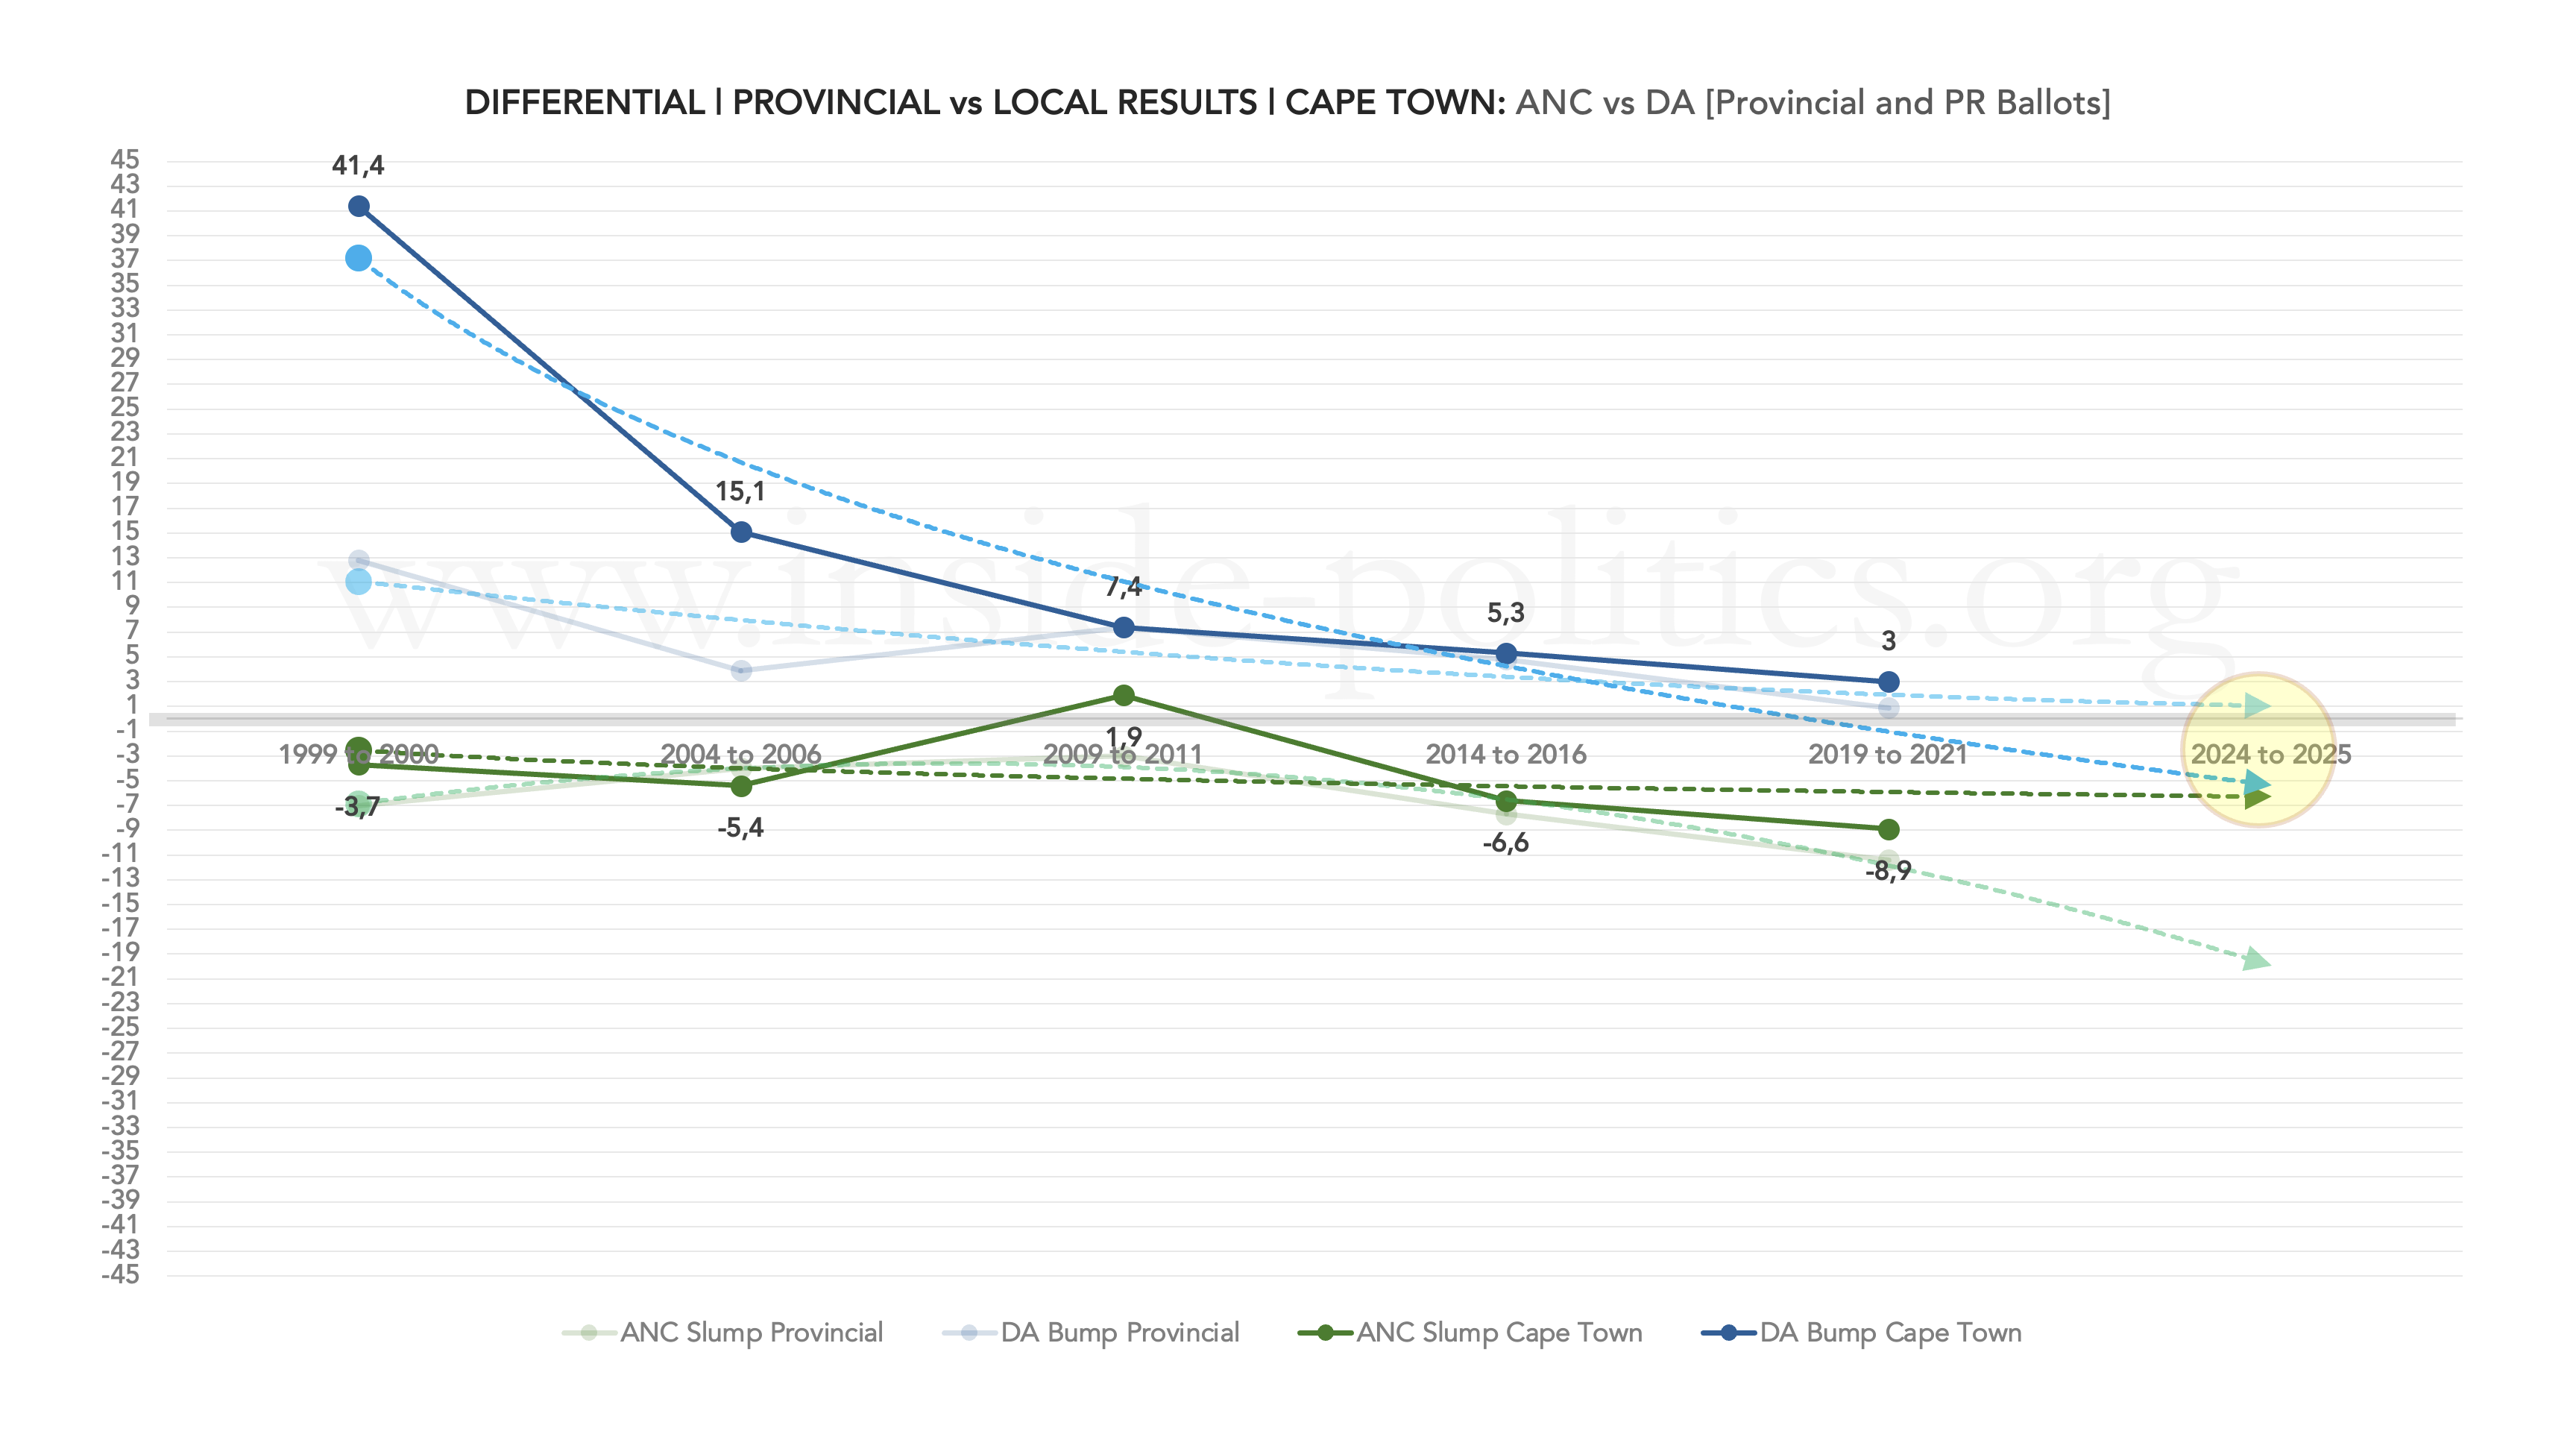
The exceedingly high differential the DA secured in 2000 is somewhat artificial, as it was a product of the party’s formation and the consolidation of Democratic Party and New National Party support. Nevertheless, while the party still enjoyed a positive differential in 2021 (+3 points), that is the smallest it has ever been, and—like elsewhere—the DA’s local-election “bump” has declined fairly dramatically. The trendline suggests it will become neutral in 2026/7.
Here are the ANC and DA turnout differentials for the last three full election cycles (2009–2011, 2014–2016, and 2019–2021):
ANC
• 2009–2011: +1.9 points
• 2014–2016: -6.6 points
• 2019–2021: -8.9 points
DA
• 2009–2011: +7.4 points
• 2014–2016: +5.3 points
• 2019–2021: +3.0 points
Of course, the DA’s challenges here are relative: the ANC’s turnout differential has collapsed far more dramatically (down to -8.9 points in 2021). So even if the DA’s differential declines further in 2026/7, the ANC seems set to fall even further still, allowing the DA to retain its turnout advantage.
Again, this would suggest a 2026/7 DA result closer to 55% (what it got in 2024) or above, and the ANC would do well to stay above 15%. It is also worth noting that comparisons with the ANC in Cape Town are becoming less and less valuable over time, given how small the party has become. They are repeated here simply for consistency with the other metros. More important will be the impact of other, smaller parties on the DA vote—a subject for a separate essay.
To further illustrate the DA–ANC dynamic, the graph below maps their support on the same axes.
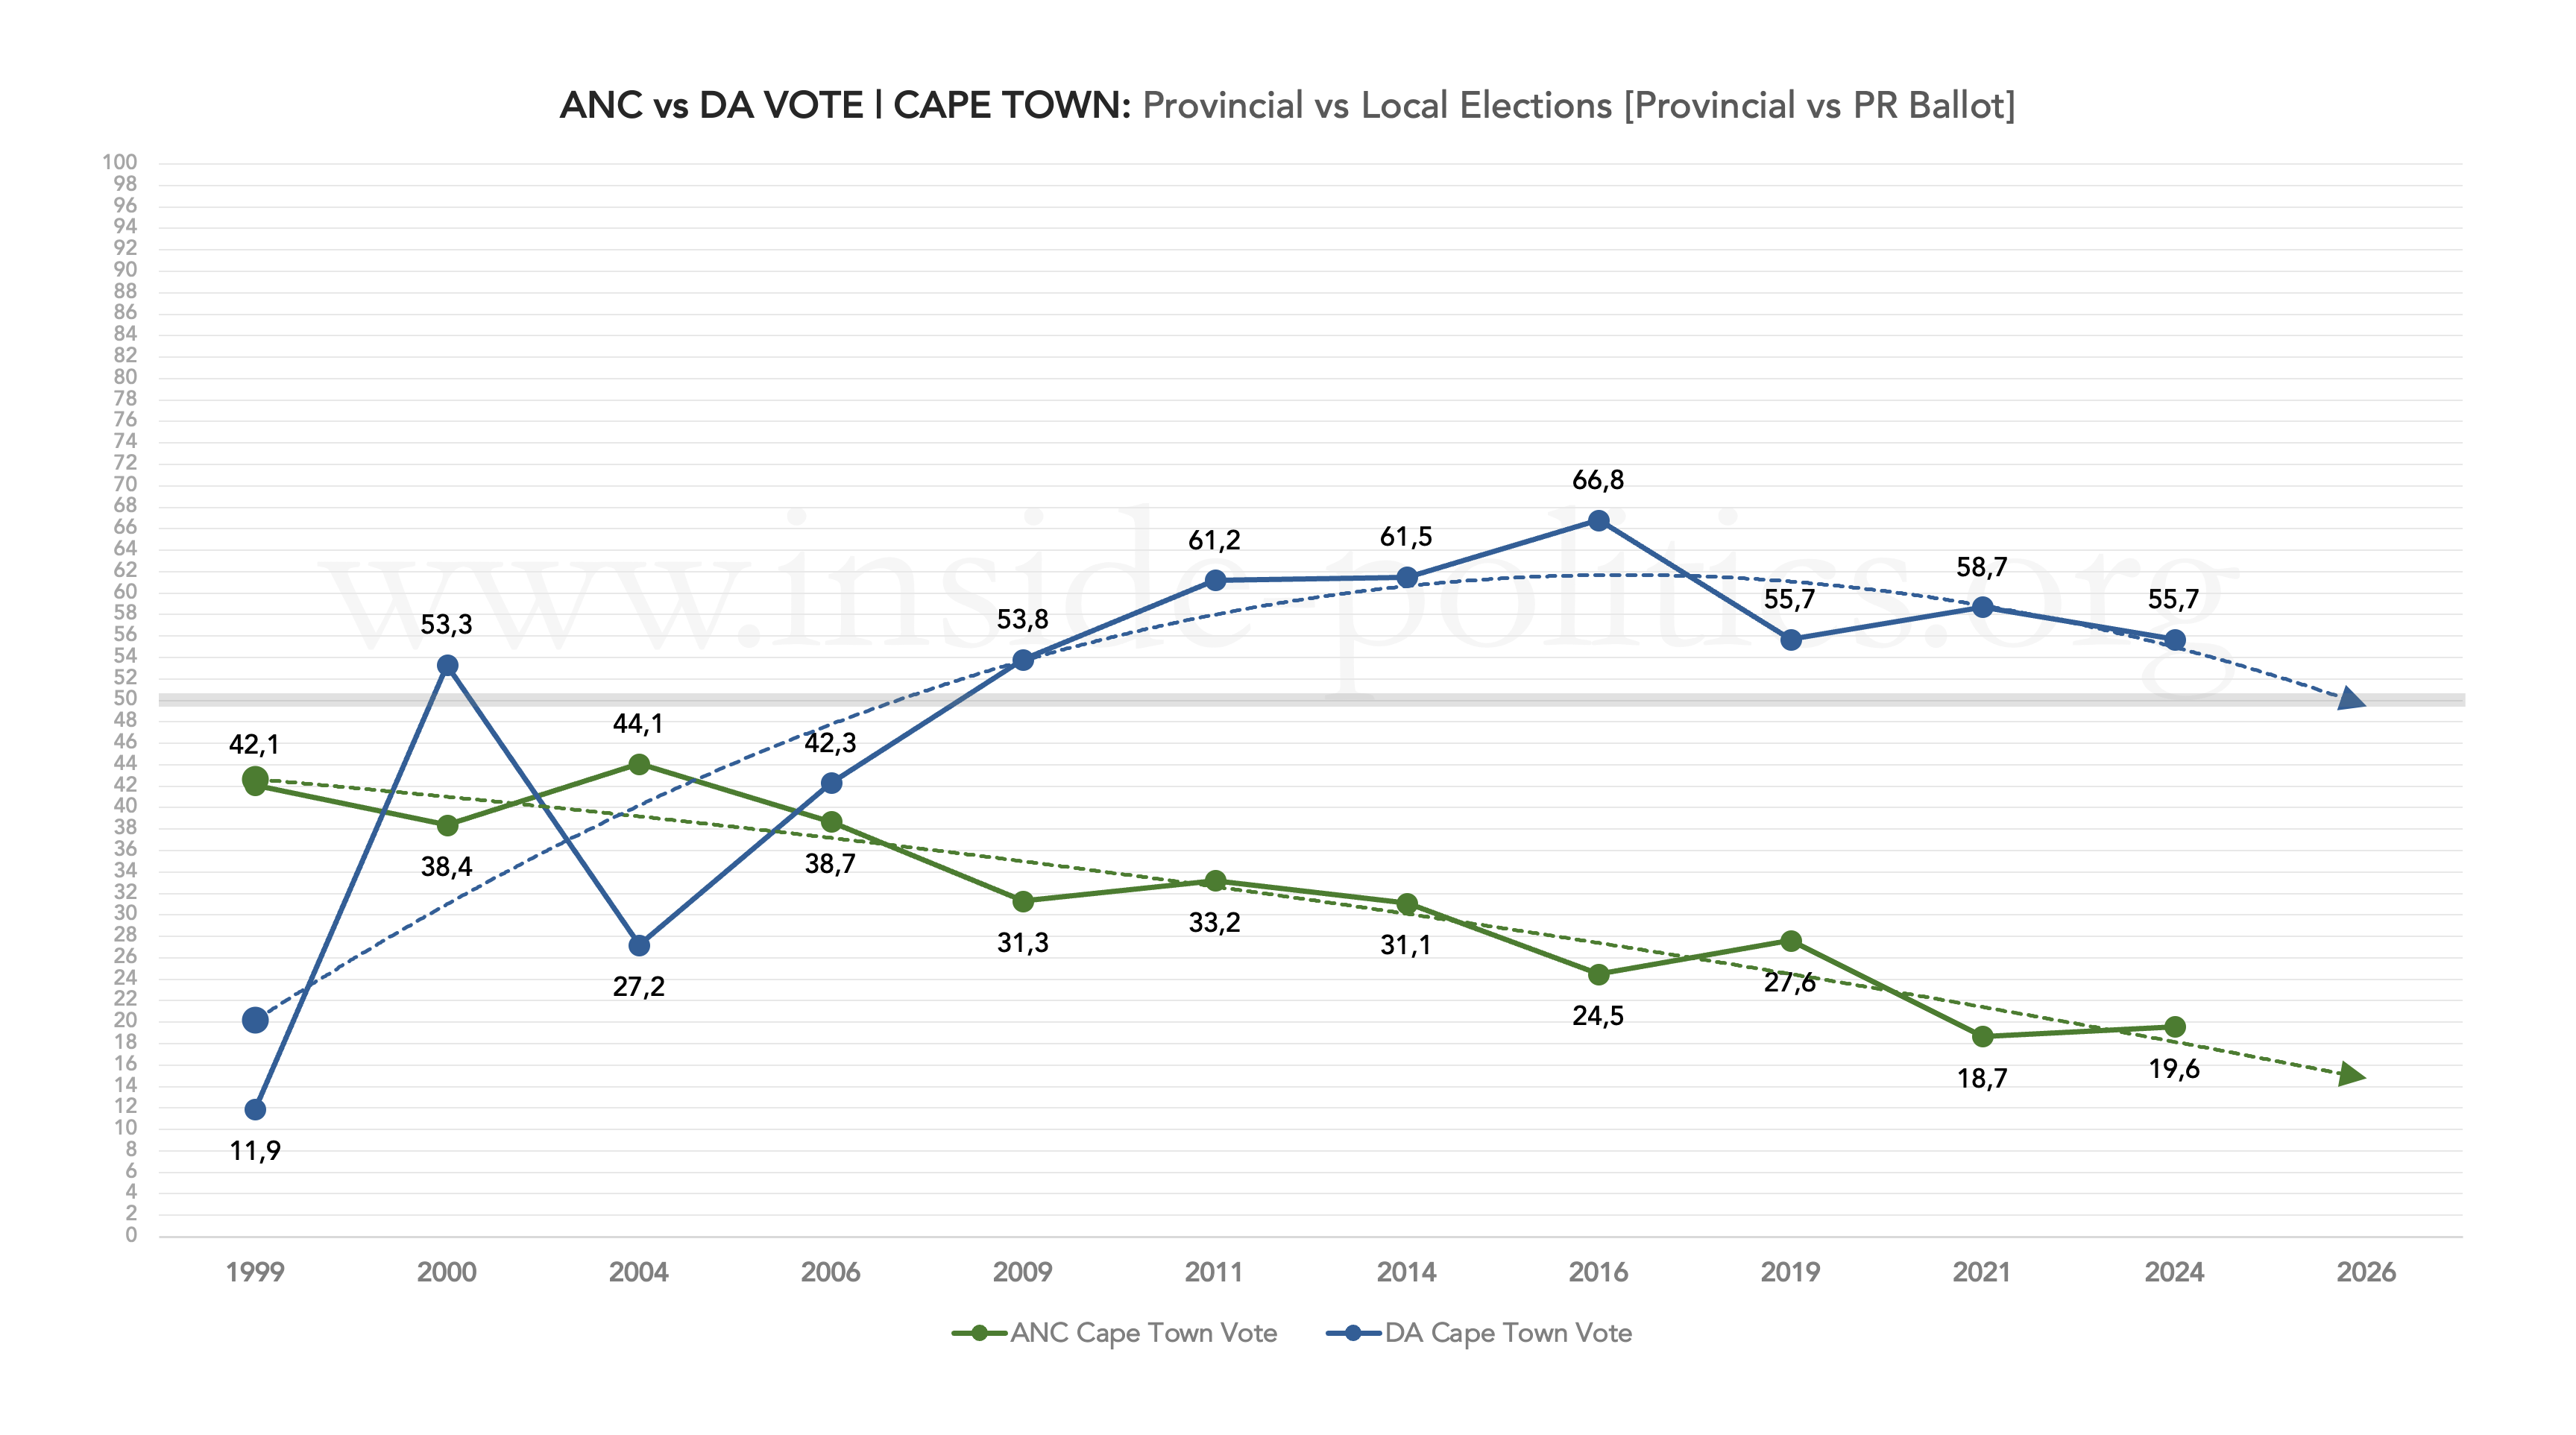
The greatest gap between the two parties was in 2016 (42.3 points). As of 2021, it was effectively unchanged at 40 points—still enormous. For those interested in how the DA achieved this, this essay from my previous election series may be of interest.
A Ward-by-Ward View of Cape Town Turnout
As in previous essays, I have condensed each ward-turnout graph into a single timelapse video. It comprises a series of six scatter graphs that show ANC turnout (the ANC’s PR vote divided by the total registered voting population) in every Cape Town ward, beginning with a combined graph and then one for each of the last five local elections—2000, 2006, 2011, 2016 and 2021.
Each dot represents a ward. The ANC’s turnout percentage runs up the Y-axis, and the size of the ward (in terms of registered voters) runs along the X-axis. What a party wants, of course, are dots clustered toward the top-right corner (large wards/high turnout).
(The individual graphs are available on the Resources page.)
The ANC has never had a truly outstanding election in Cape Town. Going all the way back to 2000, it failed to get a single stronghold to breach the average-turnout line. From there, things have only gotten worse, as the ANC cluster of dots gradually moves downward and consolidates at the bottom of the graph, with considerable distance between it and the turnout average.
It’s the same trend we have seen elsewhere, only in Cape Town it took hold ten years earlier.
The DA, as you might expect, and given some of the election results it has produced, has a number of outstanding elections.
In every election—including 2021, when turnout dropped nationwide—a significant number of its wards have breached the average-turnout line. It is true that this is a relative achievement, as generally declining turnout means those breaches comprise fewer and fewer people. Nevertheless, this too sets the DA in Cape Town apart: there is a core support base here that is absolutely dedicated to the party.
Notice too how few dots for the DA sit squarely on the bottom—a small minority of all wards—suggesting the party’s support is also very broad. It is the ANC that has the biggest cluster at the foot of the graph. In 2016, the DA managed to lift those dots off the floor, but that is the only time it has ever done so. If it wants to return to the 60% bracket, it will need to repeat that feat.
Trade-offs
As usual, we conclude with trade-offs and the relationship between ANC and DA votes. If ANC votes go up, do DA votes go down? To track this, we again plot every ward as a dot on a grid, but this time each dot represents the change in support—not the ward itself. If the ANC gained in a ward, the dot moves up; if the DA gained, it moves right. Thus the grid divides into four quadrants:
• Q1 (top left): ANC up, DA down
• Q2 (top right): ANC up, DA up
• Q3 (bottom left): ANC down, DA down
• Q4 (bottom right): ANC down, DA up
From the ANC’s perspective, a good election is when a large number of dots fall in Q1 (ANC up, DA down). From the DA’s perspective, a good election is when many dots fall in Q4 (ANC down, DA up). And for both parties, the worst place to be is Q3 (ANC down, DA down).
Cape Town is unique among all metros in that it is possible to run this analysis for all years, as the ward changes in 2011—changes that made comparison impossible for any other metro—were minimal. So we can produce graphs for 2000–2006 (100 identical wards), 2006–2011 (105), 2011–2016 (111) and 2016–2021 (116). If we do that, we get the following four graphs:


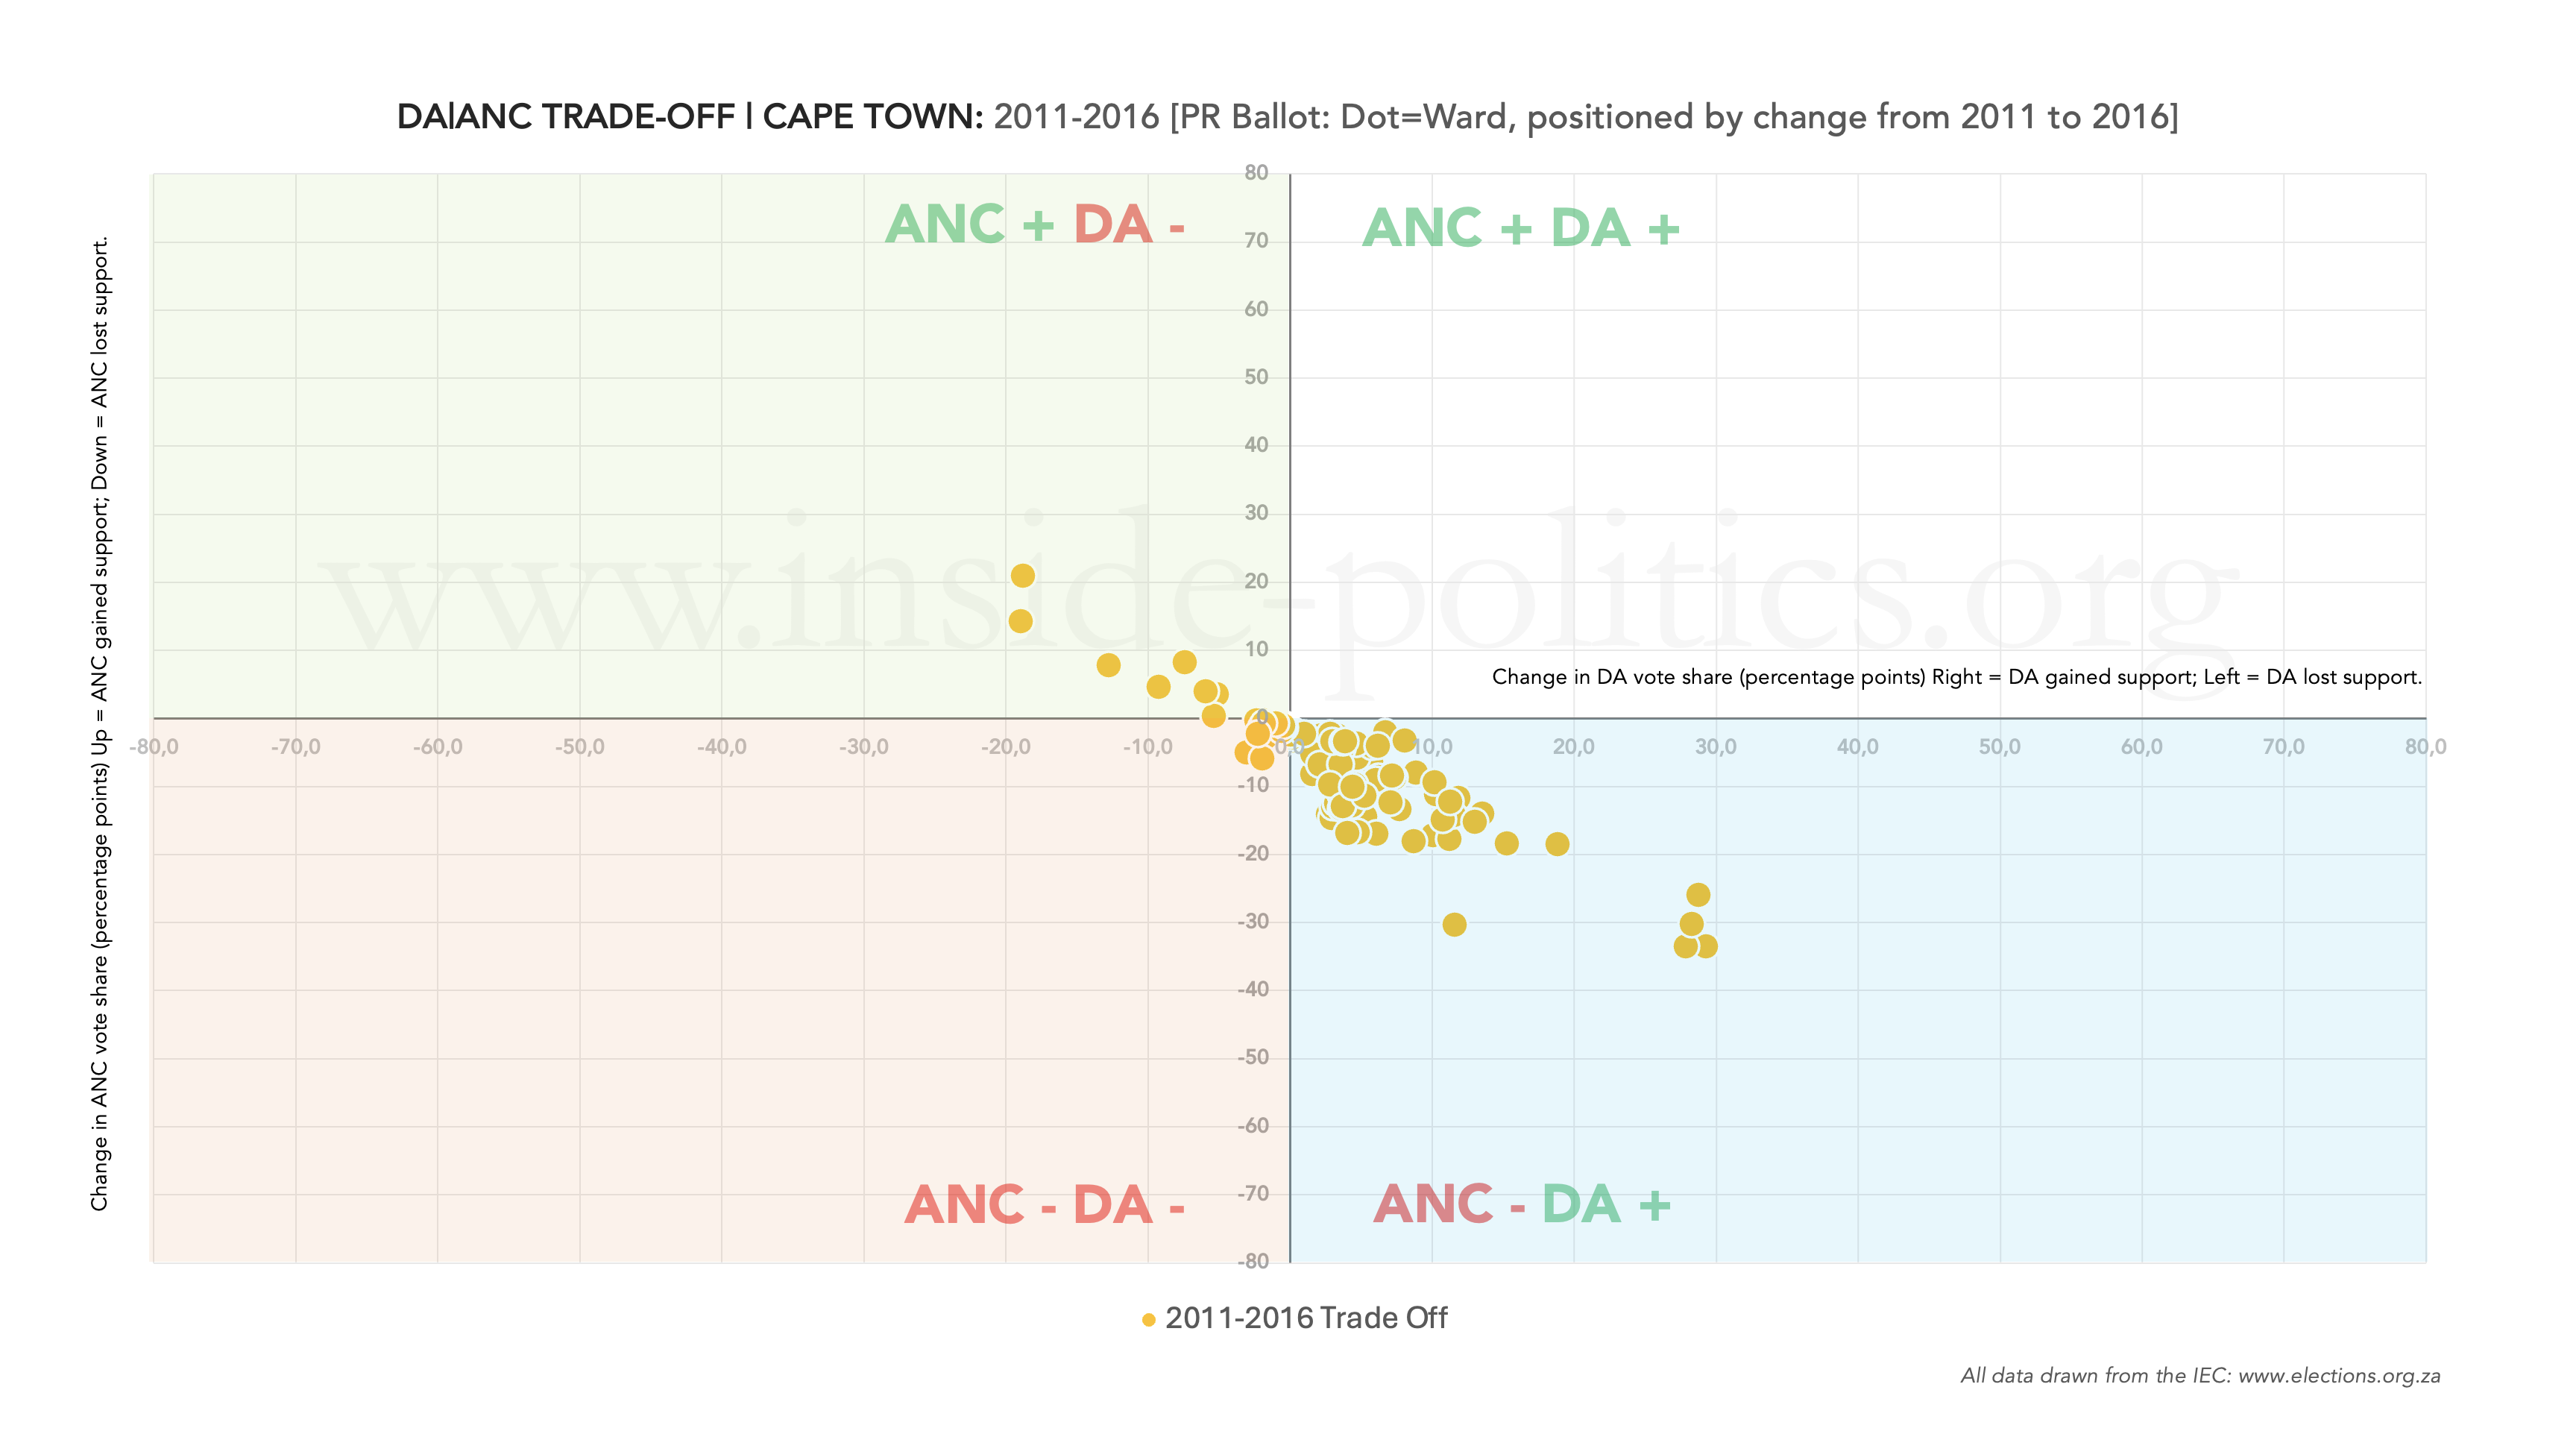
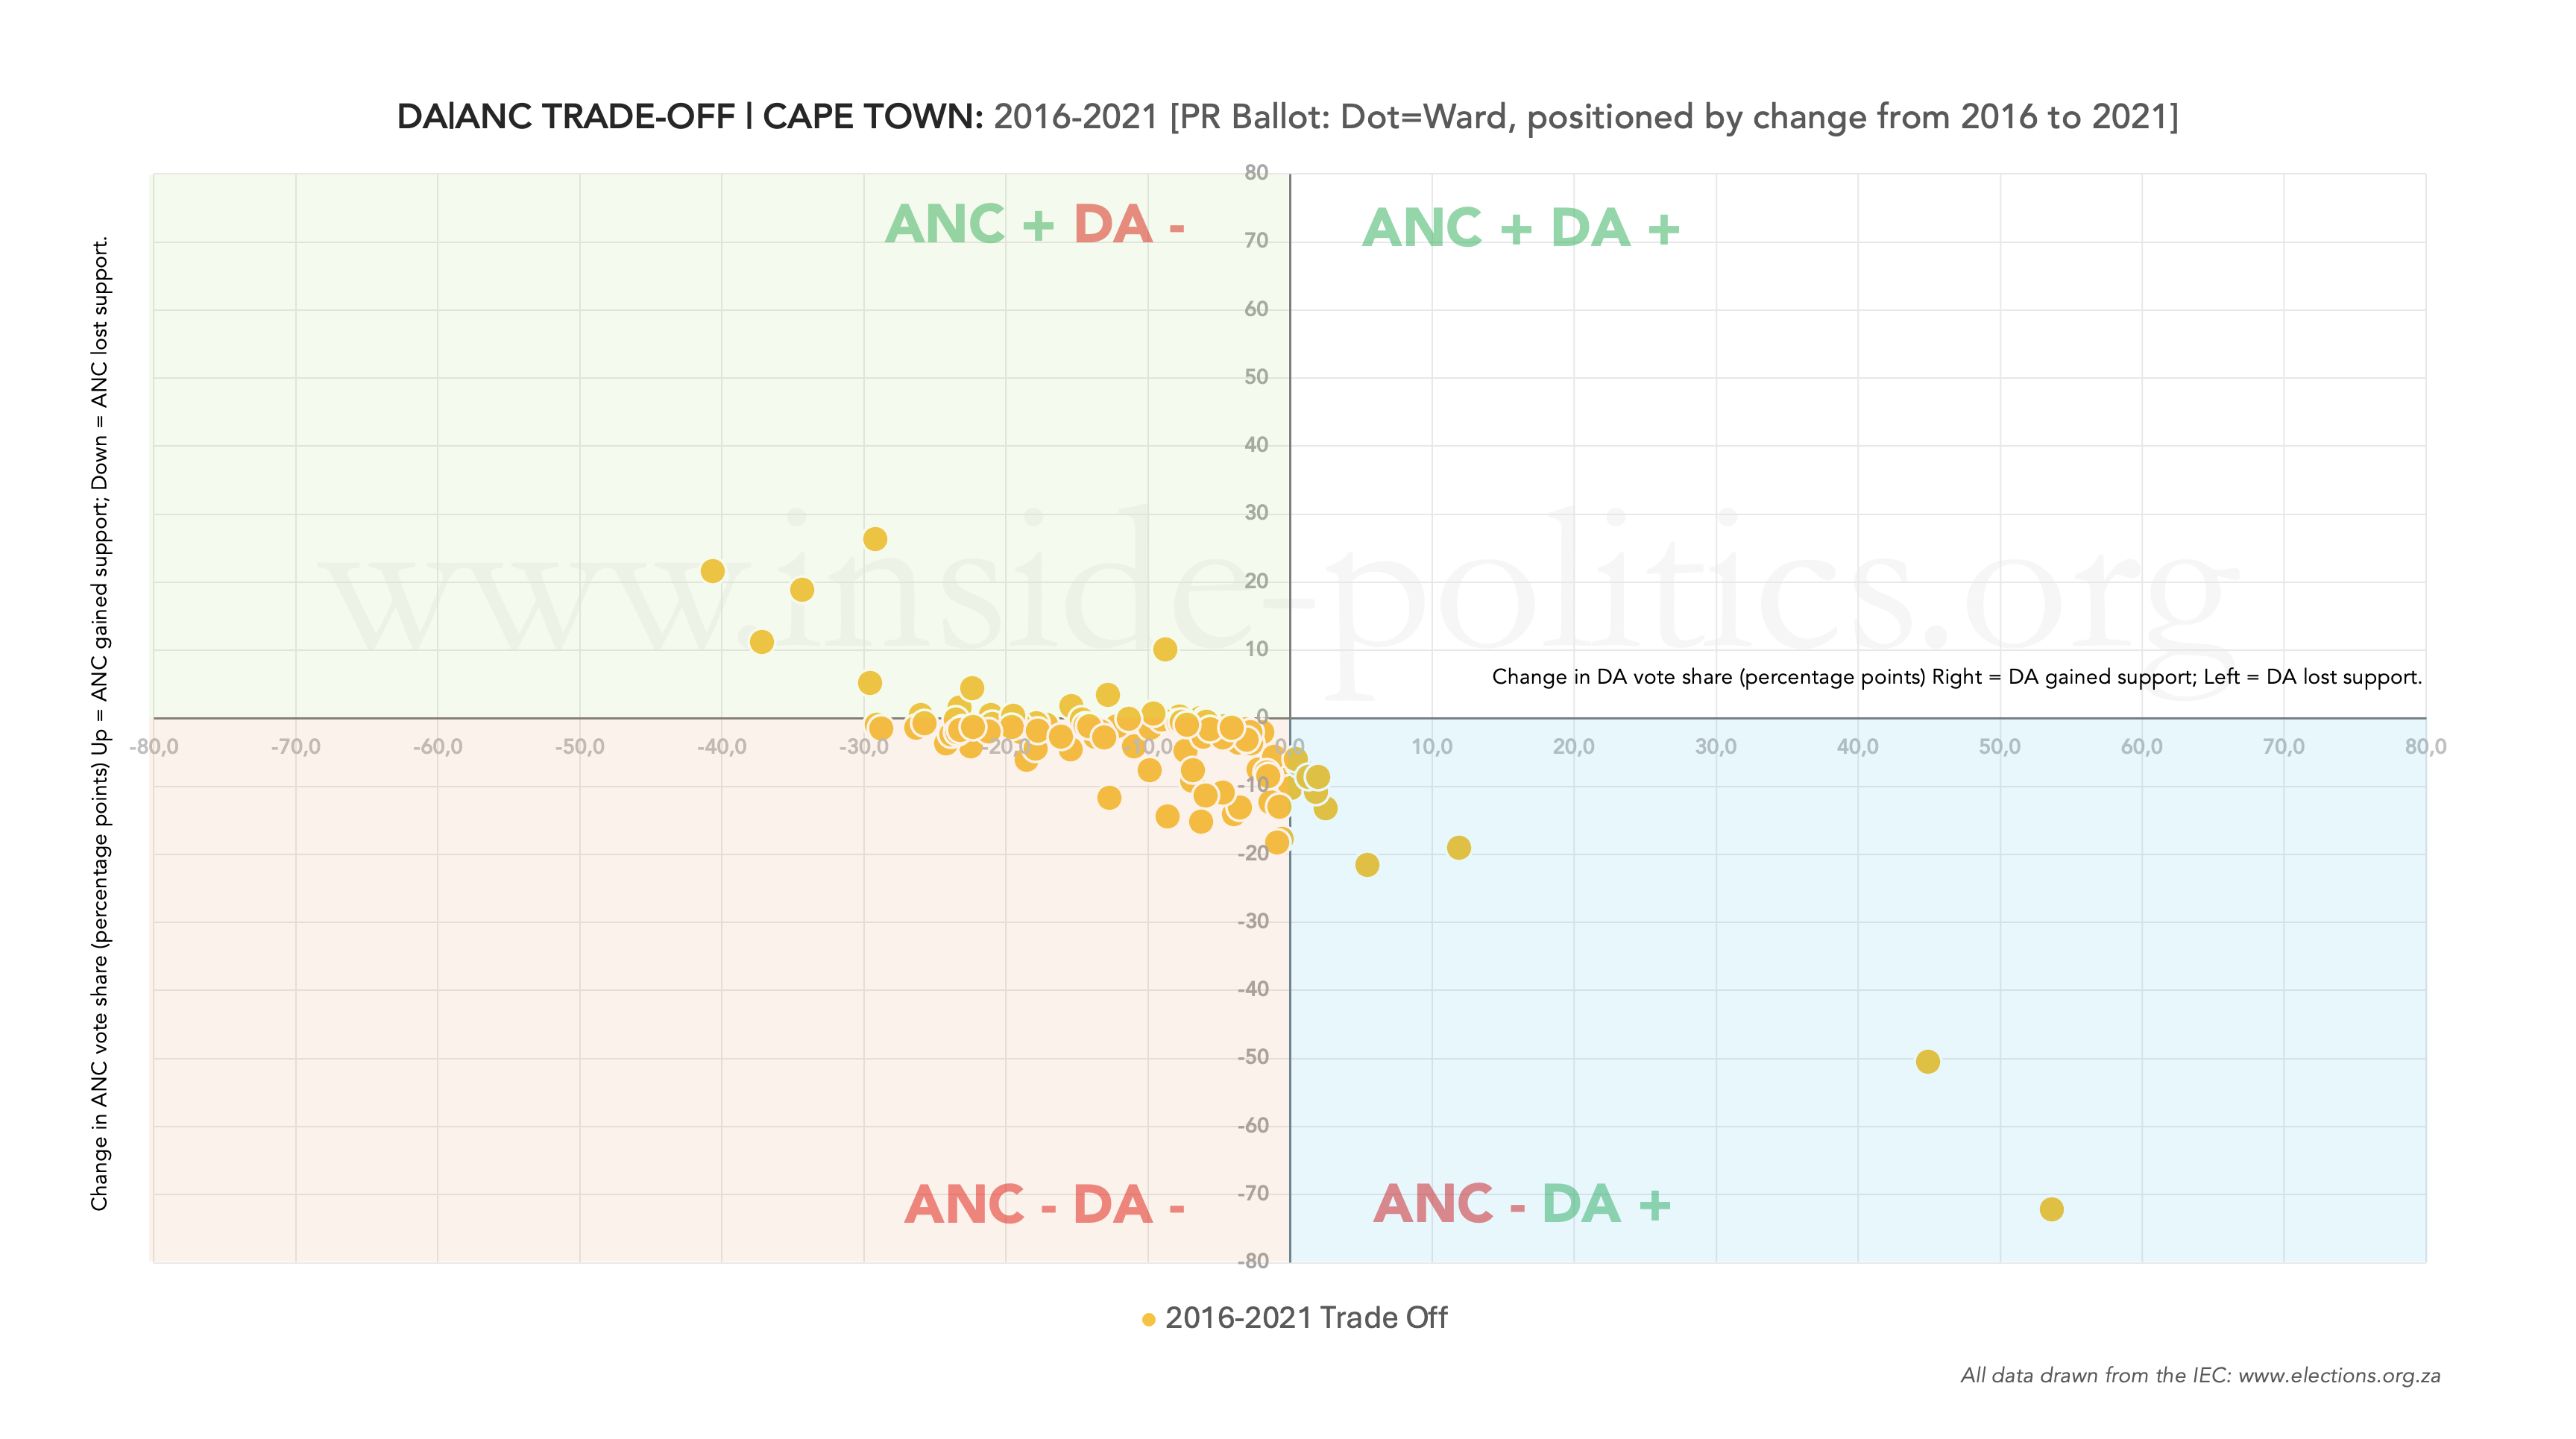
Together these tell the story of Cape Town: the early fragmentation of the vote between 2000 and 2006 as the ANC and DA fought for dominance, both winning and losing wards off each other; the DA’s rise and dominance—very evident between 2006 and 2011; the DA’s consolidation up to 60% between 2011 and 2016; and then a cooling off between 2016 and 2021, with small declines for both parties as turnout falls.
Conclusion
This analysis has not looked at the role of smaller parties in Cape Town, but they are important and, in the vacuum left by the ANC, they have been hard at work eating away at the DA’s majority. And so the DA faces something of a conundrum in Cape Town (and the Western Cape more broadly): it is in many ways a victim of its own success.
It has decimated the ANC to the point where there is not much more to be won from that party. As elsewhere, the ANC has been diluted down to its most die-hard supporters. So, despite all indicators suggesting the DA has delivered exceptionally well, it is now the primary target for all-comers. And there are many of them.
It is true that the ANC has some problems of its own—the EFF and MK, maybe the PA, will likely eat away at it a bit, and certainly arrest any potential growth. But it’s all relative: there is just not that much to consume there. The DA’s vote share, by contrast, looks very juicy.
There are upsides and downsides to this. The upside is that there is no consolidated shark in the Cape Town opposition waters that can take a huge chunk out of the DA; rather, there are 100 small fish, each taking a bite (again, this earlier essay is helpful context in this regard). The downside is that it is hard to fight on so many fronts. This is probably the big-picture summary then: barring a huge swing in turnout (difficult but not impossible), the difference between a comfortable DA majority and a shaky one is how many bites are taken out of the party.
One thing is certain: as menacing as that school of fish might be for the DA, it does not include the ANC. The ANC is out there somewhere, alone, wounded, feeding on scraps; once a great hunter, now the hunted, a stream of blood following it in the water.
This essay is the 8th in an on-going series on Election 2026/7, for all other editions of this series, please click here: Election 2026/7
Discover more from inside politics
Subscribe to get the latest posts sent to your email.

Good morning, Inside-politics desk,
Can you please change my email to the one from which I sent the request i.e. dkjane# outlook.com. Thank yu.
Regards,
Dennis Jane
+27 83 701-8856