
Election 2026/7 [10] Fragmentation: The most powerful force in Gauteng
by The Editor

We have looked, in detail, at turnout trends, which will be a determining factor in the next elections. The other primary force – perhaps even more impactful than turnout – is fragmentation: the degree to which the ANC’s and DA’s vote share has split since 2011. Back then, those two parties had a monopoly on the metro vote. Since then, both the number of “Other Parties” and their combined vote share, has exploded.
Fragmentation: The most powerful force in Gauteng
By: Gareth van Onselen
Follow @GvanOnselen
9 December 2025
This essay is the 10th in an on-going series on Election 2026/7, for all other editions of this series, please click here: Election 2026/7
Introduction
All heat maps for the three Gauteng metros – Johannesburg, Tshwane and Ekurhuleni – are up on the Resources Page. These three sets of maps allow us to take a consolidated view of Gauteng’s urban voting patterns, the purpose of this essay.
We have looked, in detail, at turnout trends, which will be a determining factor in the next elections. The other primary force – perhaps even more impactful than turnout – is fragmentation: the degree to which the ANC’s and DA’s vote share has split since 2011. Back then, those two parties had a monopoly on the metro vote. Since then, both the number of “Other Parties” and their combined vote share, has exploded.
As of 2021, a small number of these Other Parties actually won wards – but that is the tip of a very big iceberg, lurking below the surface. Look a little deeper, at those parties that finished second in wards across the three metros, and the true extent of that underlying mass is revealed. It is substantial and, if it keeps growing, 2026/7 will see its constituent parts breach first place in many, many more wards.
The rise of Other Parties
Let us start with some more general statistics. First, the growth of Other Parties. The graph below tracks the total number of Other Parties to have contested each election since 2011, across the three metros. For context, this includes national elections (2014, 2019 and 2014) but really it is the local government elections we are interested in (2011, 2016 and 2021).
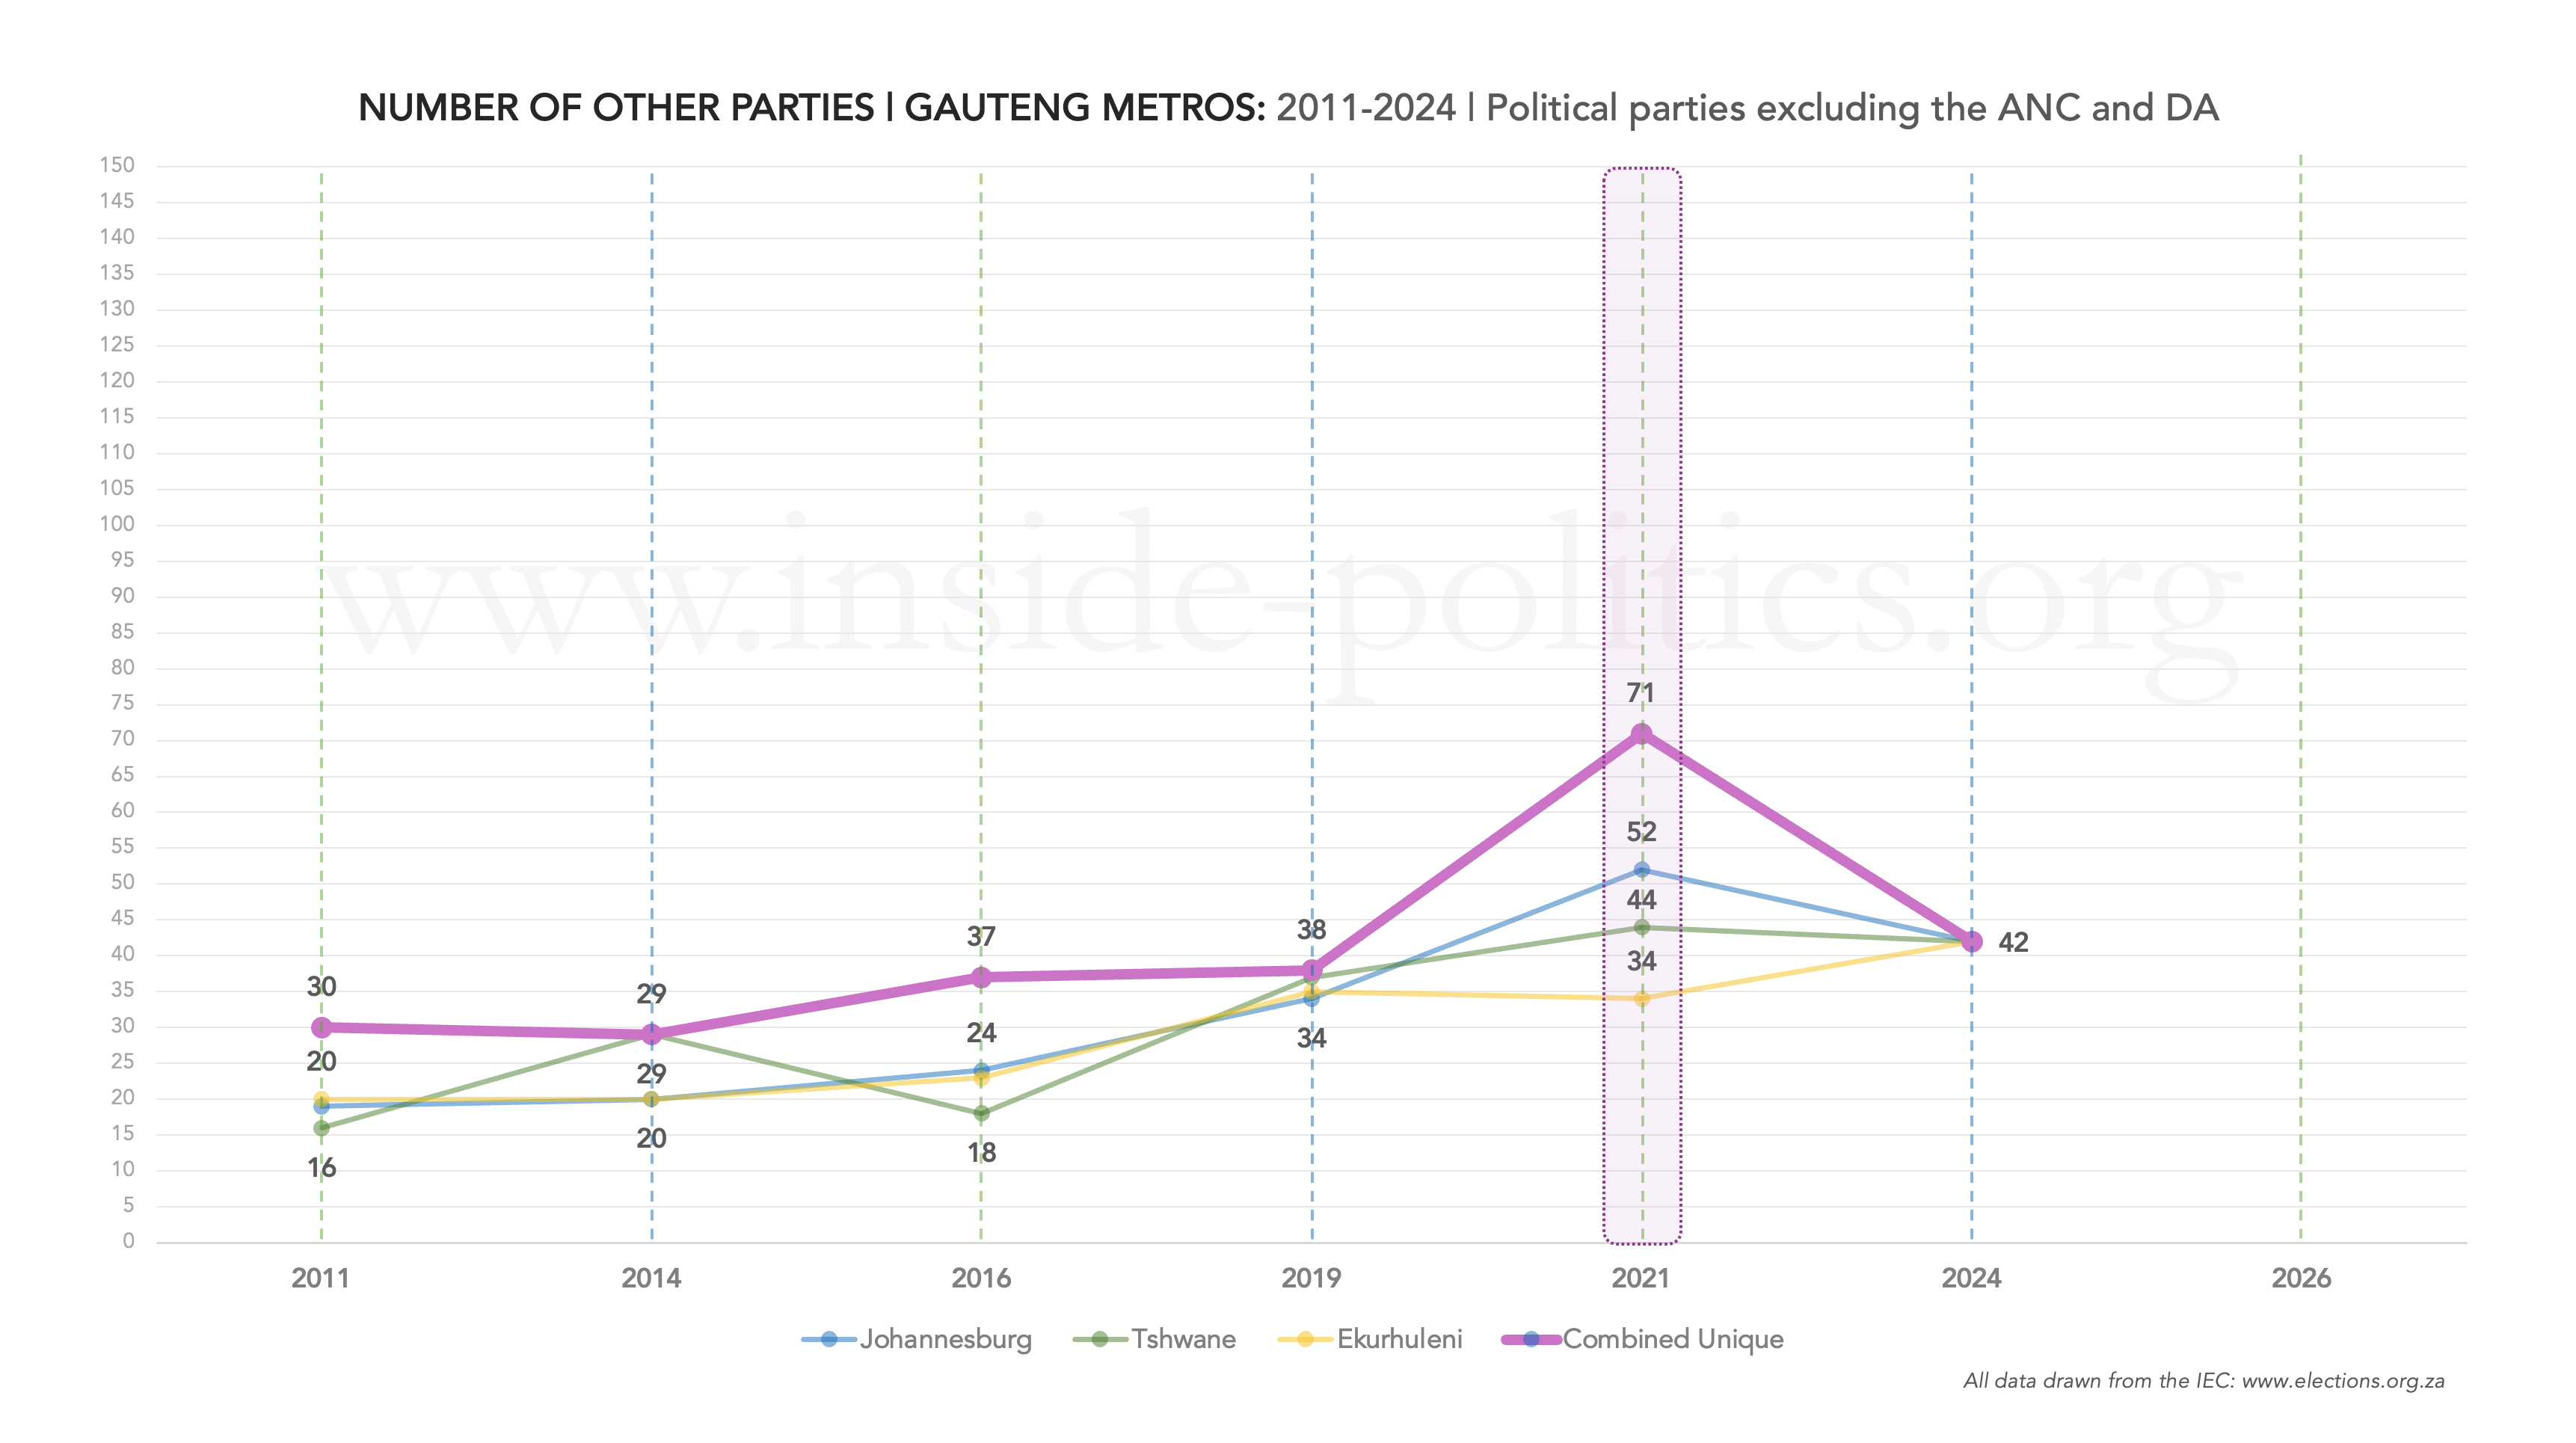
Between 2019 and 2021, the number of Other Parties almost doubled, from 38 to 71 (these are unique parties – you can see the individual totals per metro as well, however they do overlap). We don’t yet know how many parties will contest in 2026/7 but if 2021 is any indication, the number will grow. For one, new parties like uMkhonto weSizwe (MK) and Rise Mzansi (RM) have yet to been tested as local government level, and that’s before the myriad other, even smaller parties that have spawned since 2024.
The reasons for this are many and various. Both the ANC (EFF, MK) and the DA (ASA, RM, BOSA) have seen factions break away from them, to varying degrees of success. Political failure is at the heart of that. But local government elections are also a calling card for the morally ambitious and self-serving alike: the chances of securing some small vestige of power and influence are higher, and of participating in a potential coalition increaingly common. Local elections are also less expensive than provincial or national elections.
In a nutshell, it is a feeding frenzy out there. ANC and DA votes are up for grabs, power – even disproportional power – is regularly on offer if you are willing to do a deal, and the opportunity to capitalise on local demographics via some populist or ethnic platform, is greater. The result: a plethora of parties and individuals all vying for an ever-shrinking but also ever-splintering pool of votes.

The fact that Other Parties tend to be analysed individually, rather than collectively, means that their combined performance is often overlooked. But it is quite something. The graph above shows the overall support for Other Parties across all three metros (and in each individual metro). Since 2011, their performance has improved, year-on-year, from 6.3% to 38.7% in 2024. That 38.7% is now bigger than both the ANC’s and DA’s vote share (below):

Other Parties first surpassed the ANC in 2021, and increased their lead, over both the ANC (from 1.4pts in 2021 to 4.7pts in 2024) and the DA (8.4pts to 11.4pts) in the most recent national election. Given the lackluster performance of the ANC and DA in 2024 (both essentially plateaued), the scene would seem set for that gap to grow further still.
And, although a small group within all Other Parties is always primarily responsible for its growth, collectively it is becoming more effective. In 2011, 30 Other Parties managed just 6.2% between them. That’s 0.21% per party on average. In 2021, between 71, that average moved up to 0.52%. So twice as many parties, but also twice as effective (and remember, MK is likely to boost that average further still).
The result of all this, is that if we compare the support of Other Parties across all three metros in 2011, to 2021, we get the following two maps: 2011 on the left, 2021 on the right.
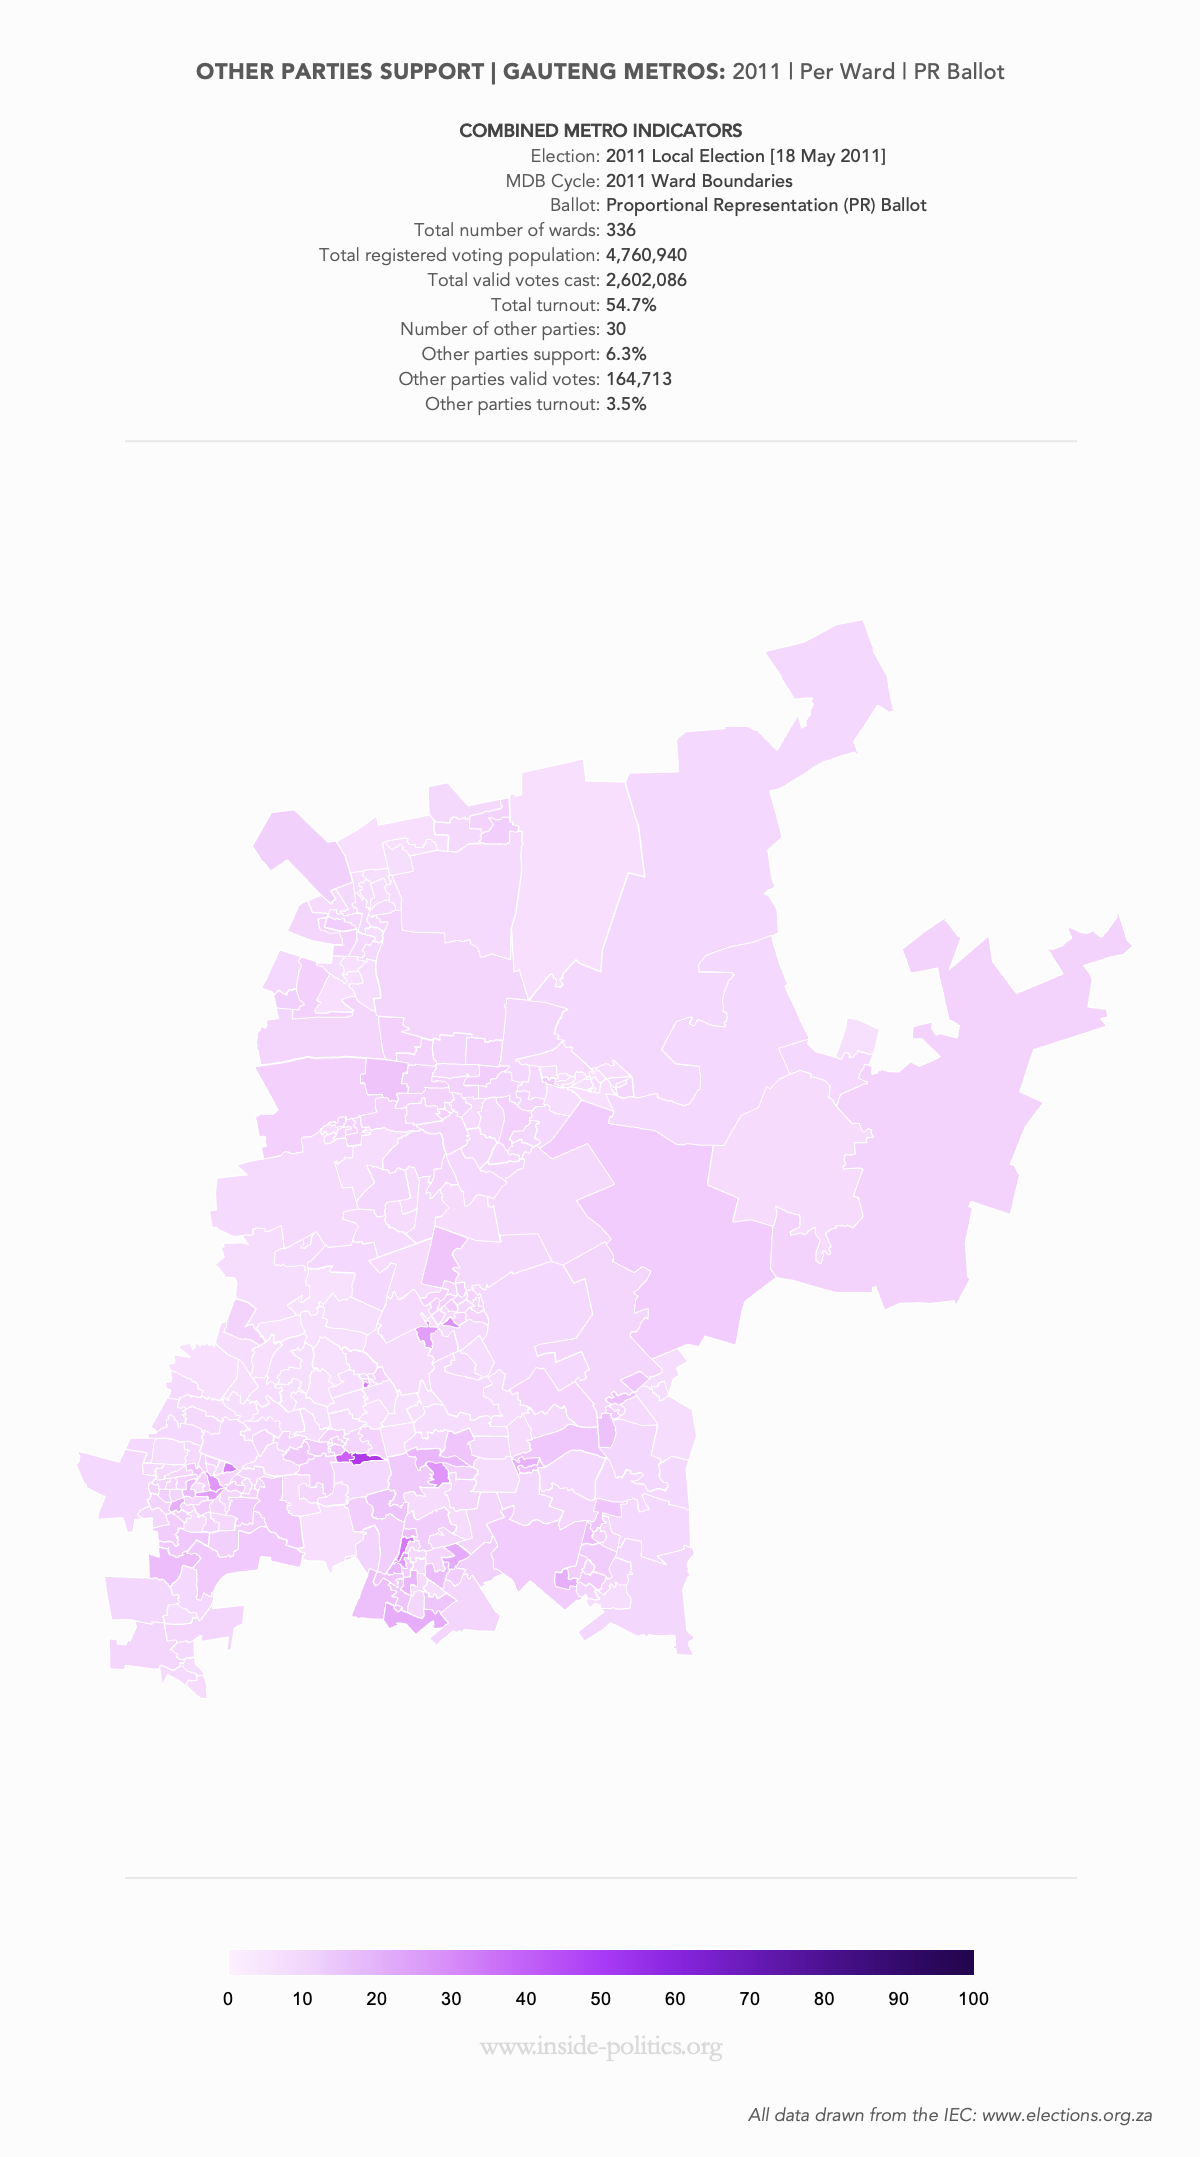
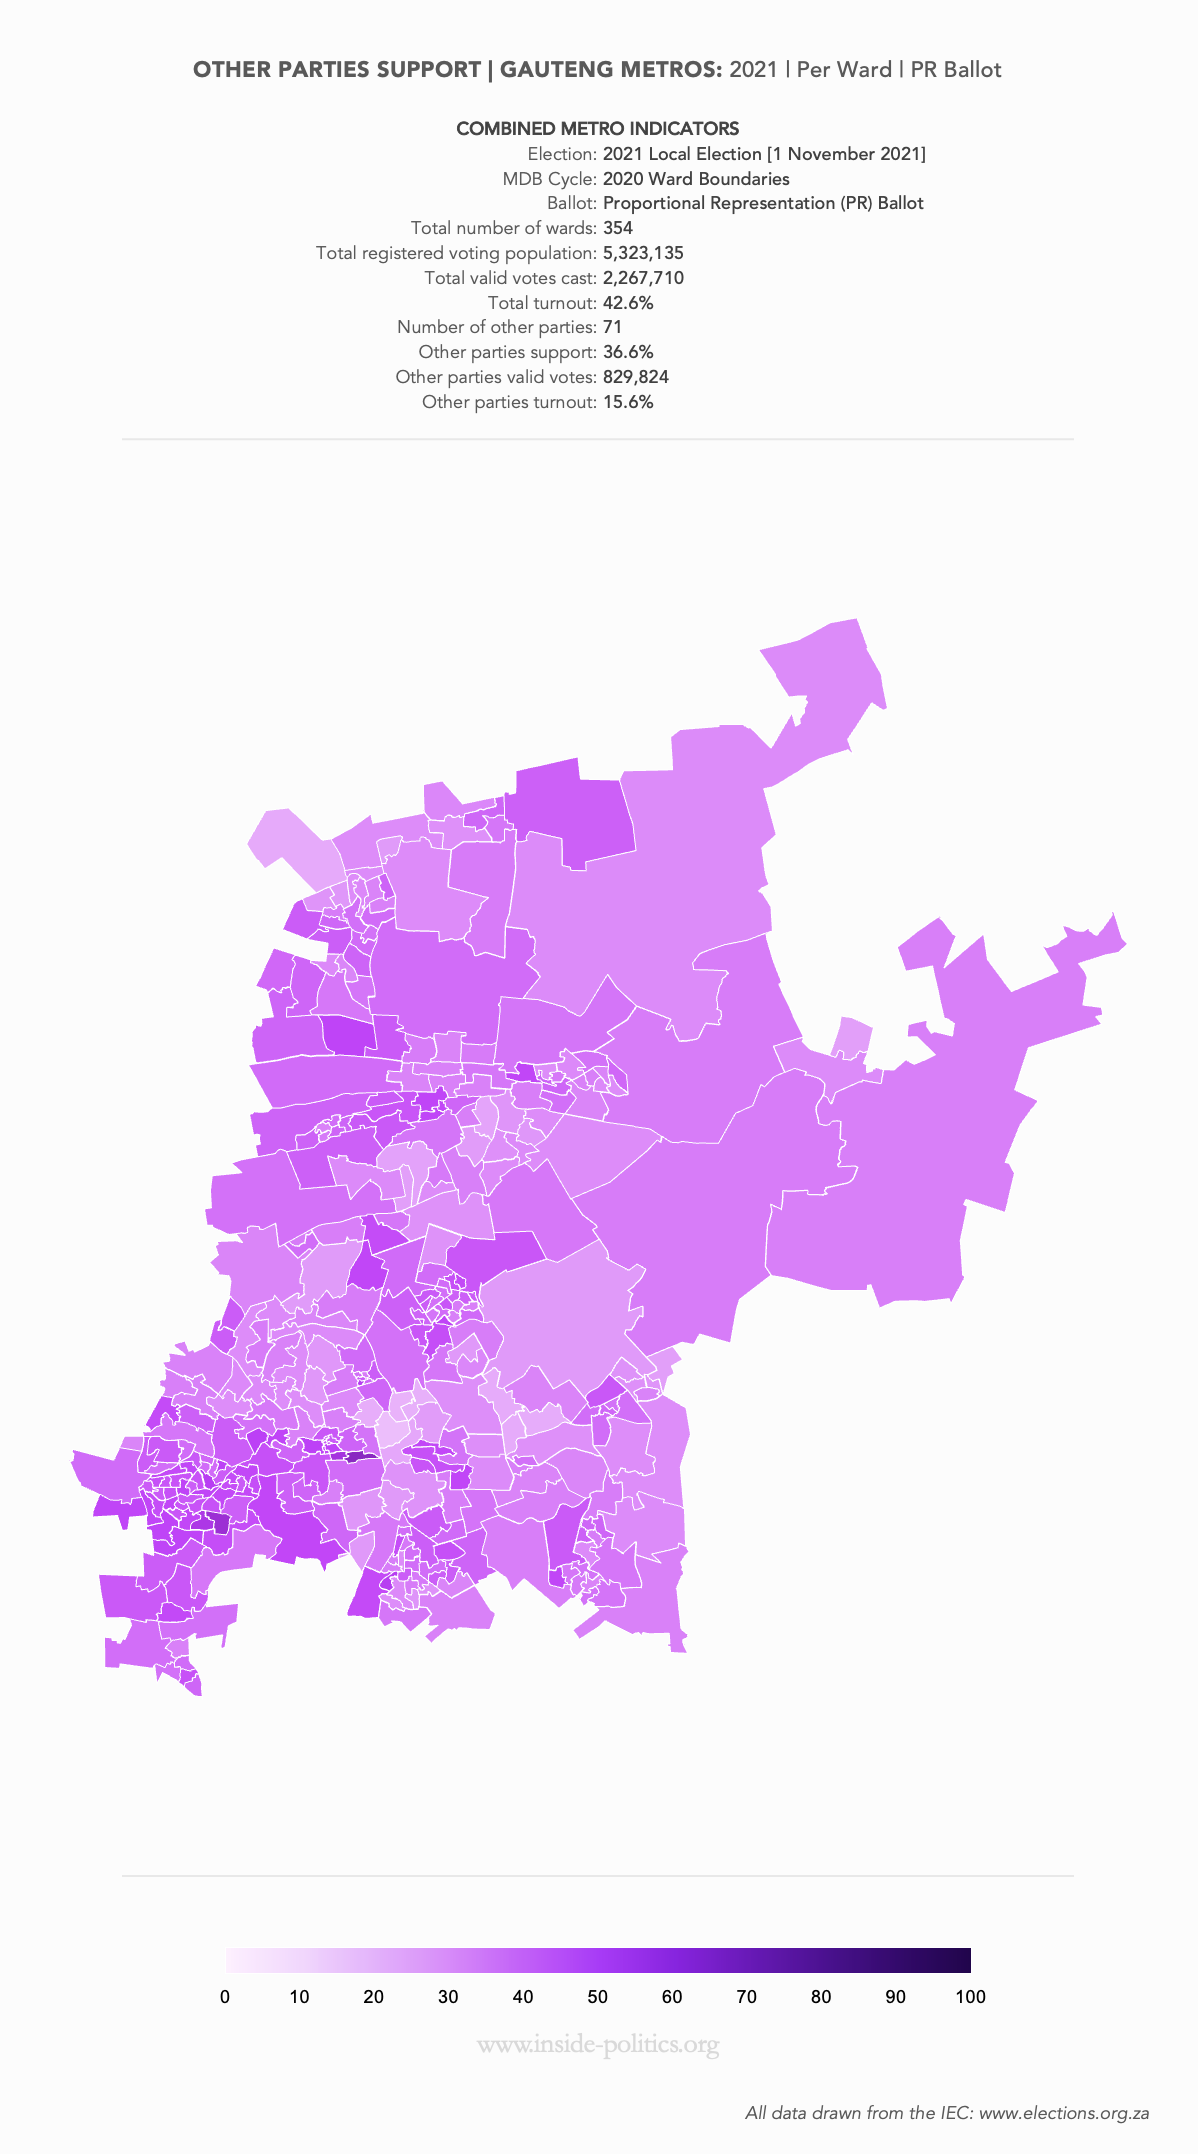
That is a profound visual difference, as the far darker intensity of the 2021 map signals far greater support. But, to really appreciate the collective impact of Other Parties, and the damage done to the ANC and DA, not to mention the future threat they pose to those two parties, we need to set out the broader context, and properly map the ANC’s and DA’s glory days.
The ANC’s and DA’s monopoly
In 2011, the ANC and the DA were by some considerable distance the preemineant two forces in Gauteng’s urban centres. Together, they won a staggering 93.7% of all support, across all three metros. They won 335/336 wards in 2011. And, in 2016, every single solitary ward, in the three Gauteng metros, was won by either the ANC or the DA. Their grip was almost absolute.
In 2021, that changed, however. Admittedly, not by much on the ward front – Other Parties won only 9/354 wards – but the intensity of ANC and DA support dropped dramatically.
The following three sets of maps illustrate that change. The first pair show those wards where the ANC finished first, in 2011 (left) and in 2021 (right) ten years later. The second, the respective outcomes for the DA in 2011 and 2021. And the third and final pair – the combined result, with Other Party wins in yellow.


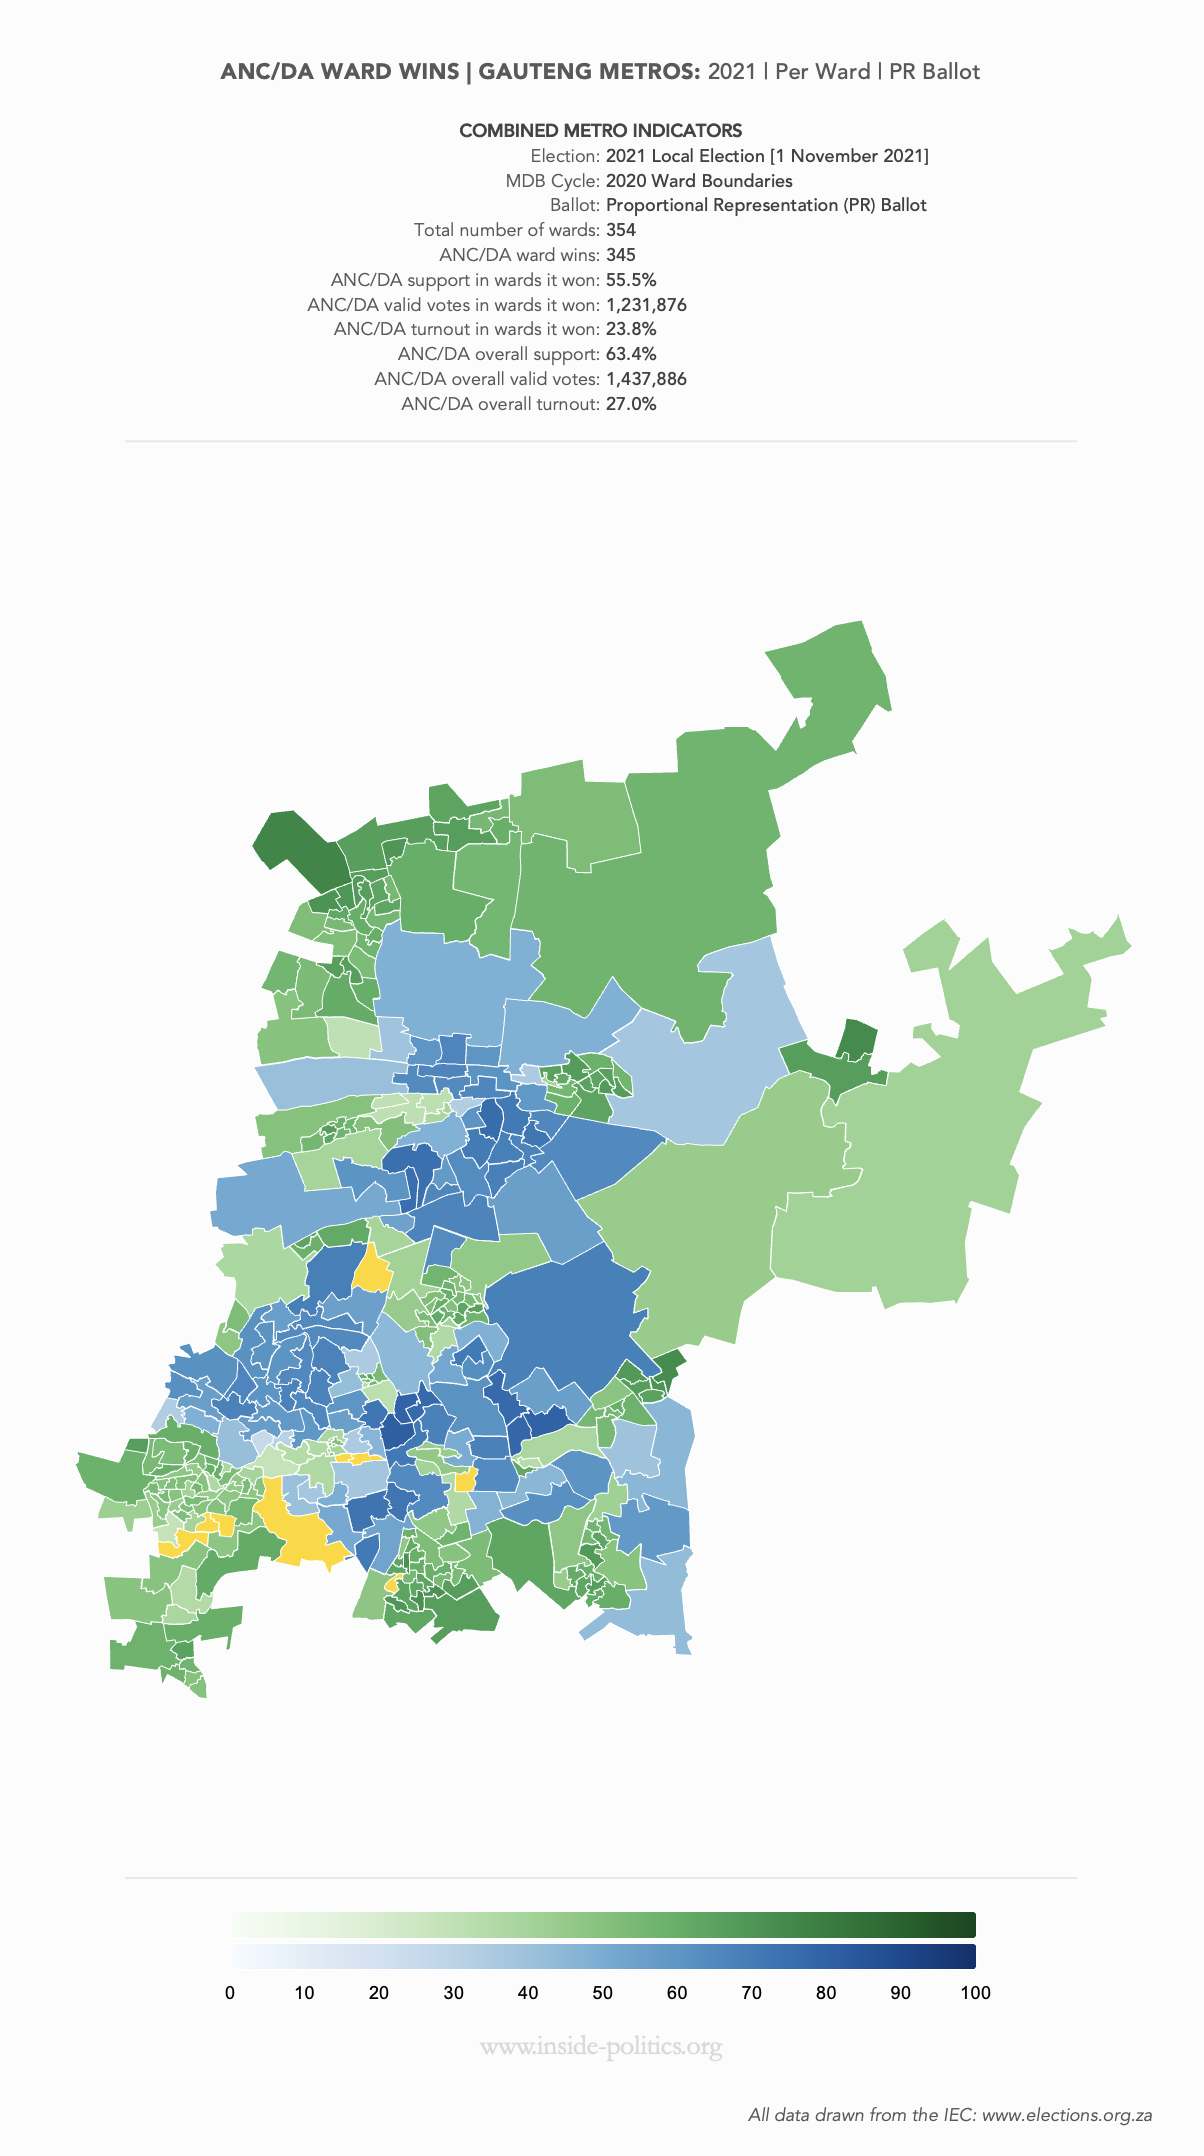
It’s been a tough decade for the ANC and DA. In 2011, in the 223 wards the ANC won, it averaged 82.6%. In 2021, in the 236 wards it won, it averaged only 54.1%, a decline of 28.5pts. The same pattern holds for the DA. In 2011 it averaged 73.8% in the 112 wards it won. In 2021, it won 109 wards, but averaged just 58.5%, a decline of 15.3pts. Not as bad as the ANC but a significant downward trend.
Local politics is first past the post, so both parties could drop further and still win wards but 50% is also generally regarded as a informal benchmark for legitimacy, and both parties are moving closer and closer towards crossing it.
But all of this, whether 2011 or 2021, does little more than demonstrate the extent of the monopoly the ANC and DA have on Gauteng politics. Yes, the strength of their grip might be weakening, but as of the last local elections, they held the overwhelming majority of Gauteng’s urban wards in their hands. At least at first glance.
Slip sliding away
To fully reveal how weak that grip really is, we need to look a little deeper – at what has happened to second place parties over the same time period.
Here are the same sets of paired maps, except looking only at the second biggest party per ward, across the three metros. Again, with 2011 on the left and 2021 on the right. In the final pair, any Other Party is shown in yellow.

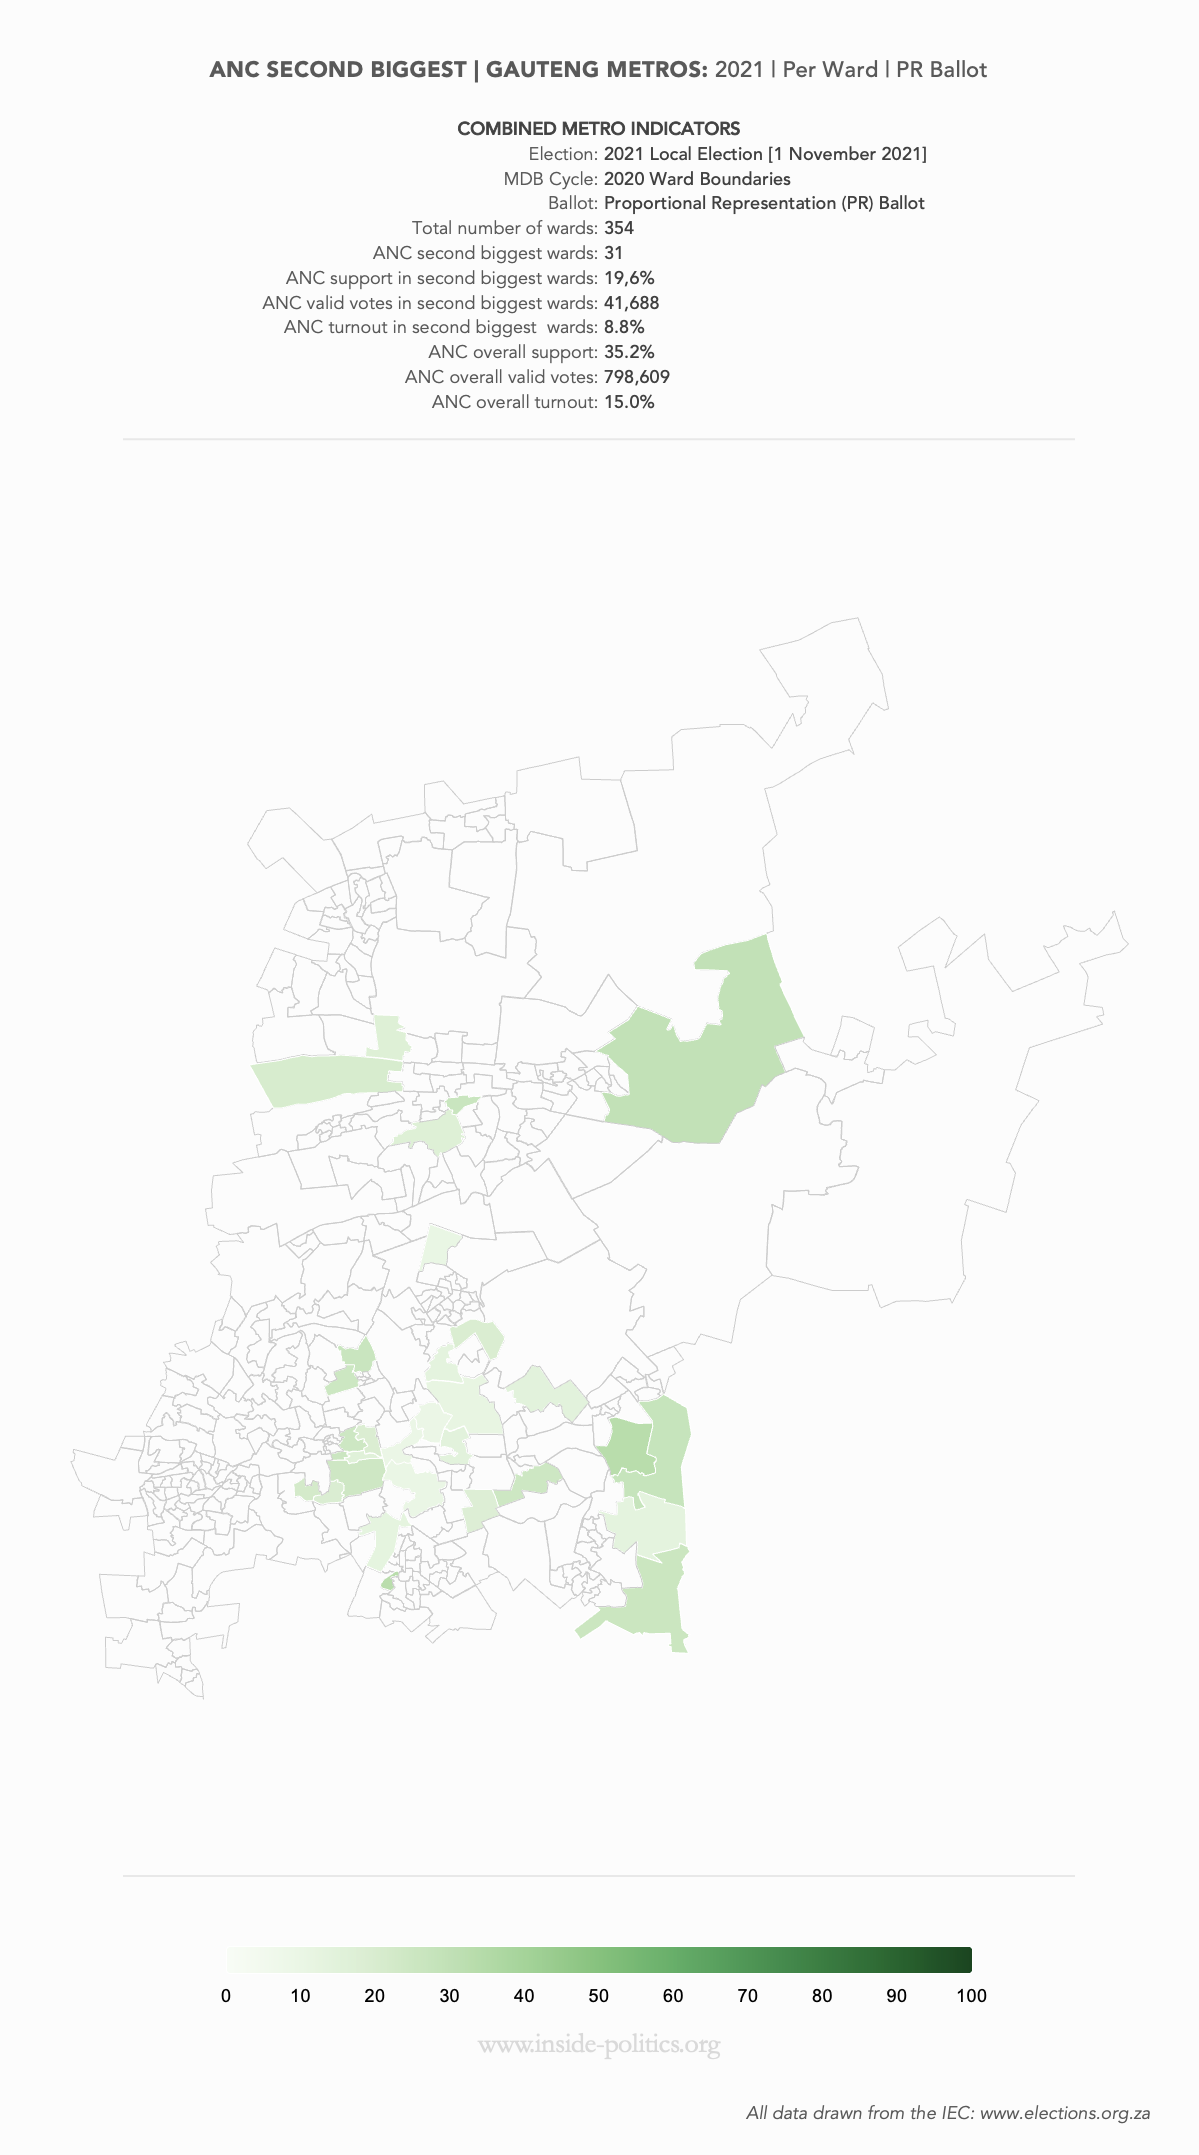


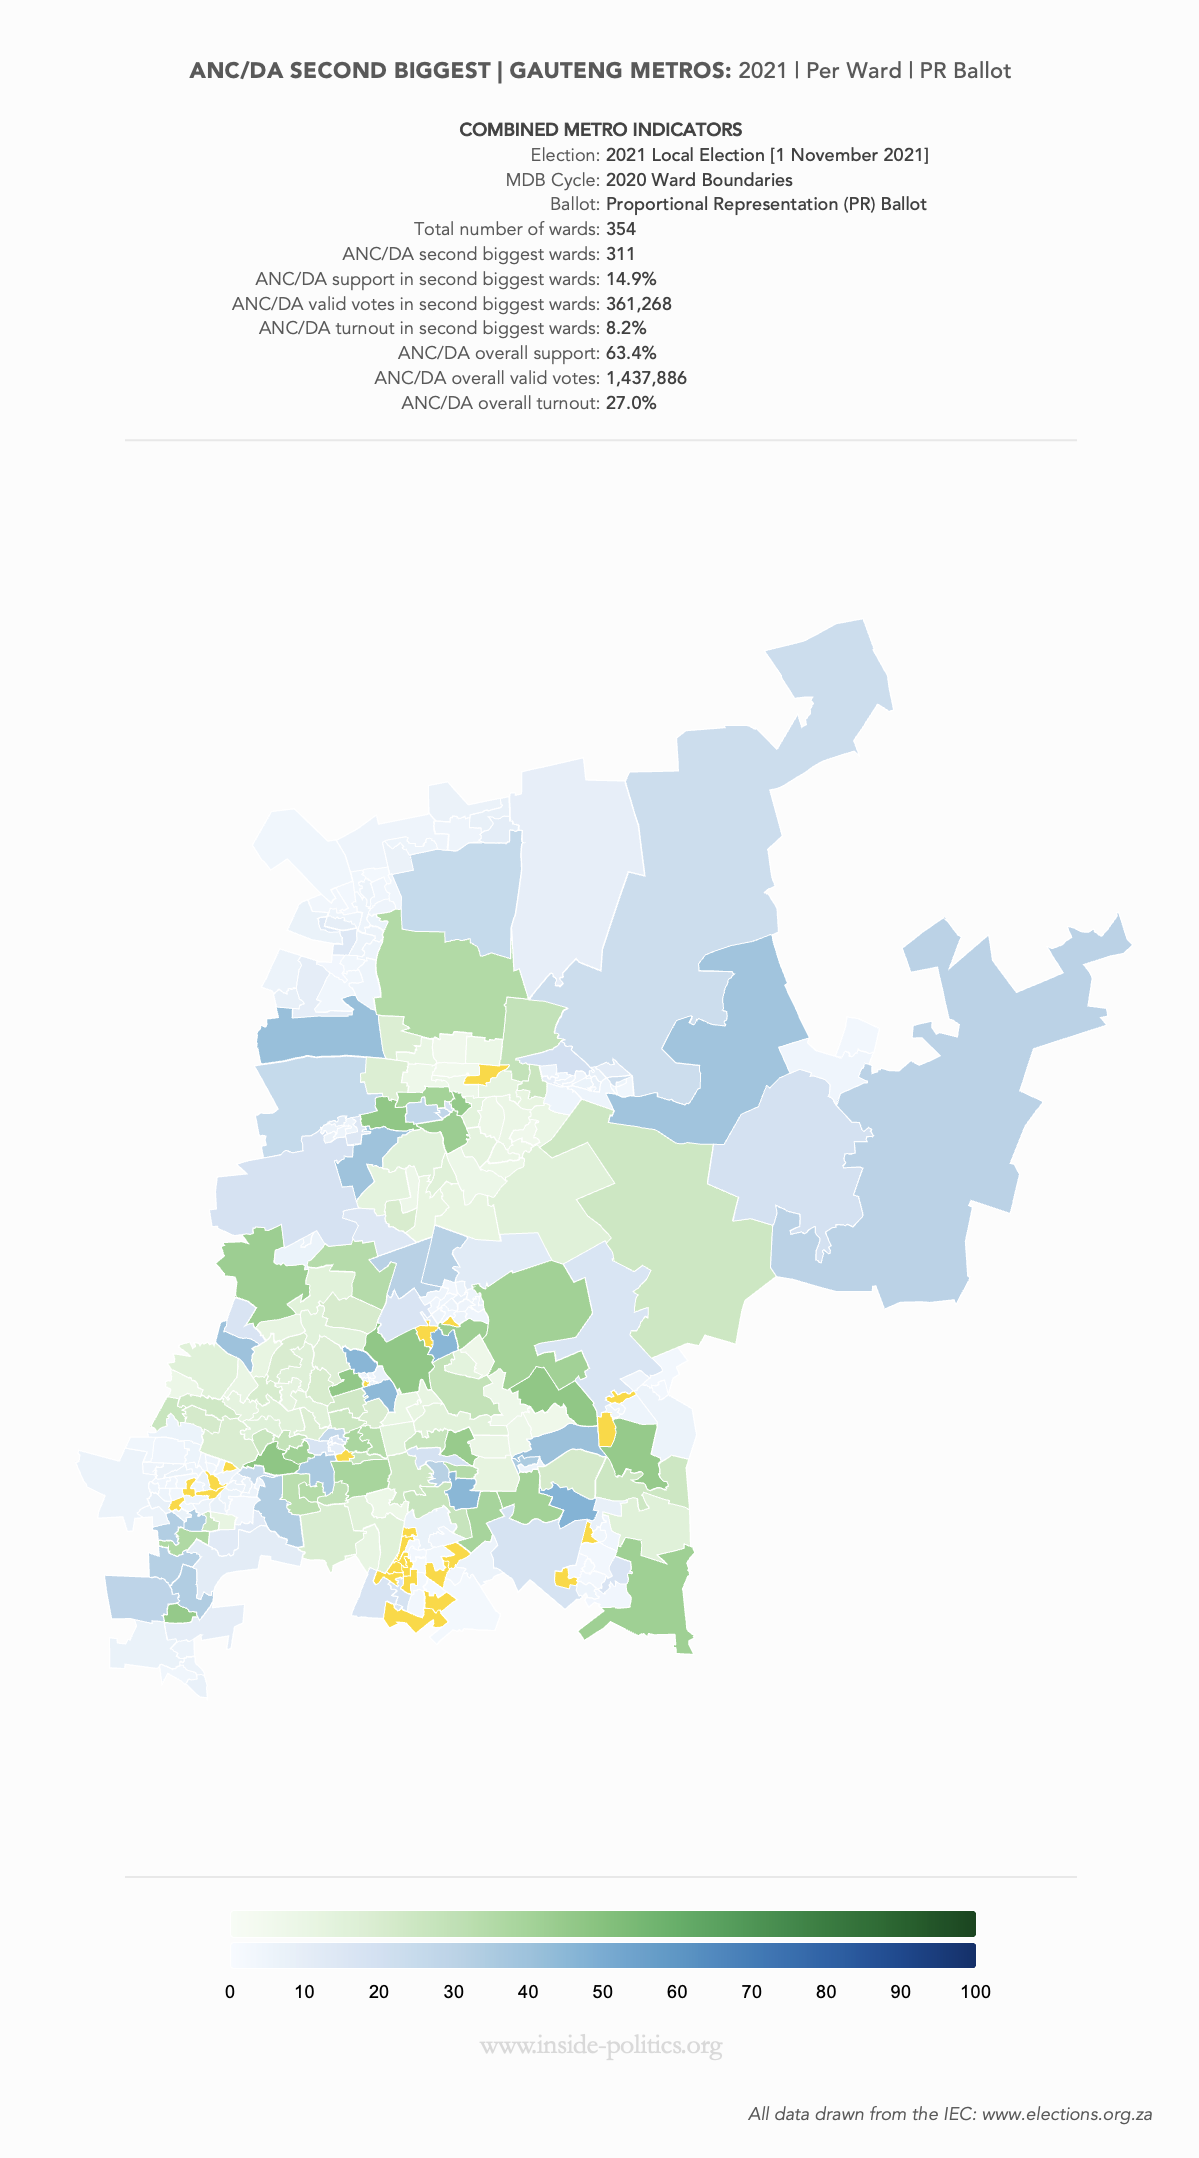

The consolidated ANC/DA map for 2011 shows the extent of their monopoly at that time. Not only did these two parties win 335/336 wards, but one or the other finished second in 311/336 wards. That is what total domination looks like. And so that final map, bright with yellow, is profound. It represents a fundamental shift in the political landscape.
In 2021, Other Parties came second in 302 out of 354 wards. The ANC and DA were reduced to a mere 52. It is true, they did not do too badly, in terms of percentage support in those 52 wards, but that is mostly because those wards where either the ANC (31) or the DA (21) holds second place, are the remnants of wards they once dominated, rather than wards in which their support is on the rise.
So what does this all tell us? Two things above all others. One, both ANC and the DA historic strongholds are no longer the safe base, from which either can extend their reach. They are fragile centres that need to be defended against all comers. Two, and by extension, both the ANC and the DA have lost the ability to serve as the obvious alternative to the other.
Every inch of that space is now being systematically cannibalised by a hundred small and competing armies, as both the ANC and DA are forced back.
Other Parties have a great many things in their favour. Among them, micro-campaigning, populist and consequence free rhetoric and an enormous pool of the alienated and angry. They have much against them too: little to actually distinguish them in any meaningful way from whichever ANC or DA universe they emanate, self-interest (and the inability to join forces), and the ANC and DA themselves, two powerful and well-funded machines that can deliver campaigns and brand awareness on a level none of these Other Parties can really compete with.
But it is a mistake only view these Other Parties individually. There is a clear and well-evidenced trend playing out, and while we might not know exactly how votes will split between each party, we know collectively they constitute the most powerful, quickest growing, and fastest multiplying force in Gauteng politics. It’s a common case of wood and trees, and whatever you make of each individual piece of timber, take a step back and there is a veritable Forrest out there now. Its roots are way out in front of it, and spreading everywhere.
This essay is the 10th in an on-going series on Election 2026/7, for all other editions of this series, please click here: Election 2026/7
Discover more from inside politics
Subscribe to get the latest posts sent to your email.

It would be interesting to do the same analysis for the ANC vs EFF + MK + … and DA vs ASA + FF+ RM +…
In other words, analyse the “ponds” [Frans Cronje’s definition] that the ANC and its splinters and the DA and its splinters “fish” in.
The splintering of the Ruling Party towards the end of Corruptheid is reminiscent of the splintering of the Ruling Party towards the end of Apartheid (NP → HNP, CP, etc)