
Election 2026/7 Resource: Turnout Track | ANC-DA | JHB | By Ward
by The Editor
Election 2026/7 Resource: ANC-DA Turnout Track | Johannesburg | By Ward
Explanation:
These are “Turnout Tracks”. For a detailed explanation of how they are constructed, what they show (including things like the “Advantage Window”) and why they are insightful, please see this explainer here.
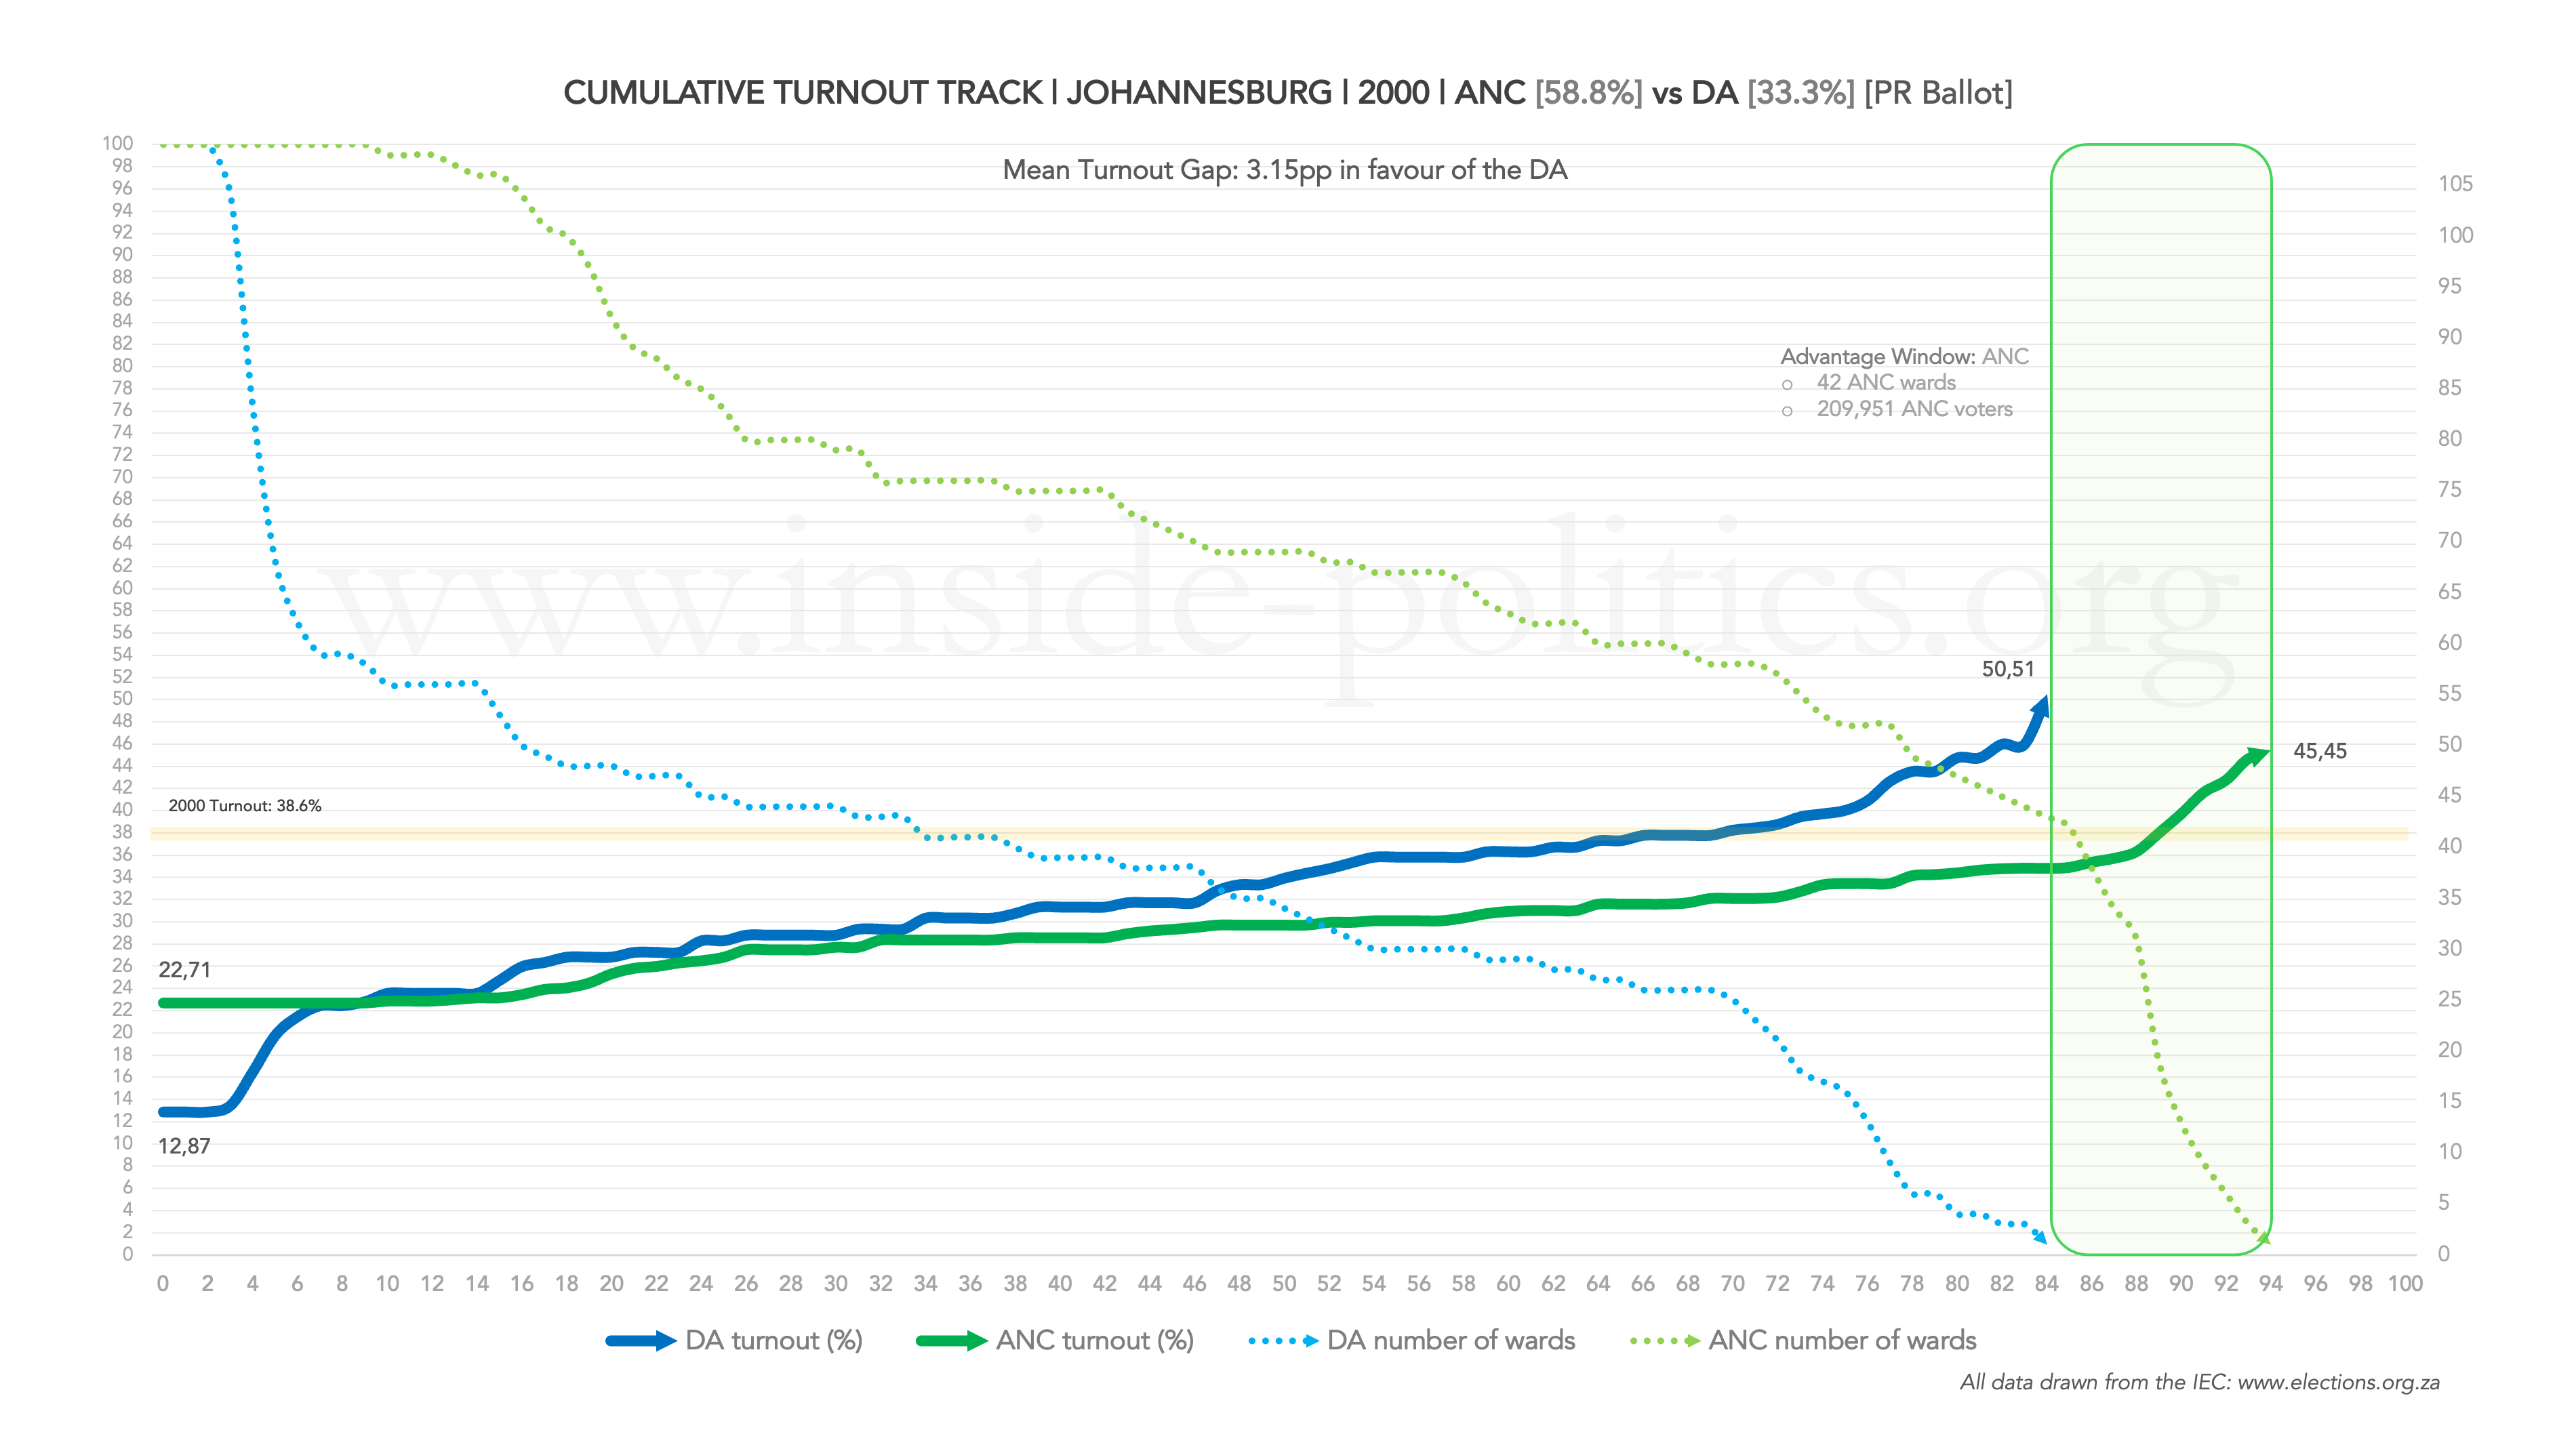
That said, in general terms, the graphs allow you to see:
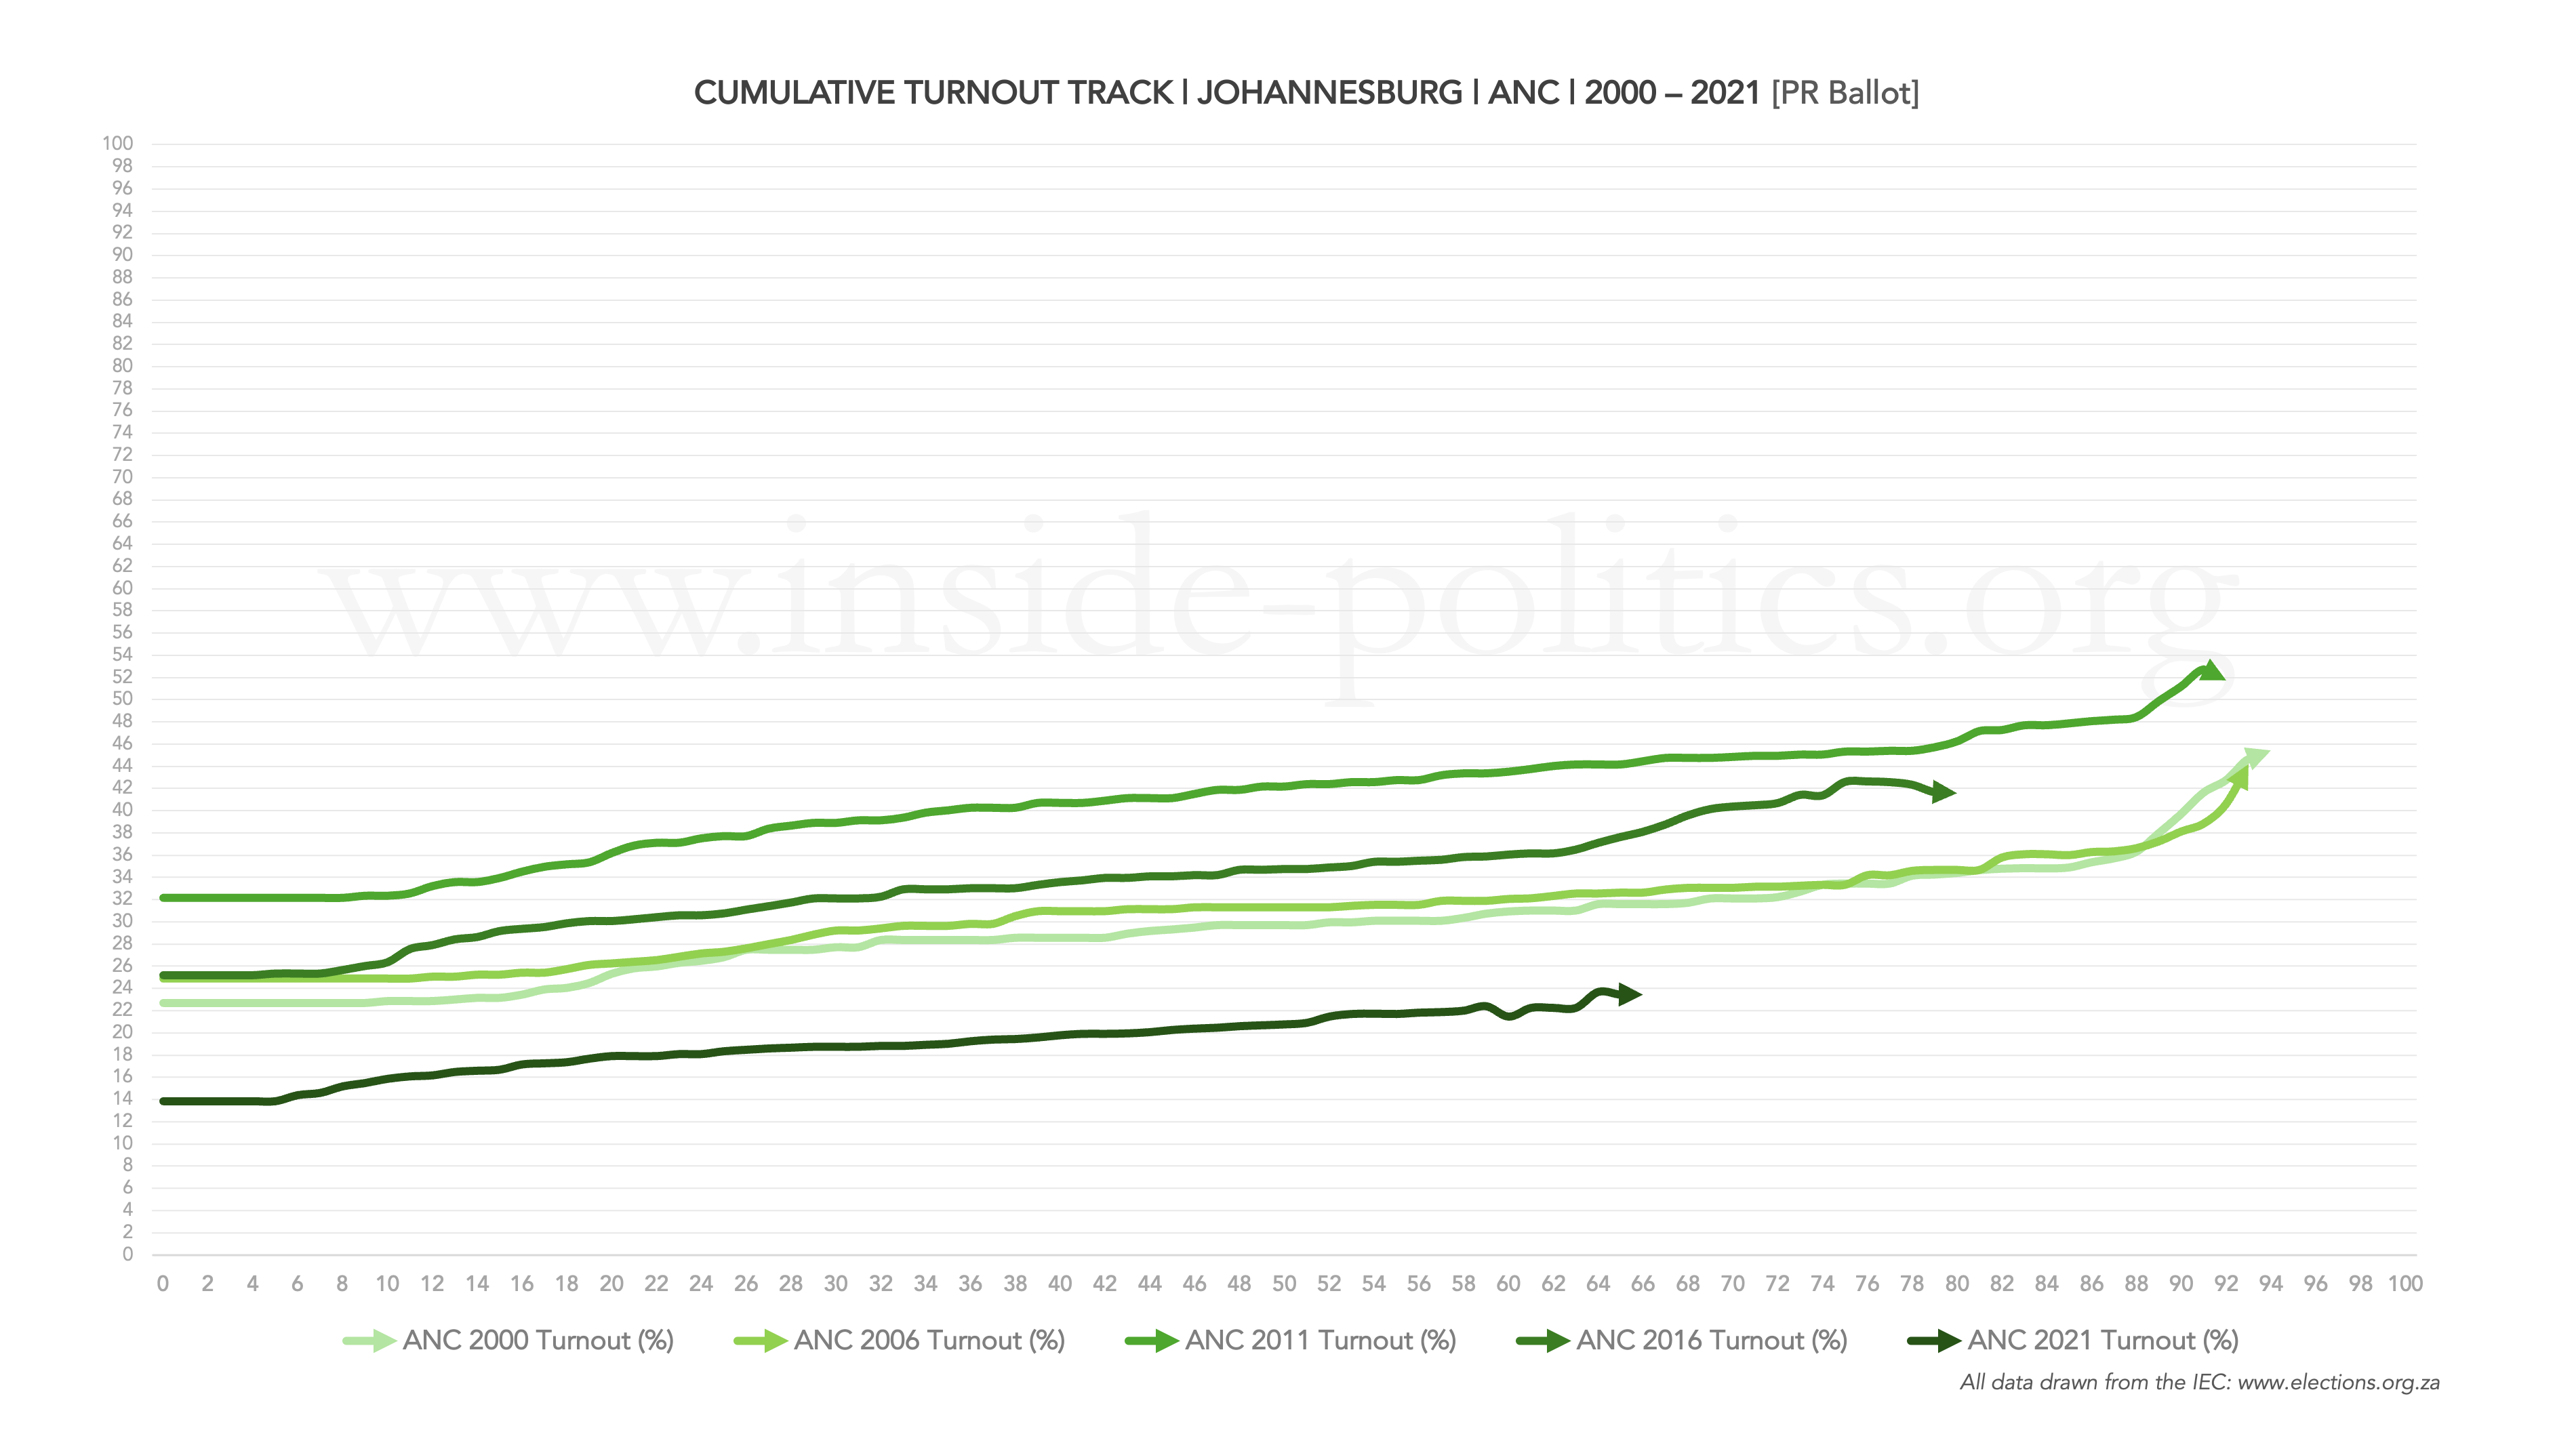
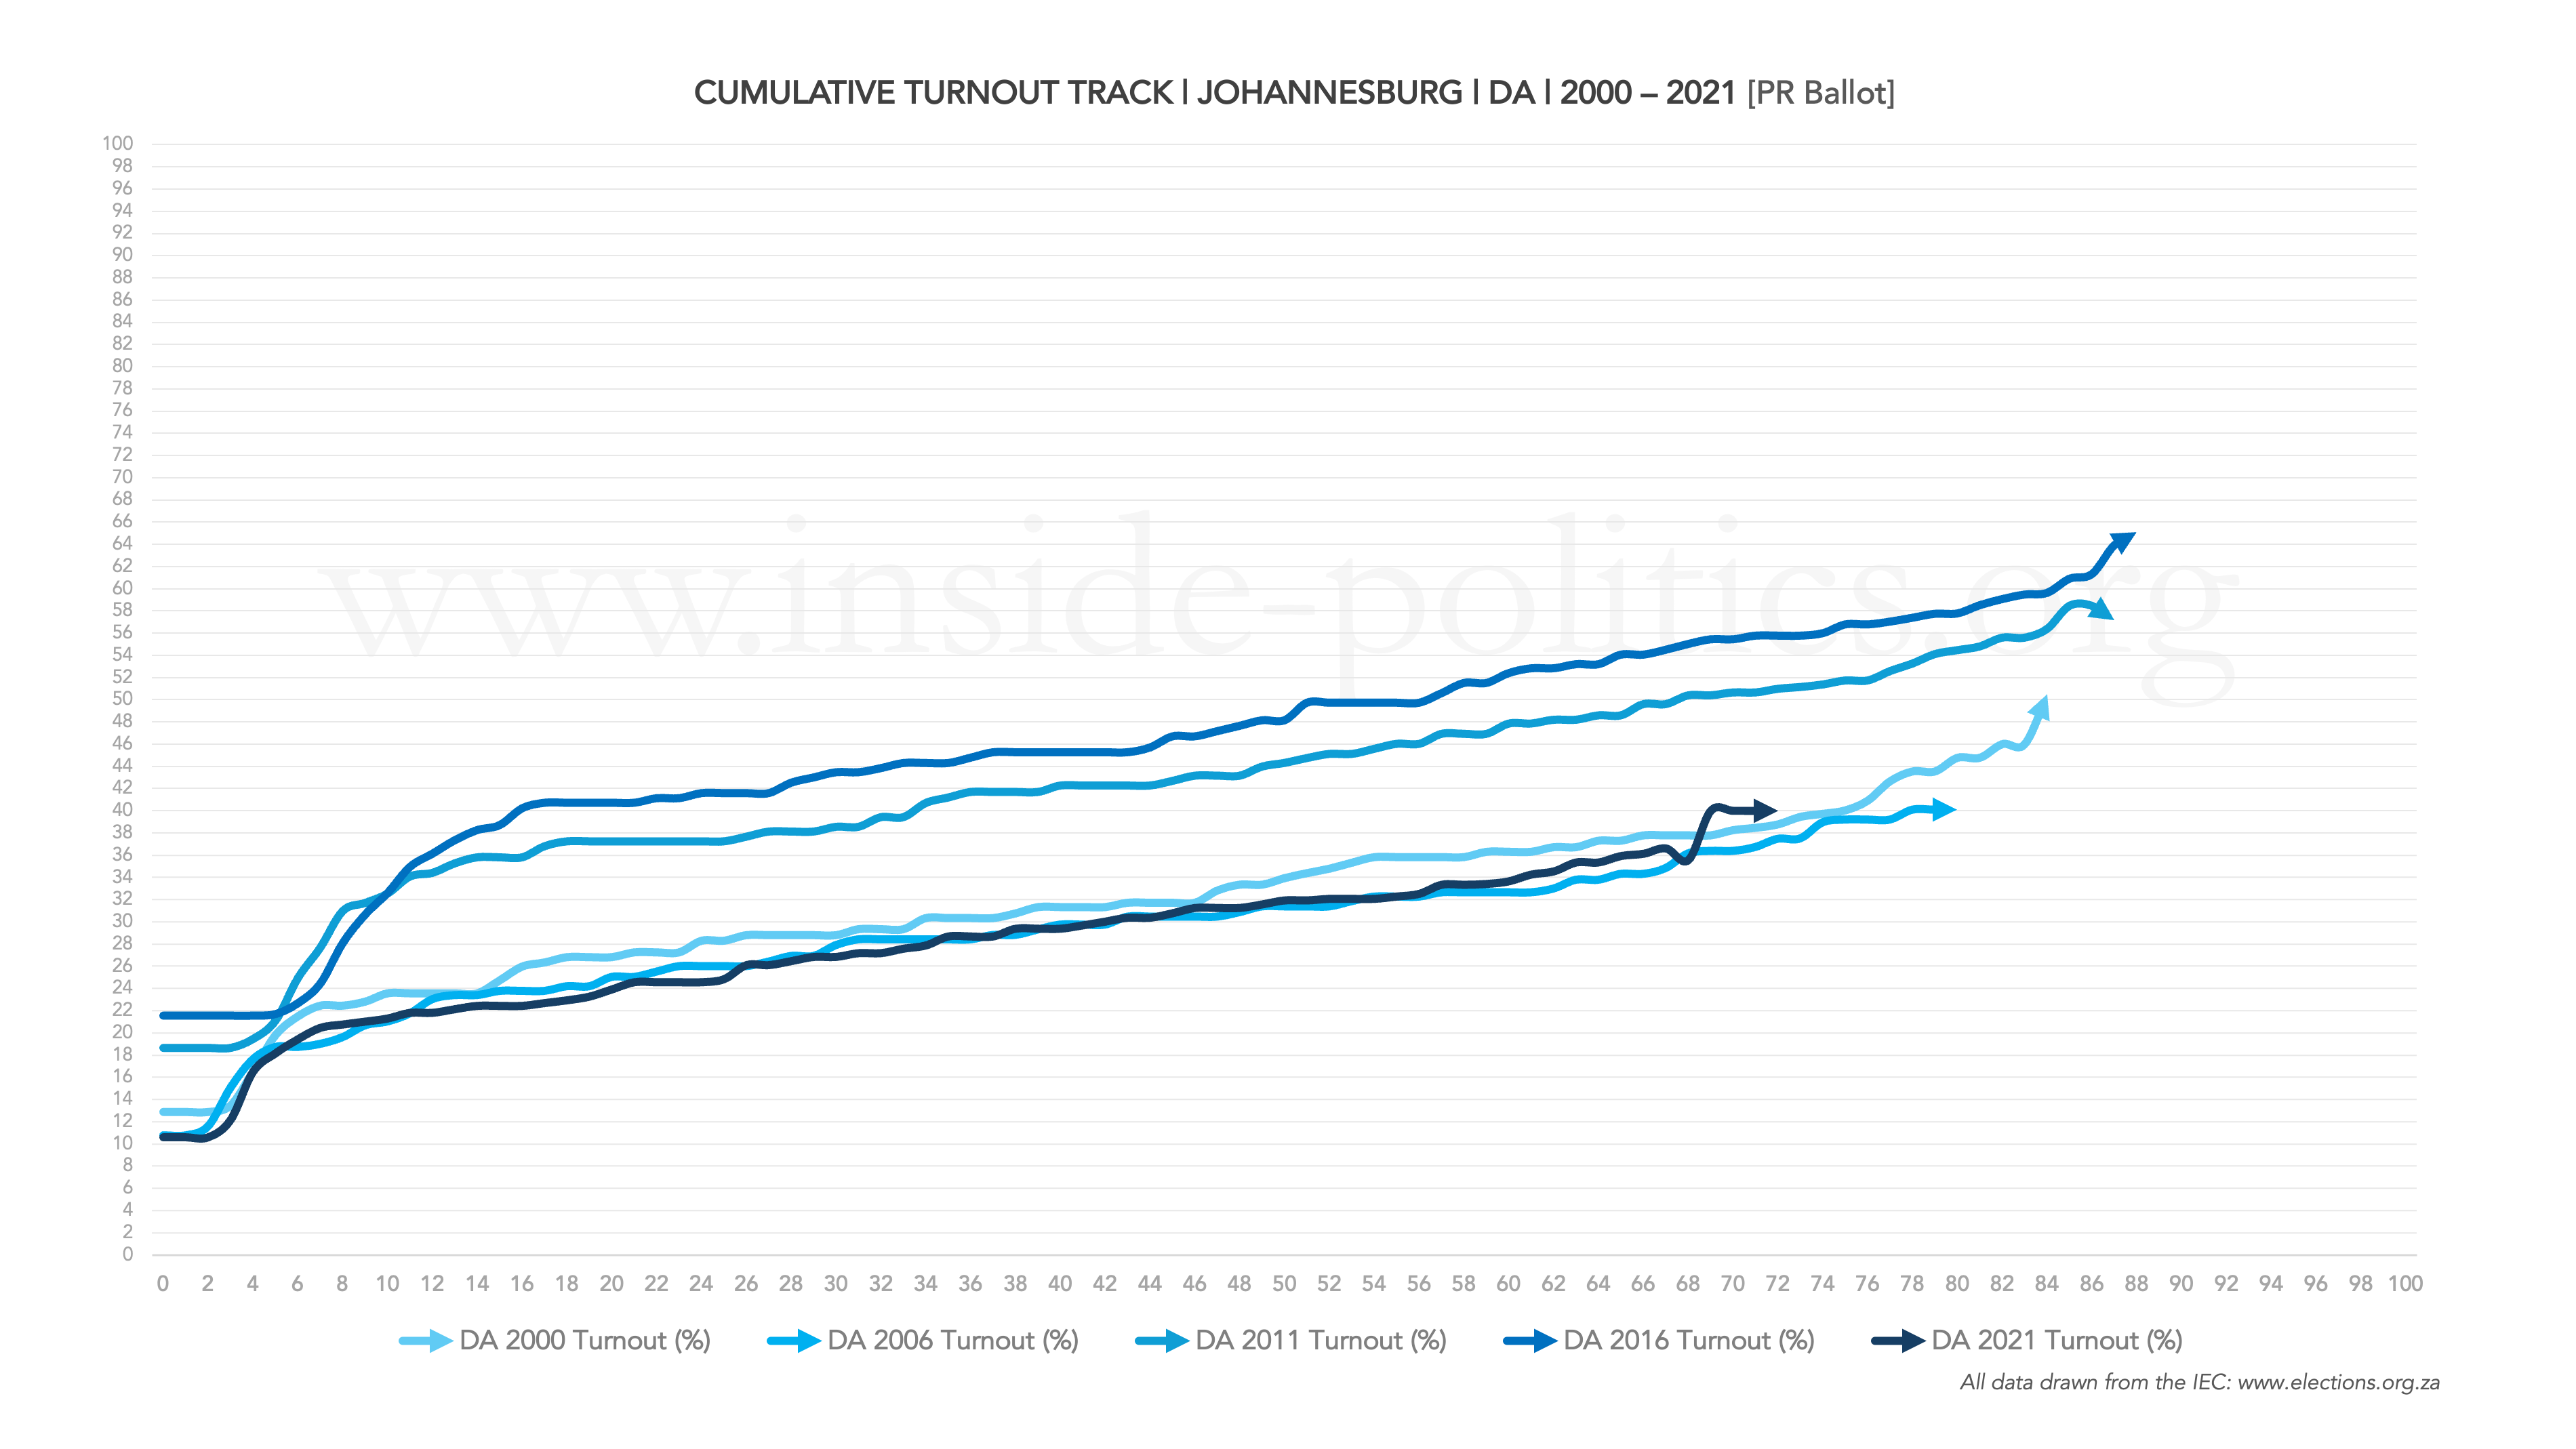
- General turnout trends for a party.
- The relationship between turnout and wards (how many wards a party managed to achieve a given performance percentage point in (0-100)
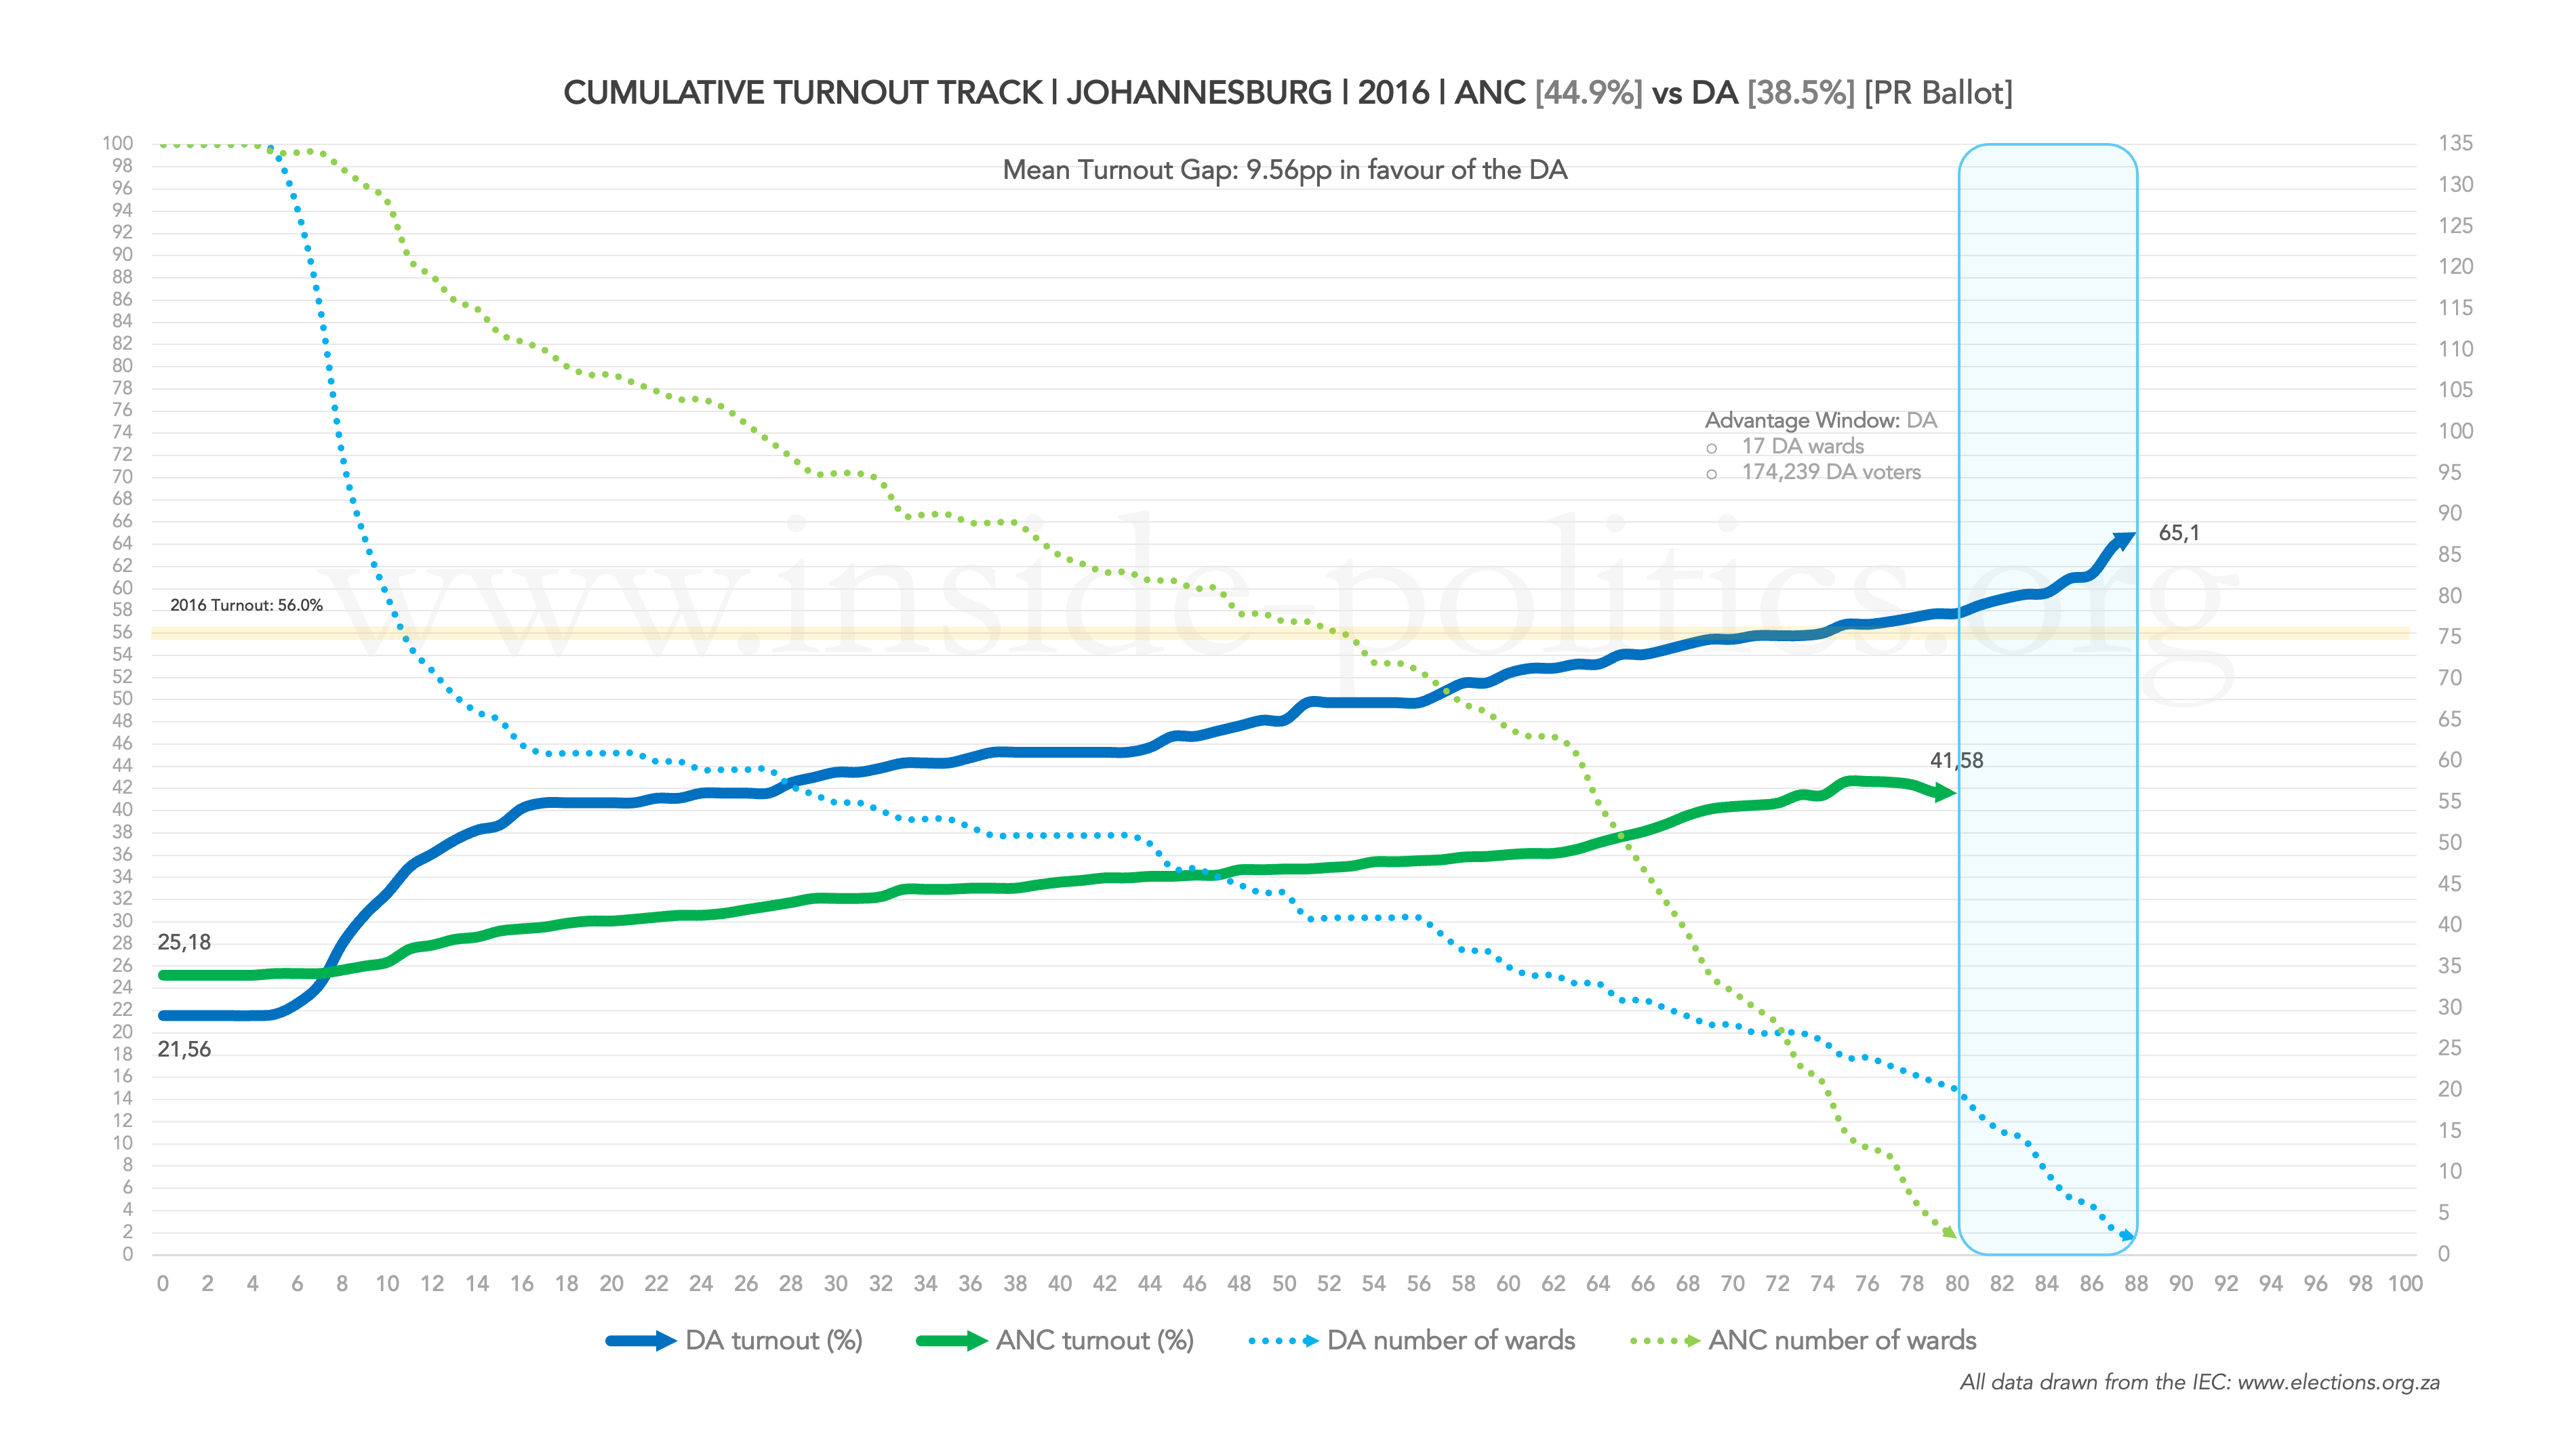
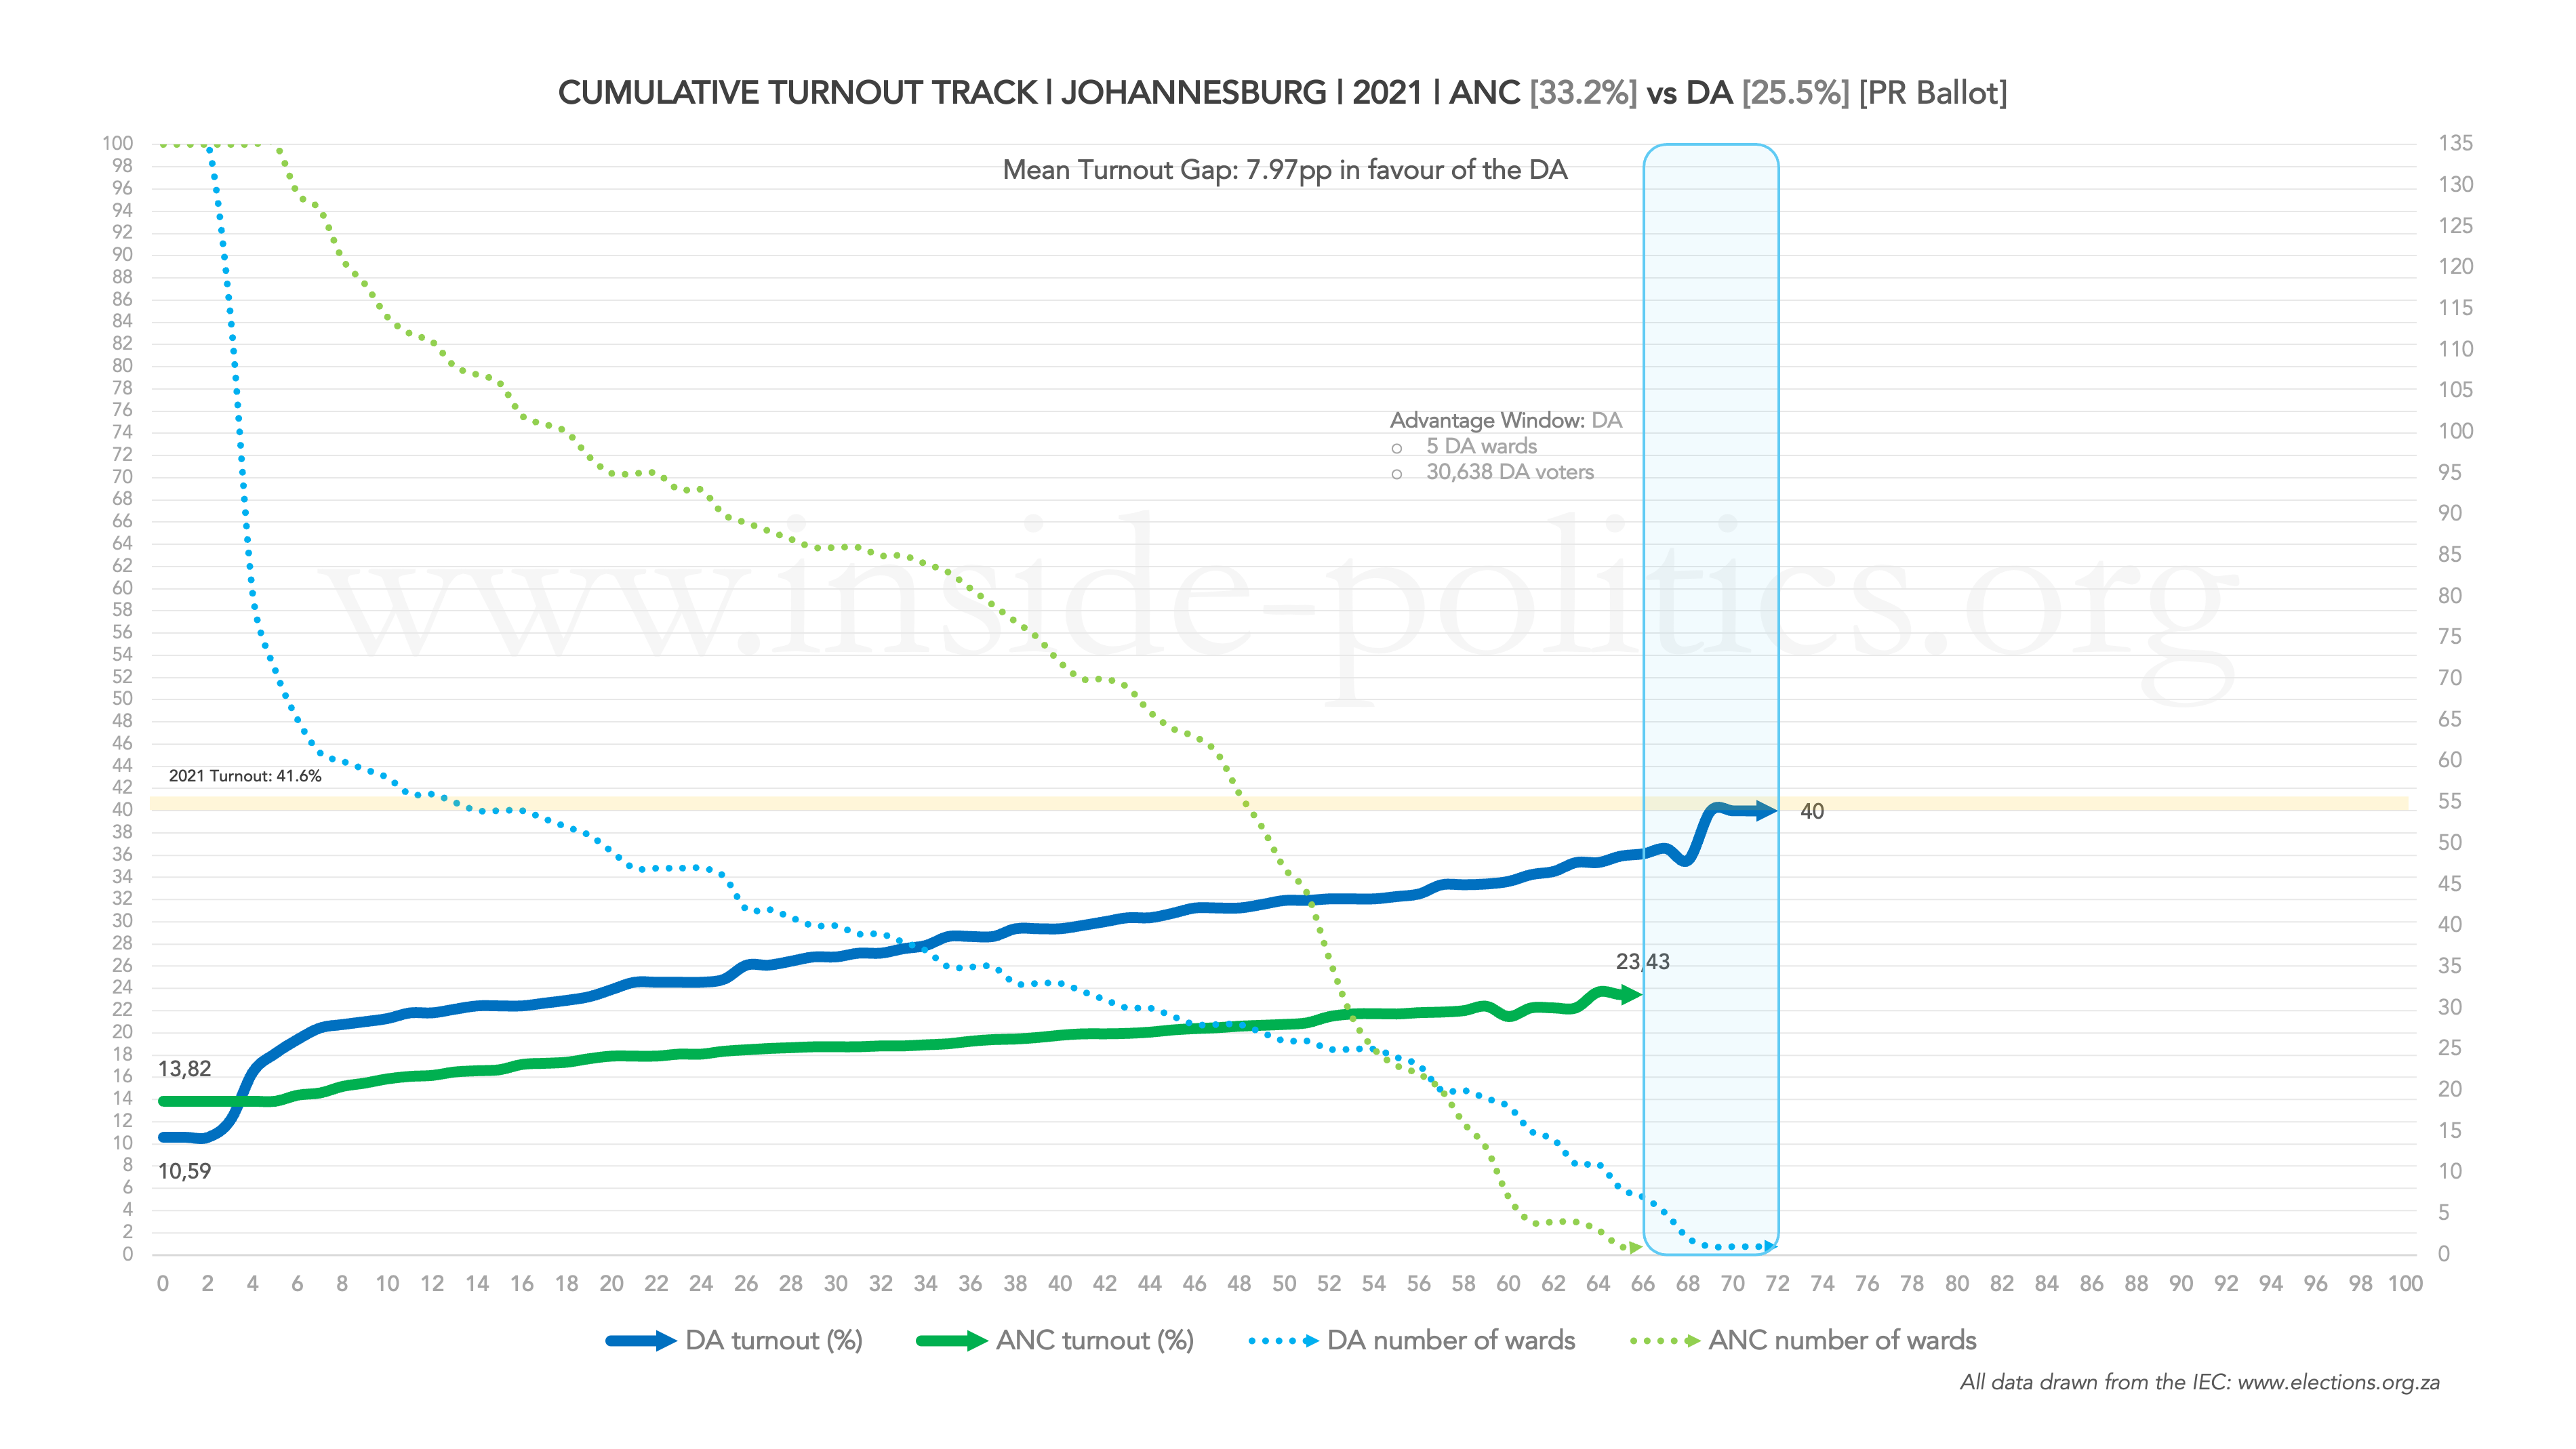
- Differential turnout between the ANC and the DA; that is, which party turned their voters out at a higher rate (if one party’s line is above the other, it means it was turning its voters out to a higher degree than the party below it – you can also see the average size of the gap at the top of the graph).
The turnout percentage runs up the Y-axis on the left (1-100), the performance percentages (0-100) along the X-axis and the ward count runs up the secondary Y-axis, on the right. Note that the award count does not stay consistent for all years.
These graphs cover five local elections, from 2000-2021.
ANC-DA Turnout Track: JHB | All Wards | 2000
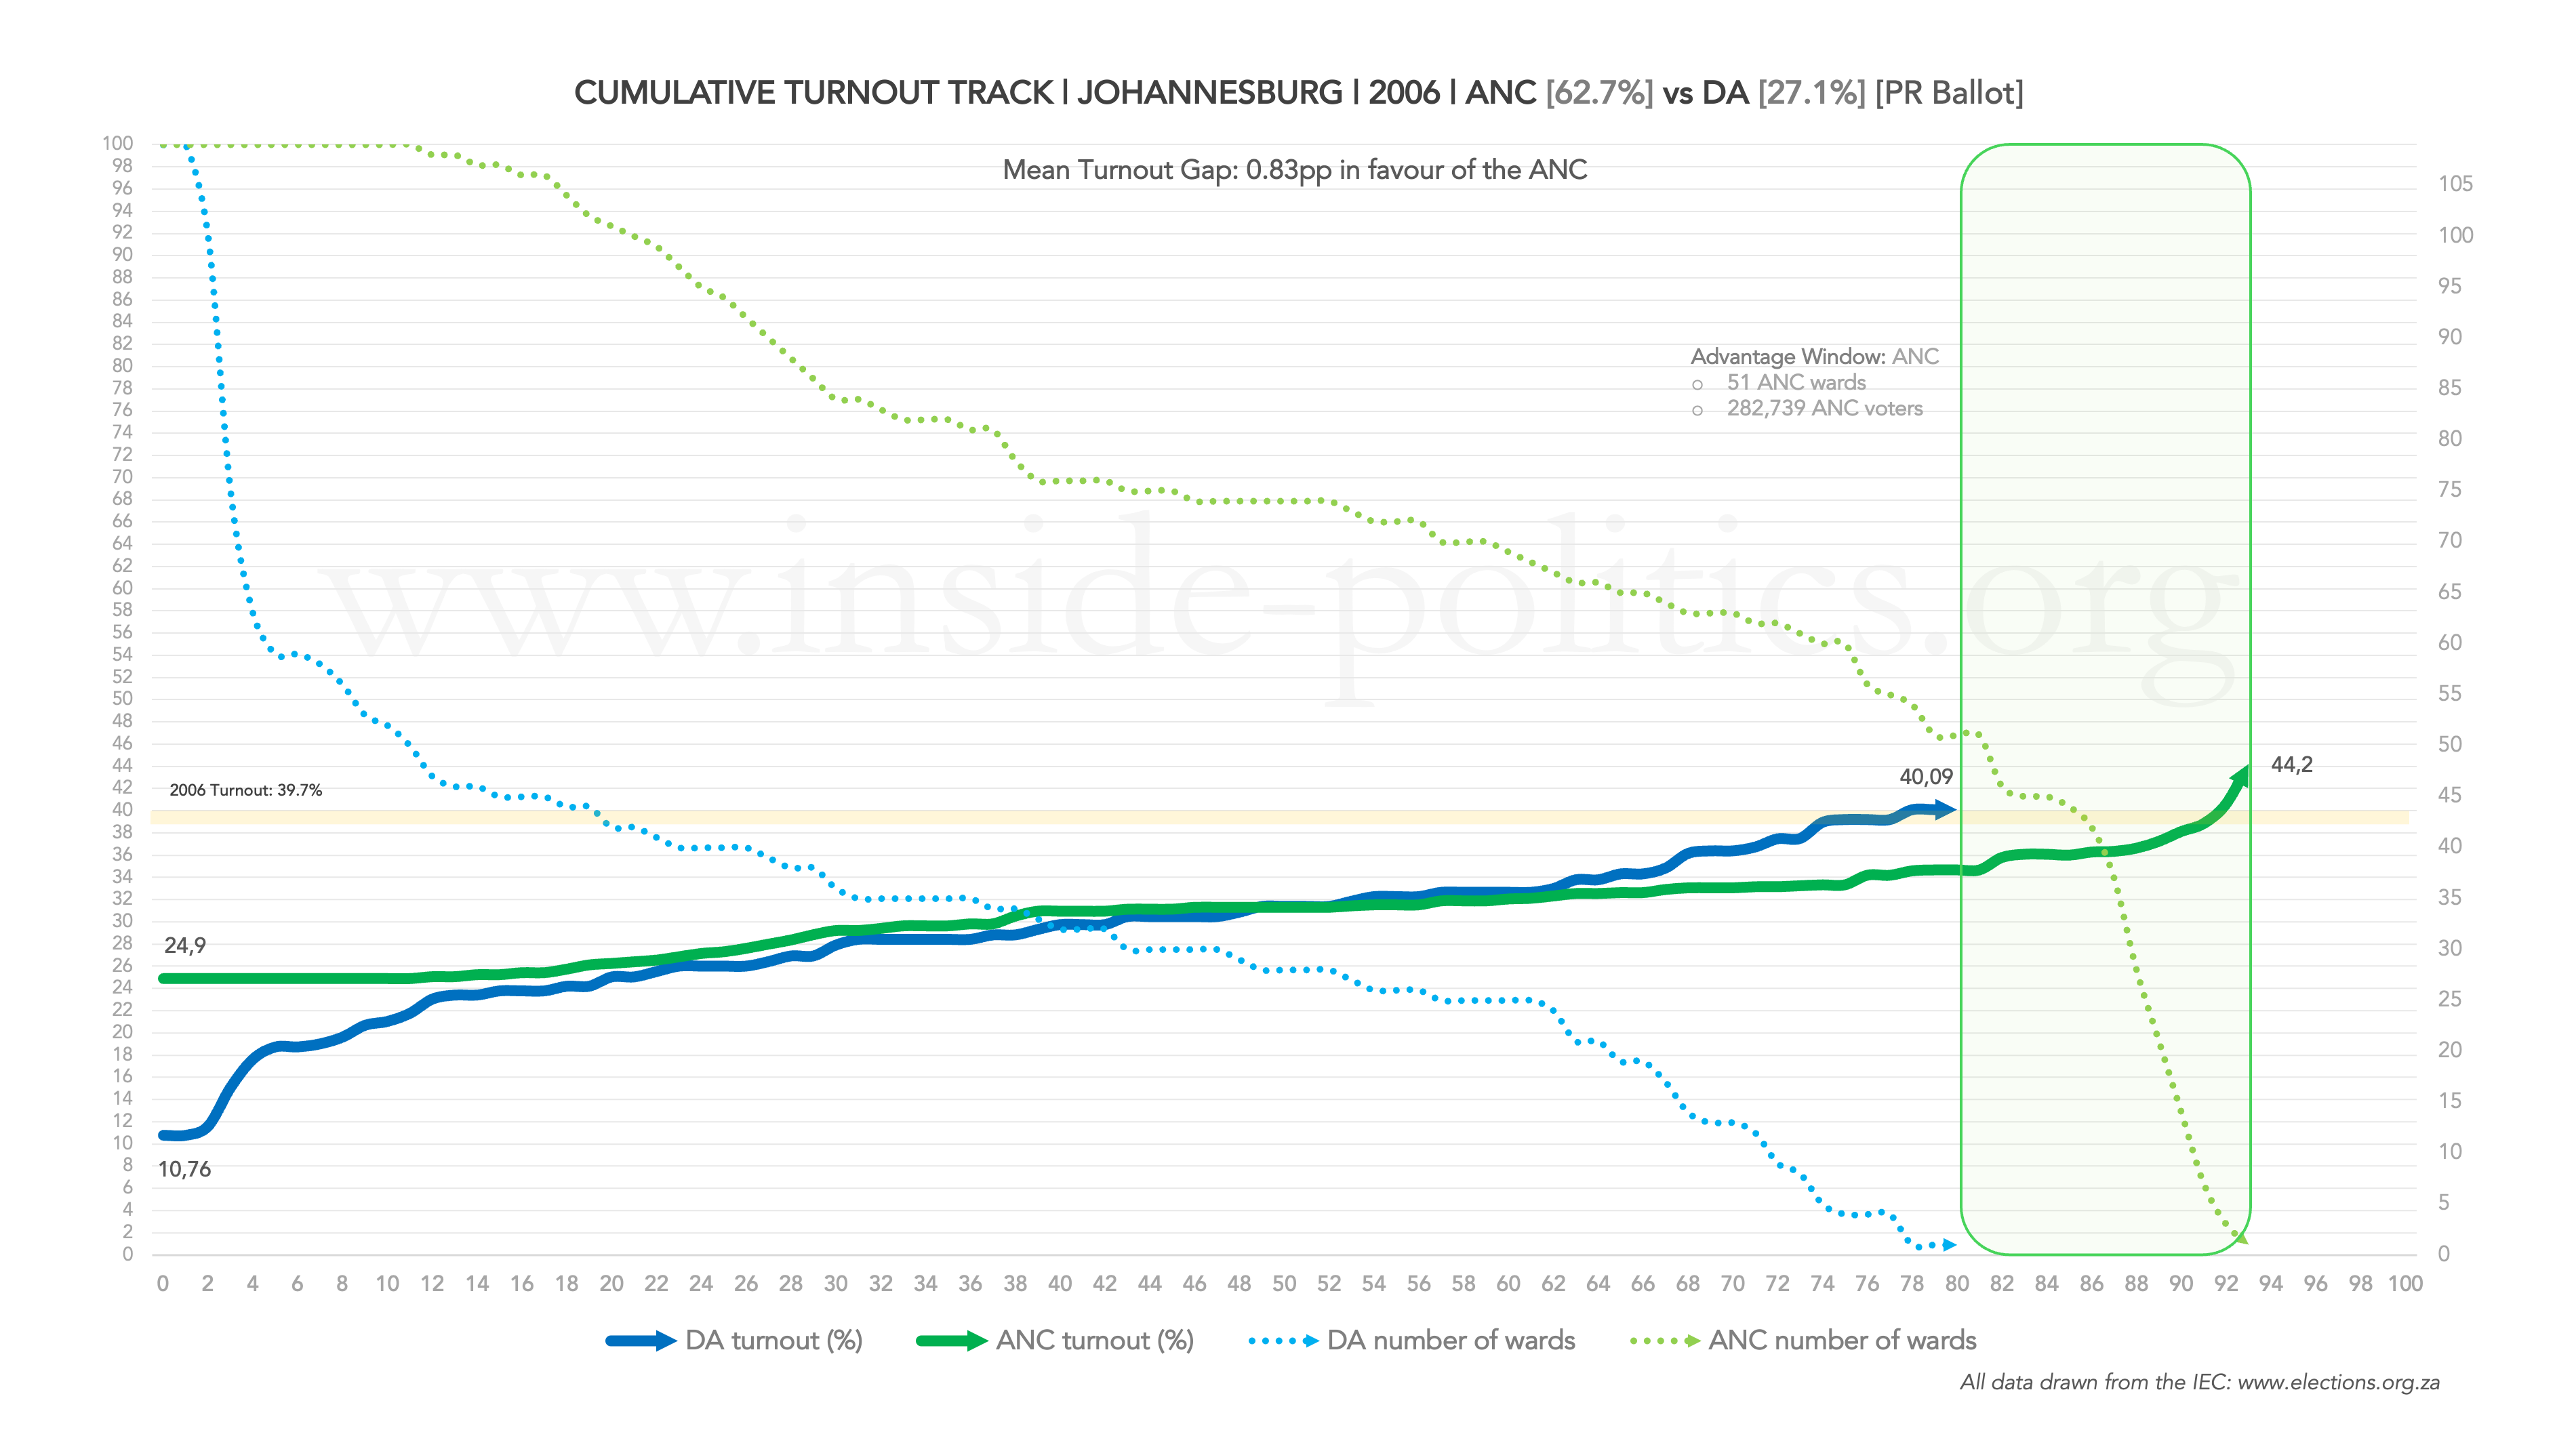
ANC-DA Turnout Track: JHB | All Wards | 2006
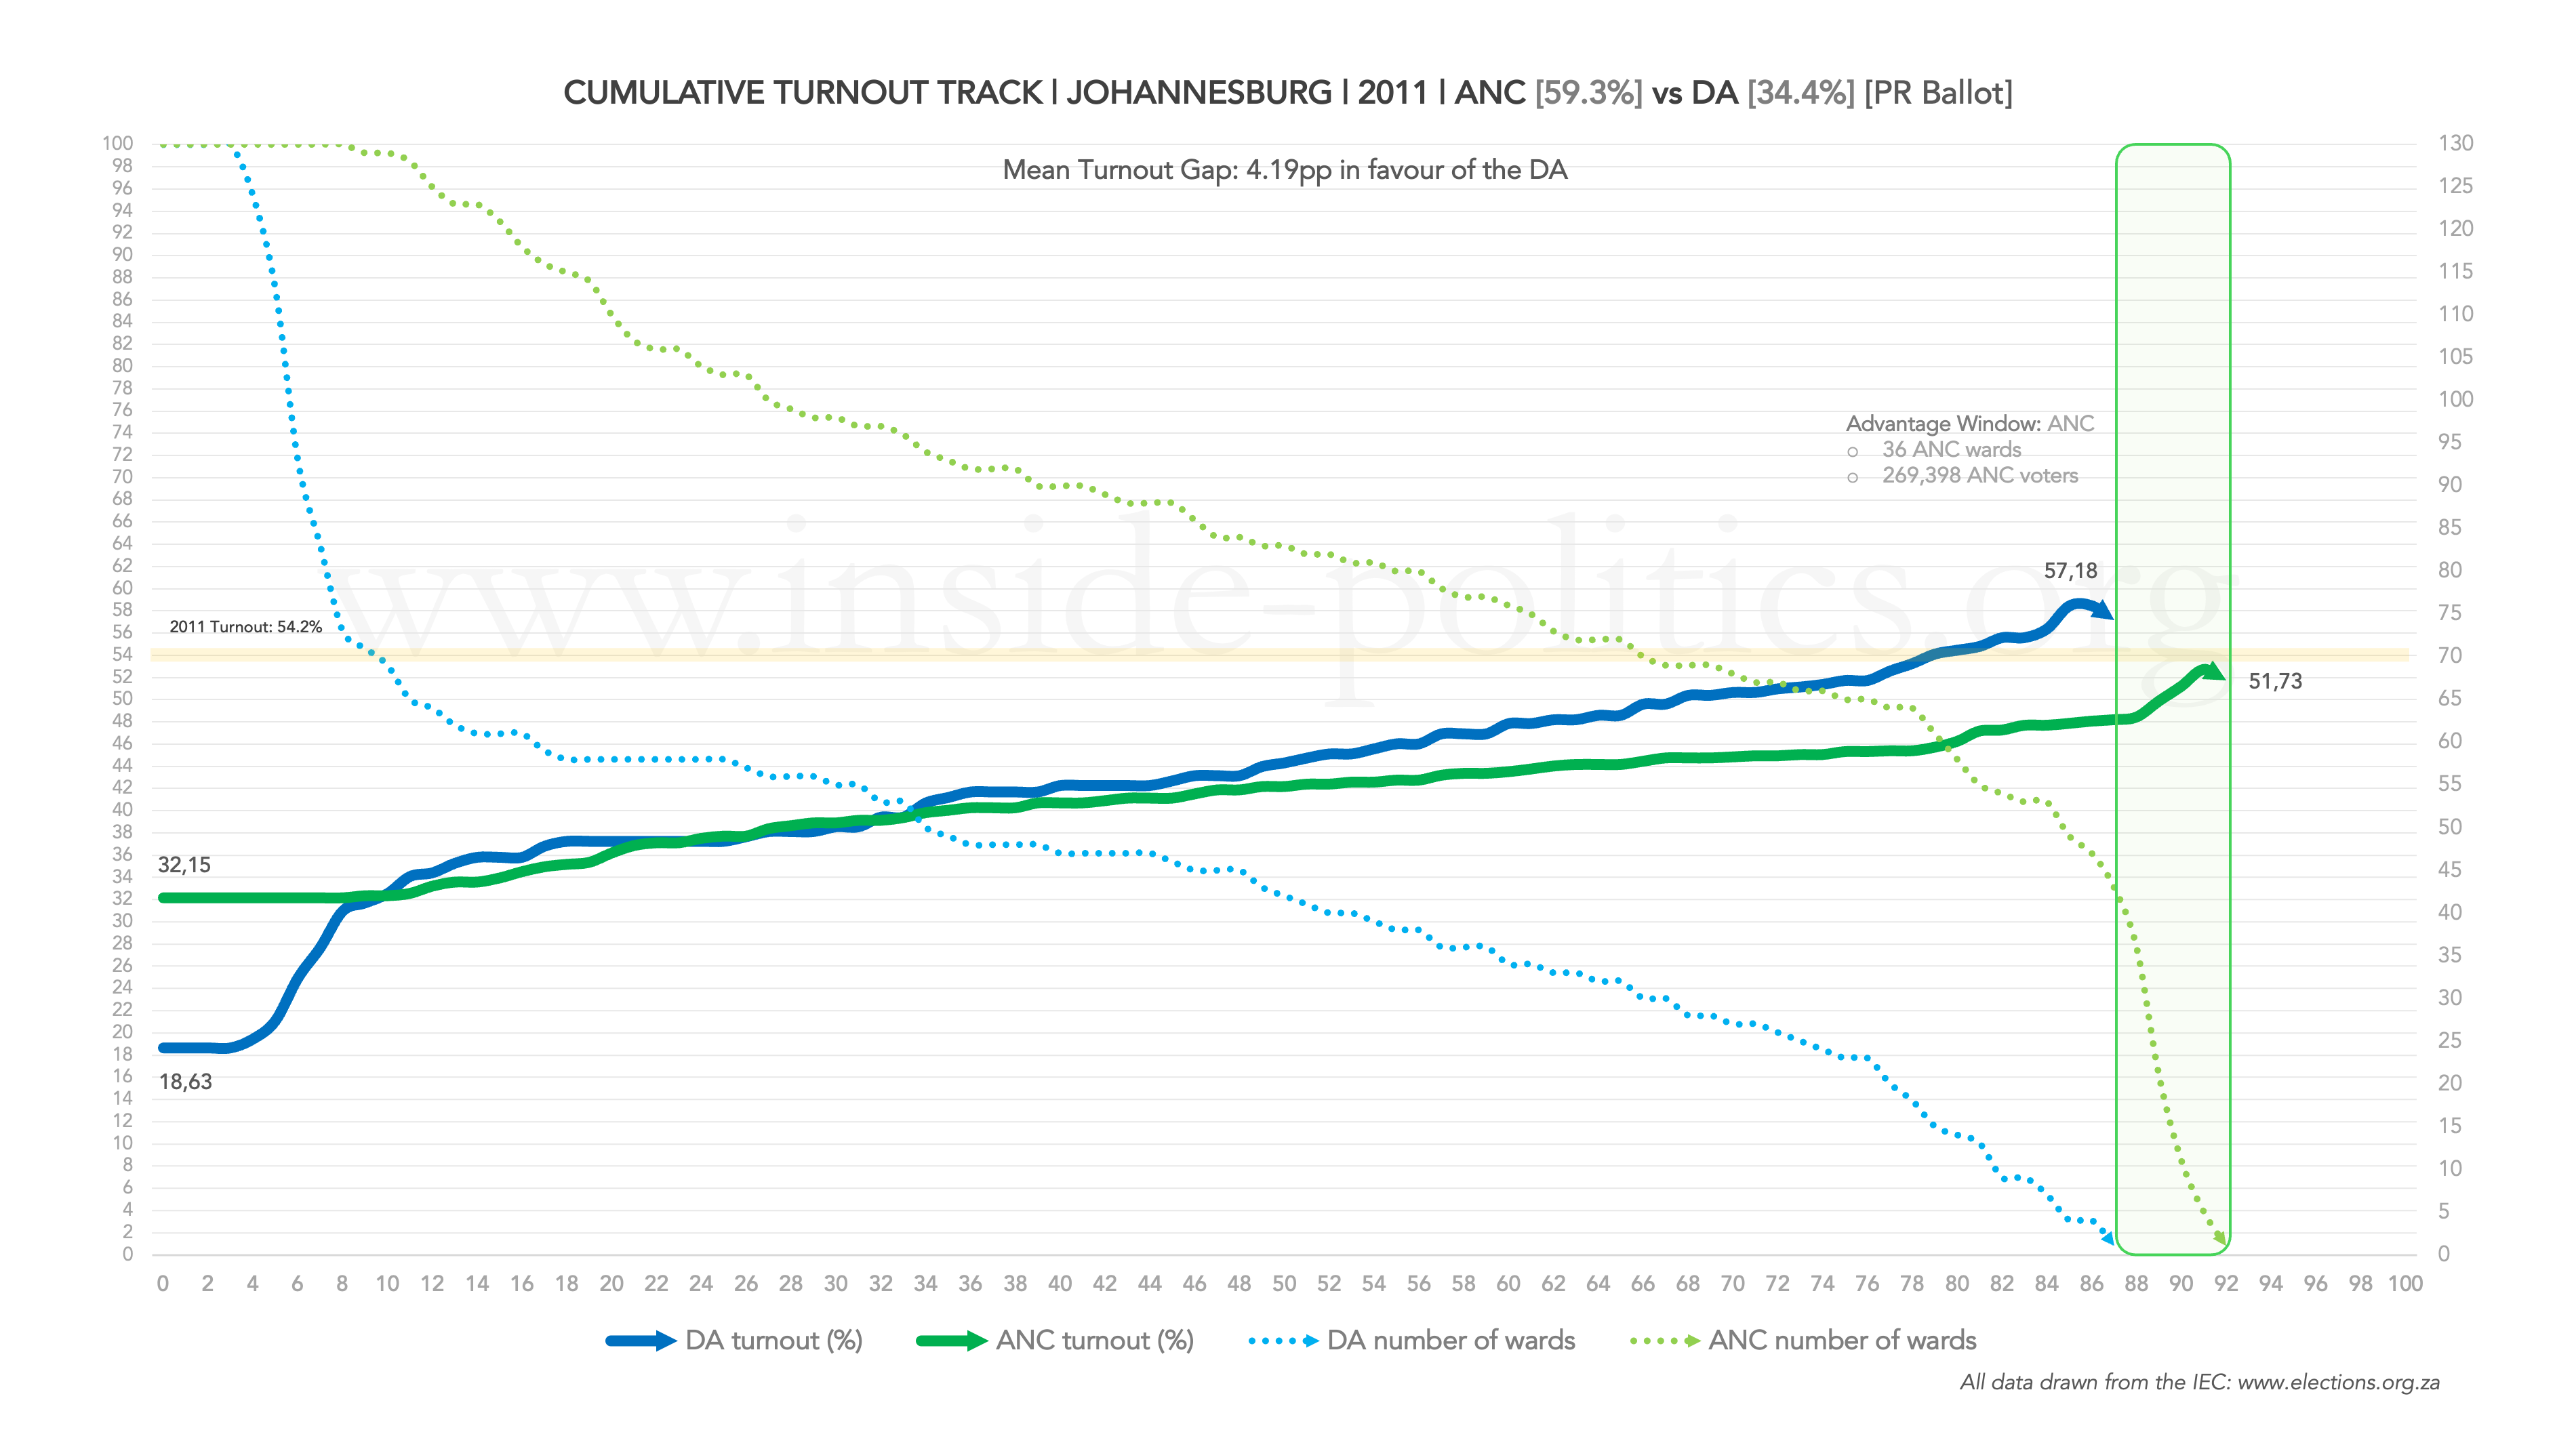
ANC-DA Turnout Track: JHB | All Wards | 2011
ANC-DA Turnout Track: JHB | All Wards | 2016
ANC-DA Turnout Track: JHB | All Wards | 2021
ANC Turnout Tracks: JHB | All Wards | All Years (2000-2021)
DA Turnout Tracks: JHB | All Wards | All Years (2000-2021)
Discover more from inside politics
Subscribe to get the latest posts sent to your email.

You must be logged in to post a comment.