
Election 2026/7 [13] How many votes the DA needs for 50% in JHB [Part II]
by The Editor

This is the second in a two part series. Here I will outline the most plausible scenarios for the DA to obtain 50% in Johannesburg, using the method and tools set out in Part 1.
How many votes the DA needs for 50% in JHB [Part II]
By: Gareth van Onselen
Follow @GvanOnselen
20 February 2026
This essay is the 13th in an on-going series on Election 2026/7, for all other editions of this series, please click here: Election 2026/7
Introduction
Please see Part 1, to understand where most of these numbers come from.
In her Common Sense interview, which prompted this analysis, Zille says, “If the DA can replicate its 2016 success, we will come very close to winning an outright majority.” So, 2016 is a helpful benchmark for comparative purposes. And the first thing we need to do, before running some scenarios, is project the 2016 result into the present. This will be our frame of reference.
I will spare you the details but, to do that, we need to work out the DA turnout for each ward in 2016, and project that onto the current registered voters total per ward in Johannesburg, and see what that gives us.
Total DA votes = 527,181
DA percentage = 40.0%
That is a problem for Zille. 2016 turnout levels (an average of 56%) do deliver the 500,000 votes the DA is after, but that is still 10pts off 50%.
So for the DA to simply replicate 2016 is not the answer. For one, current registration levels are going to improve and the chances of turnout improving by 14pts is fantastical. But we have our starting point. Let us now see what different options regards registration and turnout give us.
Five general turnout scenarios
I am going to focus on five possible election scenarios, for the DA in Johannesburg, starting with registration. In 2016, there were 55,000 new registrations. The scenarios are:
- Tier 1 Registration: 20,000 new registrations (Very poor registration)
- Tier 2 Registration: 40,000 new registrations (Poor registration)
- Tier 3 Registration: 60,000 new registrations (Average registration)
- Tier 4 Registration: 80,000 new registrations (Good registration)
- Tier 5 Registration: 100,000 new registrations (Very good registration)
I will use five possible turnout scenarios. In 2021, turnout was 41.6%. The scenarios are:
- Tier 1 Turnout: 30% (Very poor turnout)
- Tier 2 Turnout: 35% (Poor turnout)
- Tier 3 Turnout: 40% (Average turnout)
- Tier 4 Turnout: 45% (Good turnout)
- Tier 5 Turnout: 50% (Very good turnout)
And finally, I am going to use a projected number of votes for the DA. In 2021, the DA got 235,120 votes on the PR ballot, in 2016, it got 483,018. Zille says the party is aiming (in effect) for 500,000. The scenarios are:
- Tier 1 DA vote share: 200,000 (Very poor DA vote share)
- Tier 2 DA vote share: 250,000 (Poor DA vote share)
- Tier 3 DA vote share: 300,000 (Average DA vote share)
- Tier 4 DA vote share: 400,000 (Good DA vote share)
- Tier 5 DA vote share: 500,000 (Very good DA vote share)
This seems like a strong and credible range of options. We can do this all again when we have the actually registration numbers, but for the moment they will do perfectly well to establish what is, and what is not possible. Let us apply those to our turnout models, and see what they produce.
Tier 1: Very poor: registration (+20,000), turnout (30%) and DA vote share (200,000)
DA percentage: 28.5%
Tier 2: Poor: registration (+40,000), turnout (35%) and DA vote share (250,000)
DA percentage: 30.3%
Tier 3: Average: registration (+60,000), turnout (40%) and DA vote share (300,000)
DA percentage: 31.6%
Tier 4: Good: registration (+80,000), turnout (45%) and DA vote share (400,000)
DA percentage: 36.7%
Tier 5: Very good: registration (+100,000), turnout (50%) and DA vote share (500,000)
DA percentage: 41.4%
These are very generalised scenarios and they assume to a certain degree a uniform relationship between registration, turnout and the DA’s vote share. But they do also indciate that, even if everything goes exceptionally well, 500,000 votes is by no means a guarantee of 50%. In the Tier 5 scenario here, it leaves the DA some 8pts shy.
If we take every single instance of the DA hitting 50%, in every single model, and consolidate them into one document, we get the following. In it, you will see I have highlighted the 500,000 (yellow) and 400,000 (green) vote marks.
Every 500,000 vote mark that equates to 50%, in every model, requires overall turnout to increase or registration to be exceptional. Every 400,000 mark that equates to 50%, however, sits at a more reasonable level – a turnout range from 33% to 34%.
So we have a good general set of parameters now, to understand what is possible. For the DA to get 500,000 votes (and 50%) it needs to reverse the turnout trend, and break all know records for LGE registrations in JHB. But 400,000 votes can deliver 50%, if turnout continues to drop, and registration doesn’t have to be exceptional at all. So, just in general terms, 400,000 votes will be the DA’s first target.
But there is something we are not factoring in. The thing about the DA and local government elections, is that historically, it performs disproportionately well. And it does that because its relationship with both registration and turnout is not uniform. It does both to a better degree than the average. We need a way to incorporate this, when run these scenarios through.
Factoring in differential turnout and other parties
Let us then assume turnout drops, say by half as much as last time – 7pts – down to 35%. And lets say the DA shoots the lights out during the registration weekends, and 80,000 new voters register (not all DA, but a disproportionate amount DA, as per usual), and lets say DA voters in particular, turnout disproportionately and it gets 400,000. What does that combination give us?
DA percentage: 47.7%
Now, that is the first time we have a really interesting number, politically. The problem is, you need to understand just what an outstanding result this would be. To get DA voters to vote in those numbers, when turnout itself remains significantly in decline, will require something extraordinary. And one of the things standing in the way, is 2021.
There are lots of ways to mathematically define a differential turnout. One of them is to develop what is called a mobilisation slope: a single number that illustrates the DA’s ability to beat the average. Here is how:
In simple terms: For each of JHB’s wards, we calculate two percentages:
- Overall turnout: Out of all registered voters, how many showed up?
- DA turnout: Out of all registered voters, how many voted DA?
Then we line up all 135 JHB wards from lowest turnout to highest turnout and draw a line through those points; then, measure it. That line tells us if overall turnout goes up, how much the DA’s turnout goes up in turn. The steepness of that line is called the mobilisation slope.
These are what those numbers were for the DA, in the last five LGEs, in Johannesburg:
- 2000: 0.90
- 2006: 0.76
- 2011: 1.23
- 2016: 1.79
- 2021: 1.11
Let’s look at 2016 as an example. The slope then was 1.8, the best it has ever been. That means, on average, if turnout in a ward goes up by 1 percentage point, DA turnout goes up by about 1.8 percentage points, on average. So the DA rises almost twice as fast as overall turnout. That is a very strong differential in the DA’s favour. But 2021 saw that collapse to almost negligible, all the way down to 1.1.
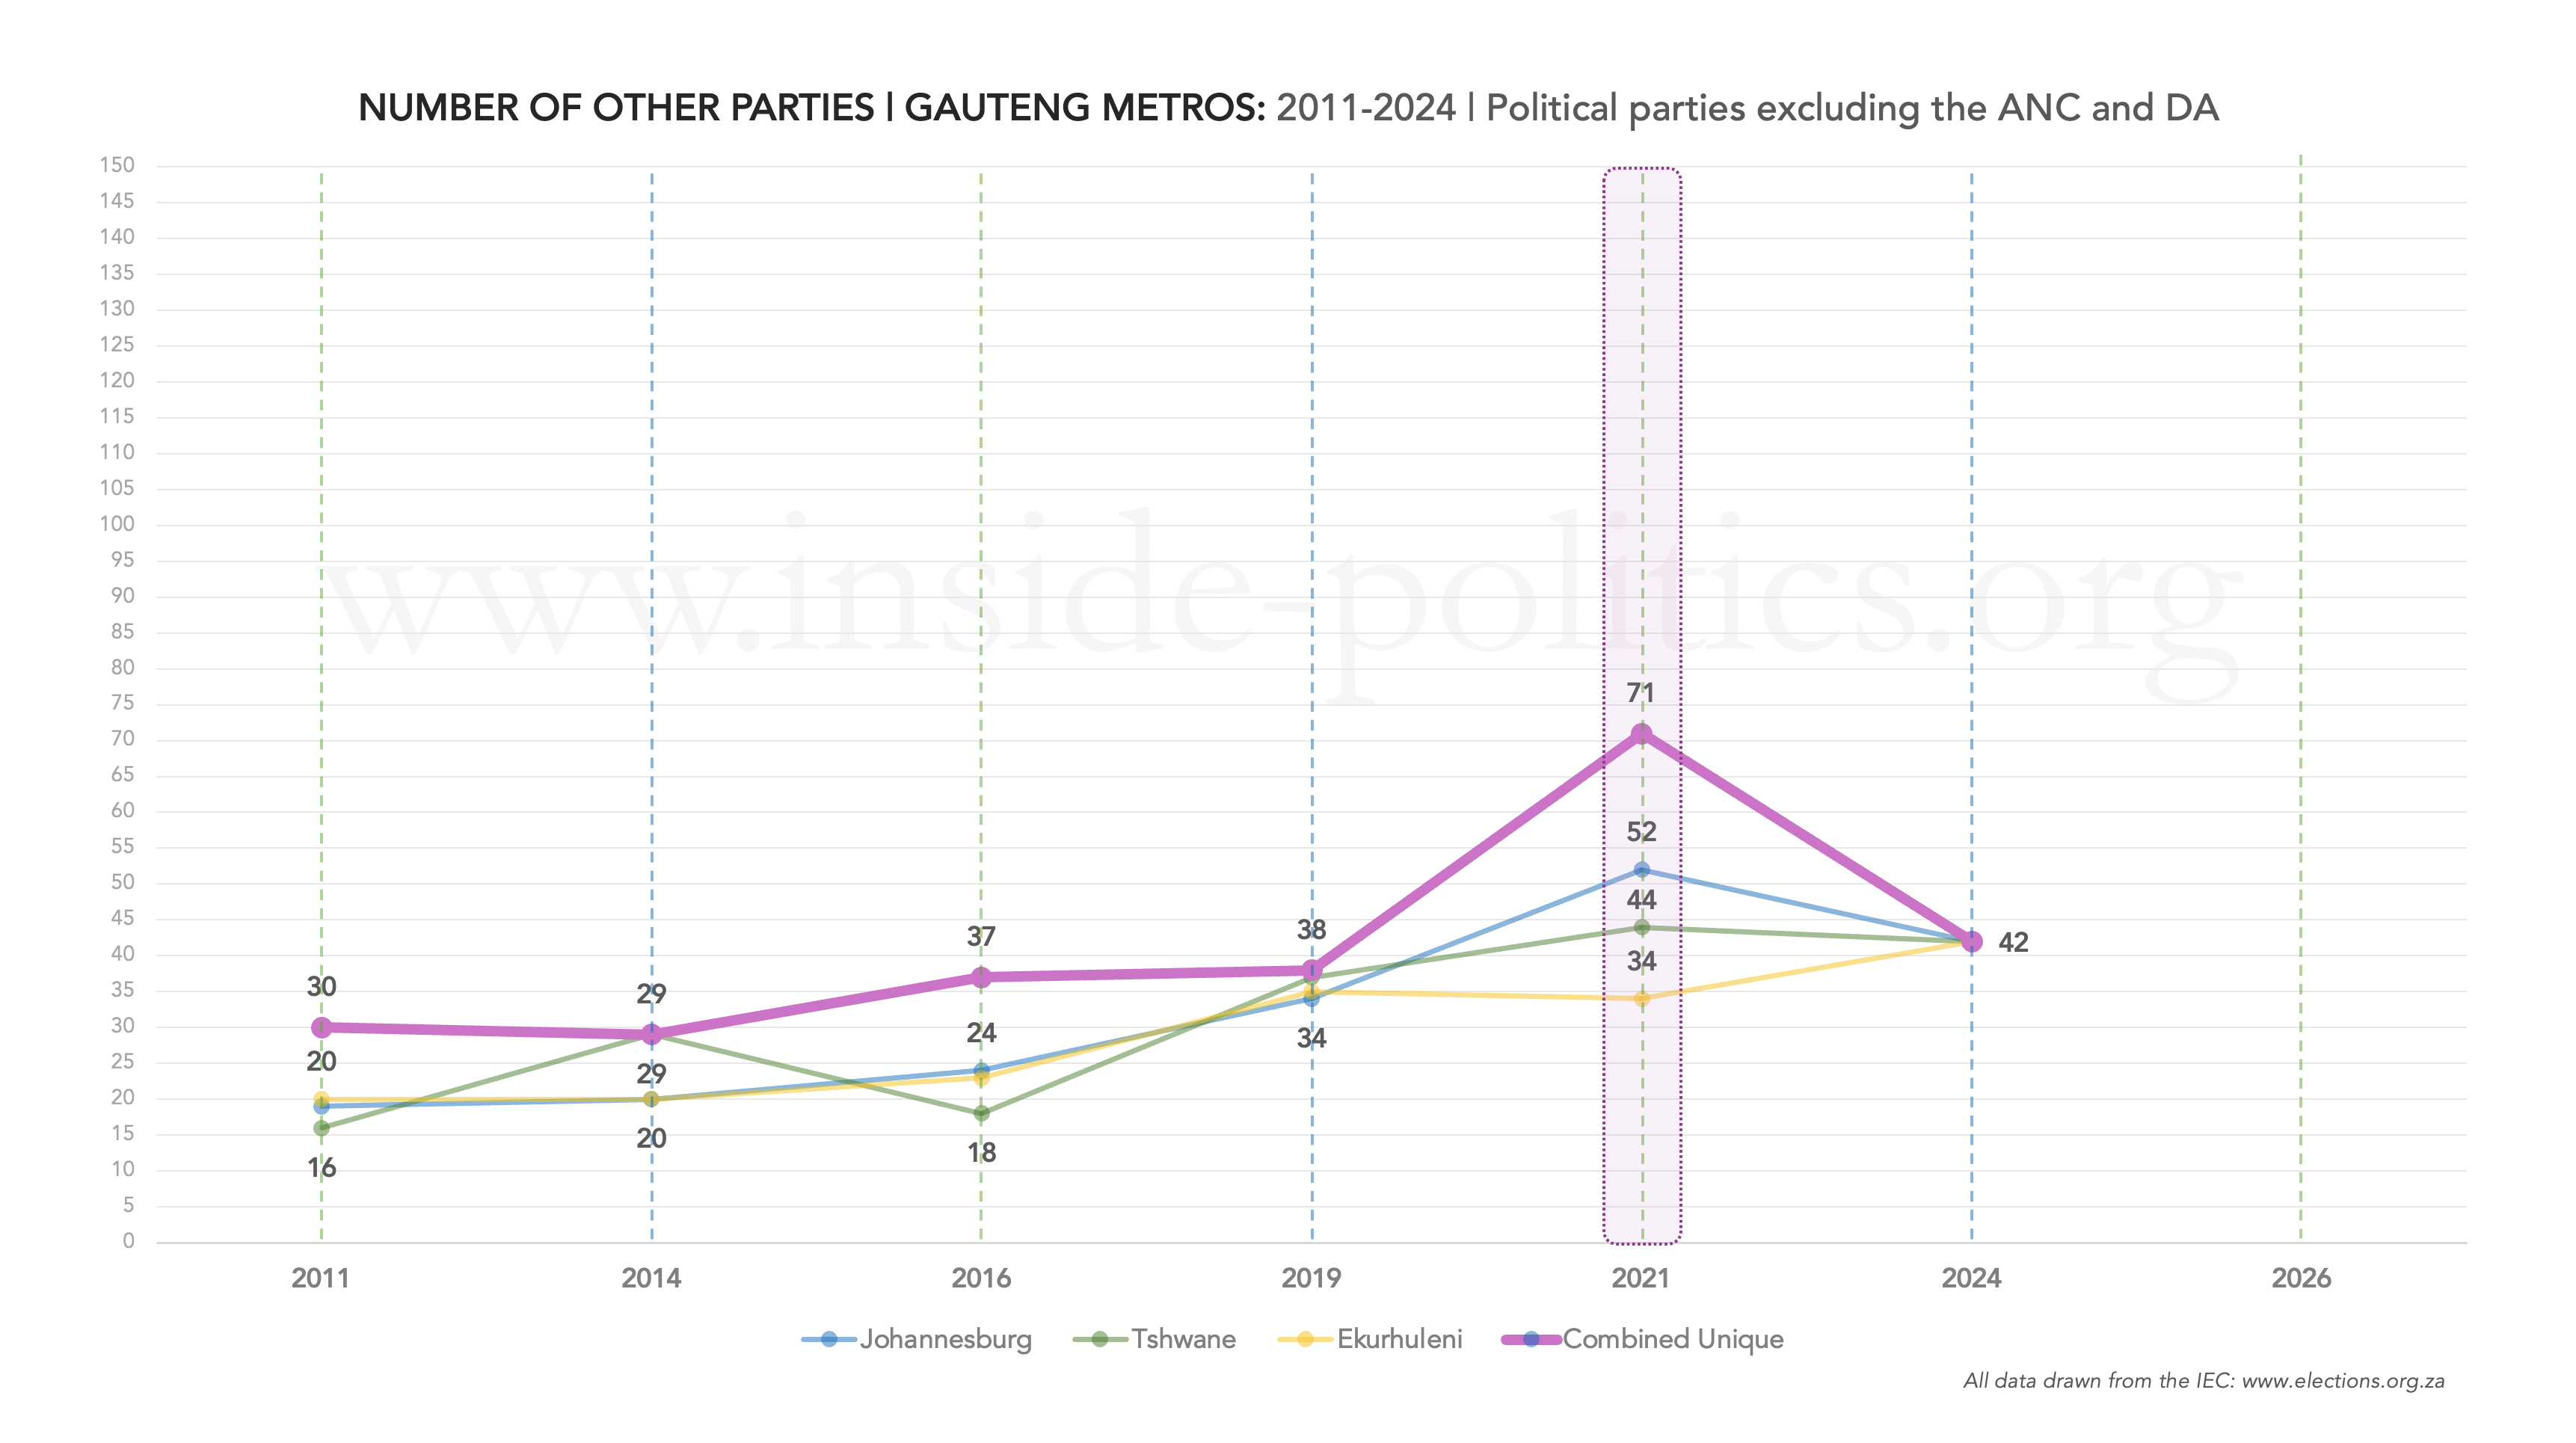
It wasn’t just turnout that did that, it was other parties. In 2021 the number of parties competing in JHB jumped from 37 (2016) to 71. It will jump again in 2026, so simply applying 2016 parameters to 2026, just doesn’t work, the metro is a profoundly different place now.
With that jump in the number of other parties, is a jump in their support. In 2016, all other parties, other than the ANC and DA, got 16.6%. In 2021, they got 41.3%. It is incredibly hard to argue that space will shrink in 2026.
What will really disturb the DA, is the turnout tracks (see here for full explanation) for all “other parties” (every party excluding the ANC and DA). Here they are for 2016 and 2021.
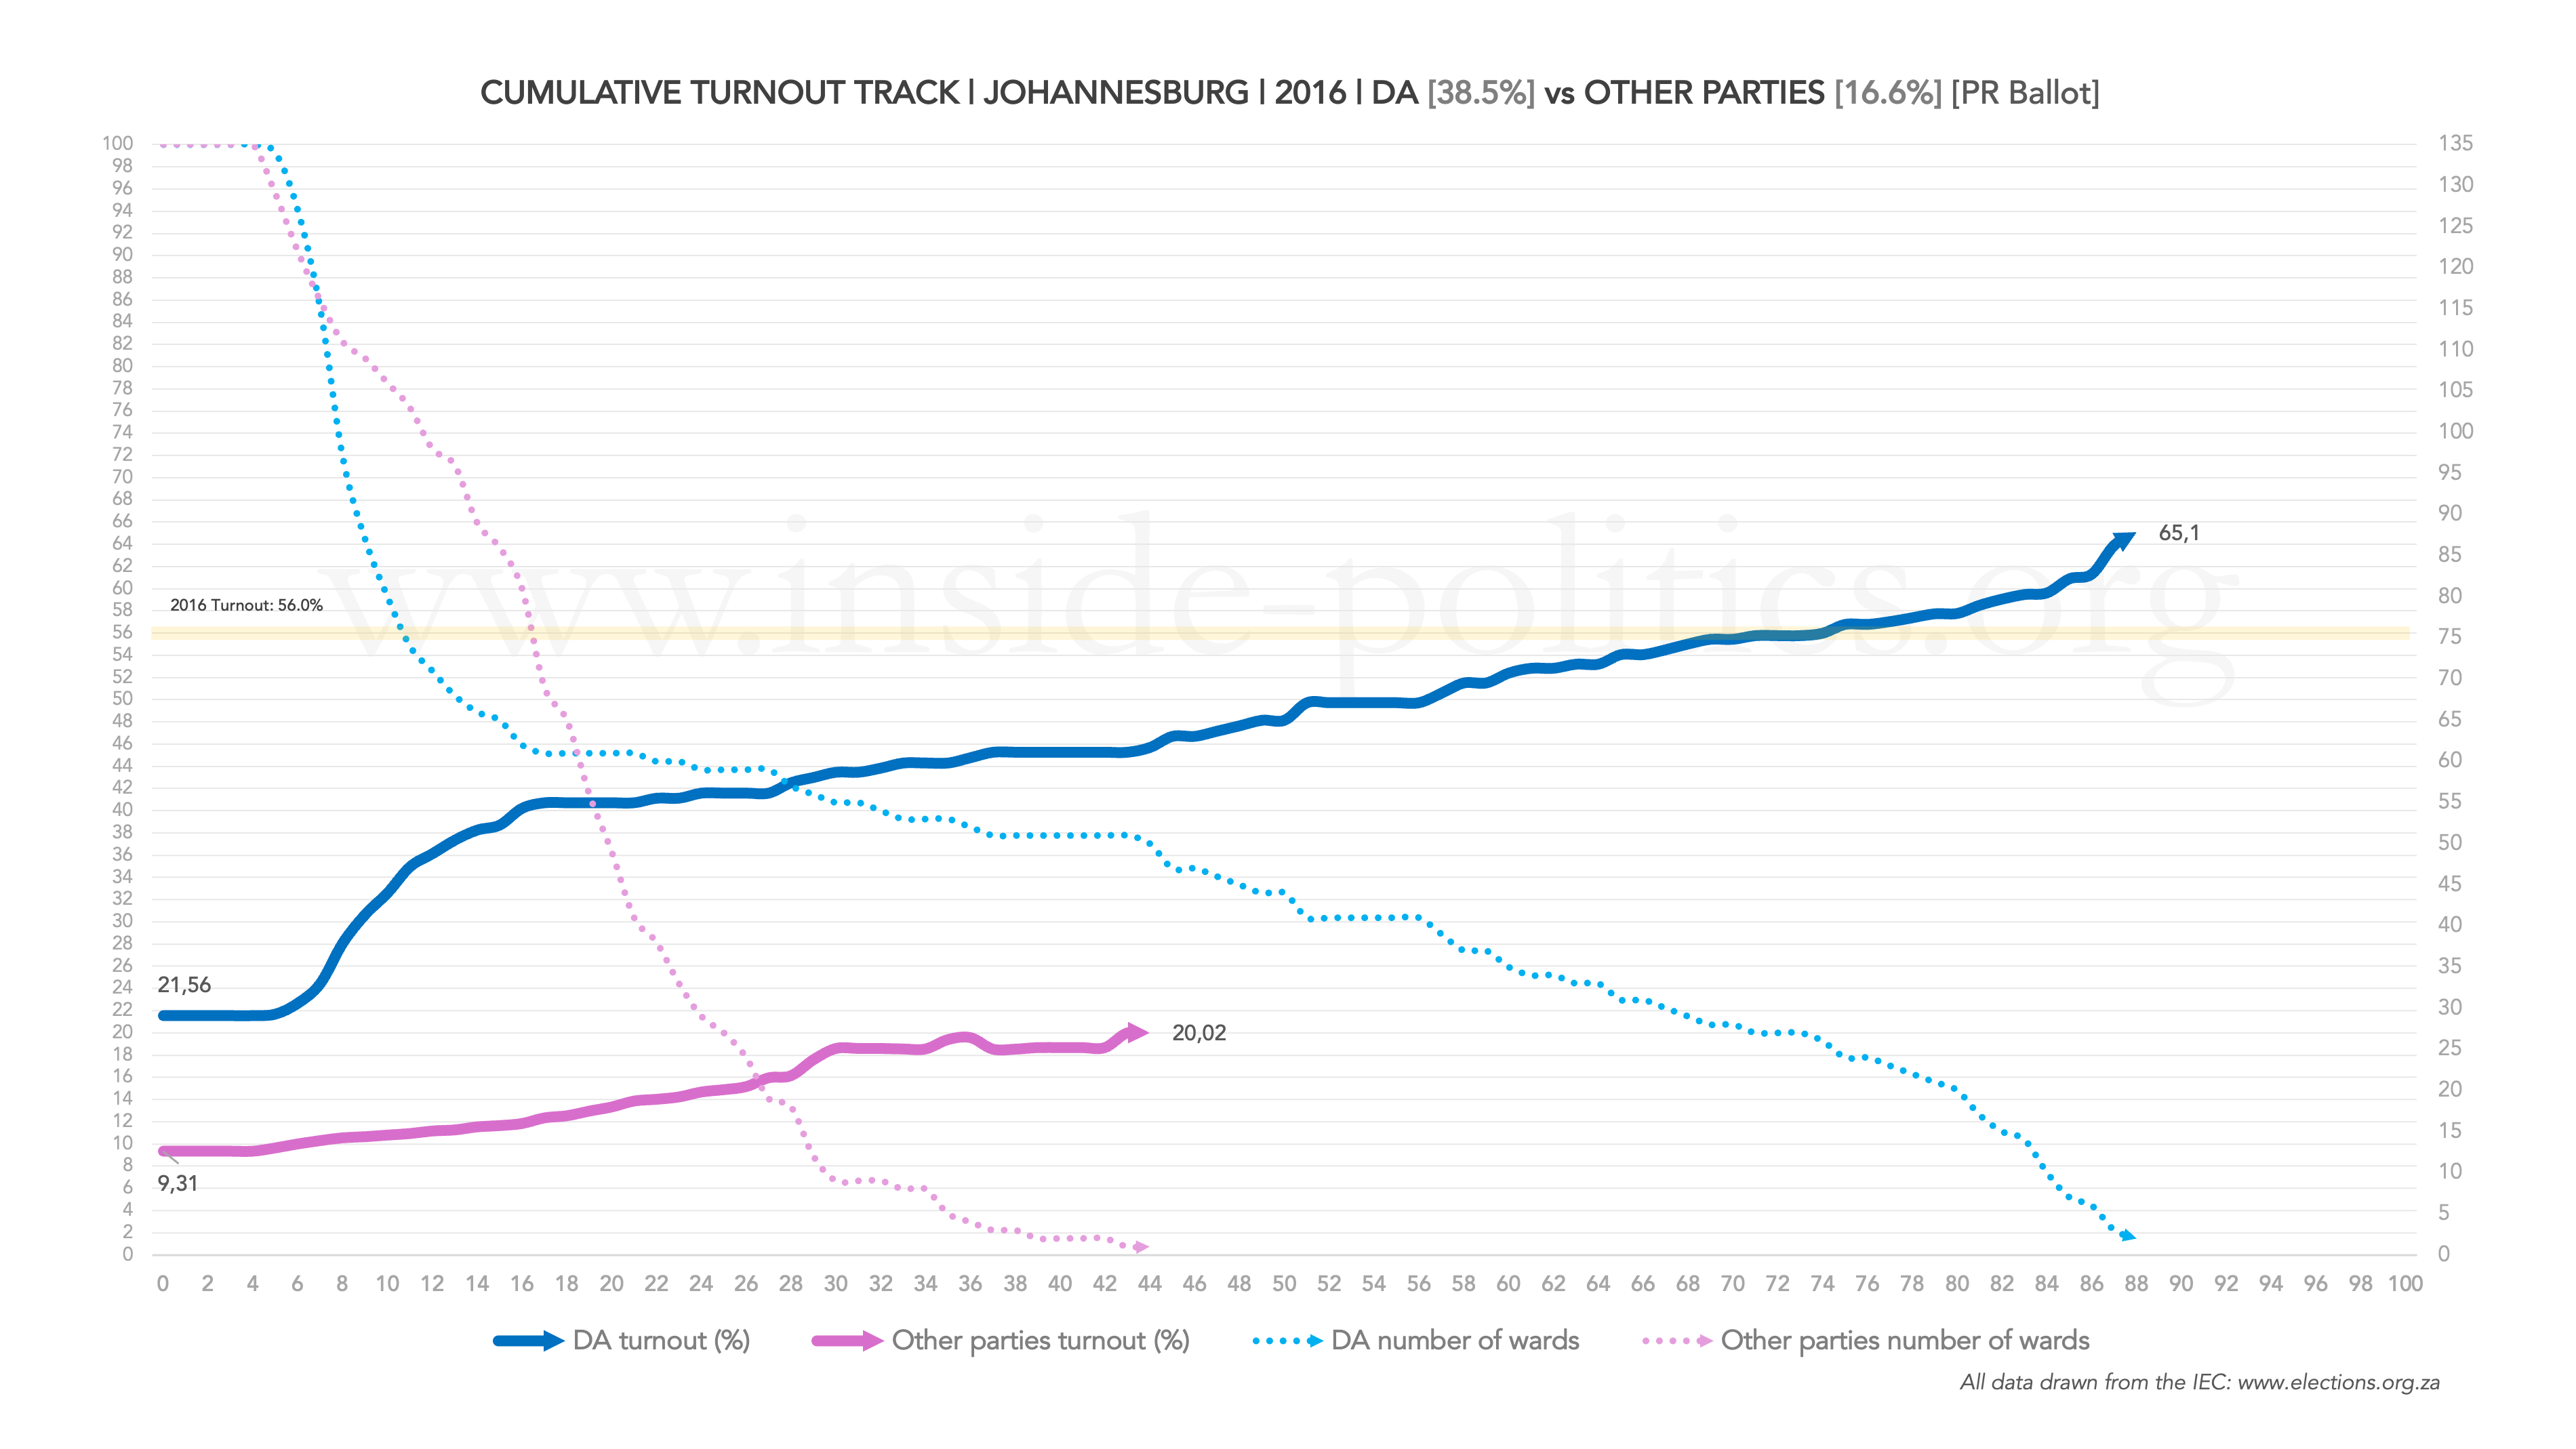
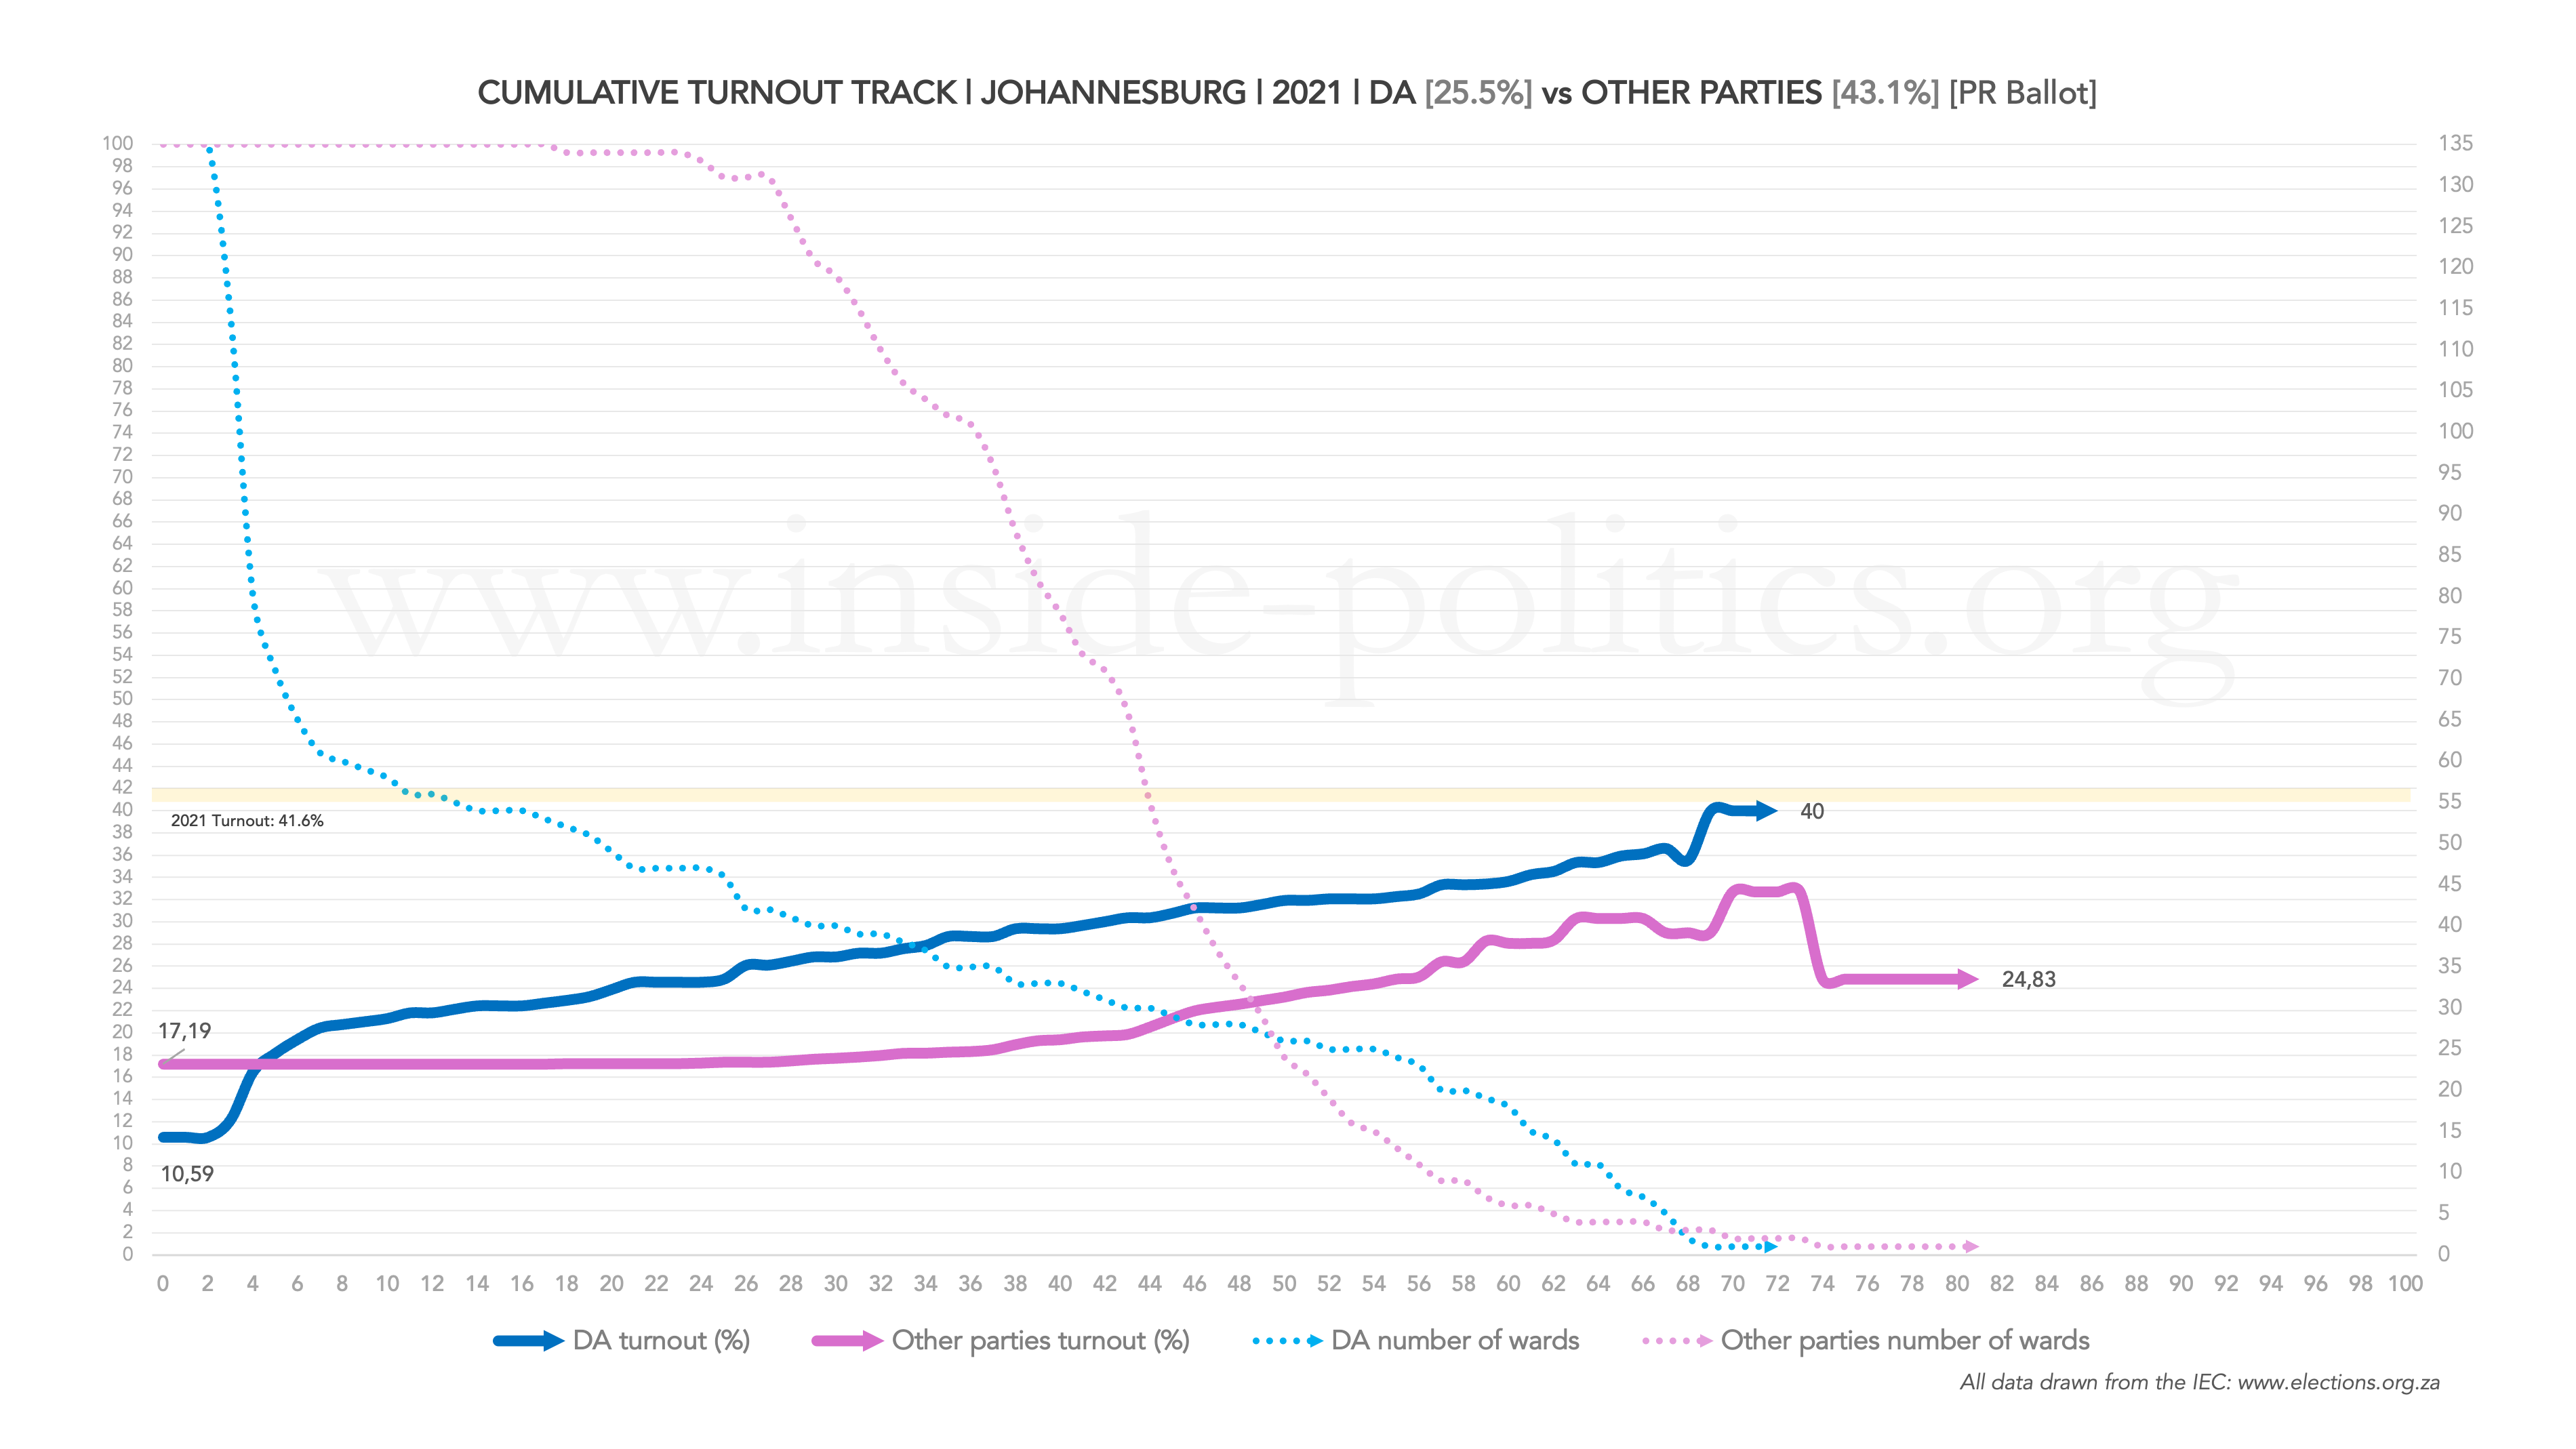
One can get swept up in analysing one or other individual party outside the ANC or DA. The truth is, “Other Parties”, as a consolidated whole are, as of 2021, the most powerful force in Gauteng politics. In JHB, they now sit on 41.3% – bigger than the ANC or DA, and their combined turnout, although not quite as steep as the DA, now runs signifciantly deeper than it. It beats the ANC too (not show above). And, it closes in and matches the DA towards the end of the track, meaning the DA struggled to gain any advantage over “Other Parties” in its strongholds.
And here is a fact that really brings this all into stark relief: all of that is before MK.
All of the DA’s positioning with regards what is possible in 2026 more or less ignores this. But it fundamentally changes the equation.
A final scenario
With this in mind, let us produce another possible, and credible scenario: Registration is solid across the board, but not exceptional (+40,000). Turnout drops to 35% but the DA’s ability to generate a powerful differential, both because of a general decline (see 2021) and further party fragmentation, means it is only capable of generating 300,000 votes.
DA Percentage: 36.4%
Conclusion
So, what does this analysis tell us. For starters, the pre-eminent forces in Johannesburg are:
- A dramatic decline in turnout
- A dramatic increase in party fragmentation and support for “Other Parties”
- A dramatic decline in registration (although 2024 does suggest a reversion to more normal patterns, they are still below average)
With regards to the DA in Johannesburg:
- Its ability to generate a differential turnout is in decline
- Its vote share is in decline
In order to achieve its goals, it needs to do the following:
- Have an exceptional registration period
- Dramatically restore its turnout differential
- Nullify or reverse the effect of fragmentation and the impact of “Other Parties”
These are all possible, but incredibly difficult to do. It would require the fundamental nature of Johannesburg politics to switch direction.
But, the DA does have some things in its favour:
- Helen Zille can reinvigorate its core support base
- Registration will improve
- The ANC’s decline is likely to continue
Seen together, all of this suggests 500,000 is a bridge too far, as is 50%. Even if you apply the DA’s 2016 turnout levels directly to the current registered voters count per ward in JHB, it gets only 40%. Instead, it is 400,000 votes that would constitute an exceptional performance.
As for 50%, it is very difficult to generate a realistic scenario, that delivers that percentage. To do so, as our consolidated sheet of 50% outcomes suggests, the DA would have to deliver a staggeringly good differential turnout that alone is so powerful, it keeps the general turnout level at where it was in 2021, and gives the party both 400,000 votes and 50%.
Which ever way you look at it, what the DA needs for 50%, is not just to shoot the lights outs itself, but for every other party in JHB to fail profoundly in every respect (registration, turnout and vote share). It needs both things, and so to a certain extent 50% is out of its hands regardless.
So many forces are against that happening though, that it seems a more realistic scenario is the mid 30% range.
Finally, a couple of caveats. First, Helen Zille and the DA’s job is to be aspirational, and to set aspirational targets. It is true, you can overextend yourself in this regard, but for the DA to do well it needs to inspire, and to inspire it needs to give its voters something to aim for. So this is not a critique of the DA’s target (although Zille does say she “expects” a million votes?).
To this end, it is also worth saying that a mid 30% result is by no means a bad performance. 38.5% is its all time high, after all.
Second, you need to appreciate that it is early days. Once registration is complete later this year, and the voters’ roll is locked, we can run all of this again, and be far, far more precise. So really, this is an exercise in testing the general parameters of the DA’s goals and, the great news is, if you disagree with any of the assumptions I have made – which are all my own – you can use the turnout models to look up whatever you think is a more realistic set of parameters.
This essay is the 13th in an on-going series on Election 2026/7, for all other editions of this series, please click here: Election 2026/7
Discover more from inside politics
Subscribe to get the latest posts sent to your email.

Hi Gareth, this is good stuff! However, I’m not much of a numbers person…. so can you clarify: are you saying the DA needs 400,000 votes to get to 47,7%? Am I reading that right?