
Election 2026/7 Resource: By-Election Track | Standard Model | DA Support | By Cycle
by The Editor
Election 2026/7 Resource: By-Election Track | DA Support | By Cycle
Explanation:
These are Standard Model “By-Election Tracks”, and they form part of the consolidated By-Election Track.
By-elections run in cycles, between local government elections (LGEs). To date, there have been five cycles:
- 2000 Cycle [28 February 2001 to 12 October 2005]
- 2006 Cycle [7 June 2006 to 19 January 2011]
- 2011 Cycle [7 September 2011 to 16 March 2016]
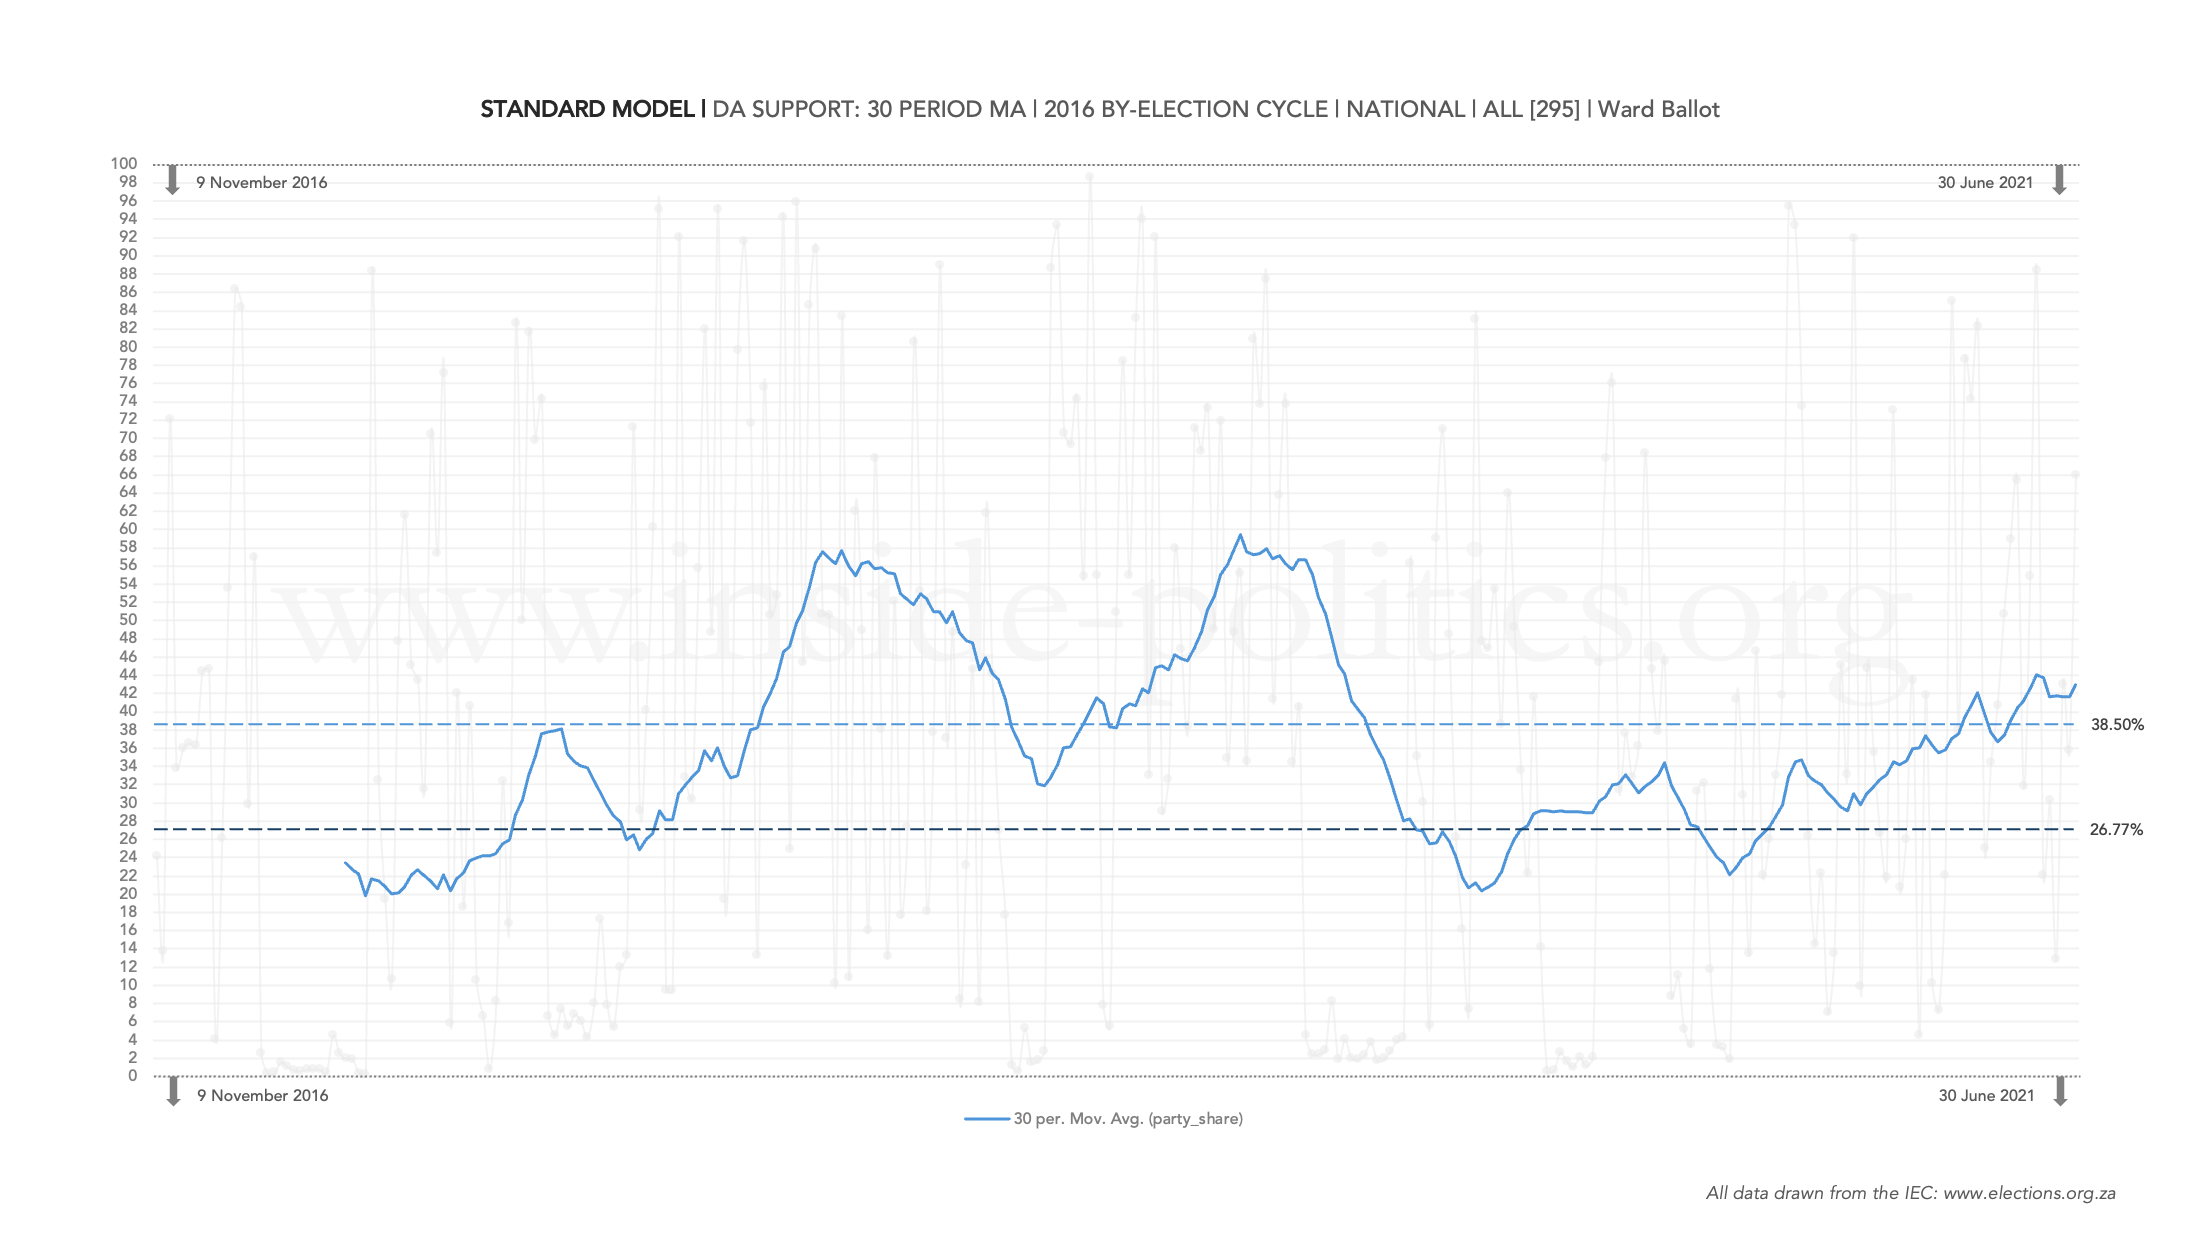
- 2016 Cycle [9 November 2016 to 30 June 2021]
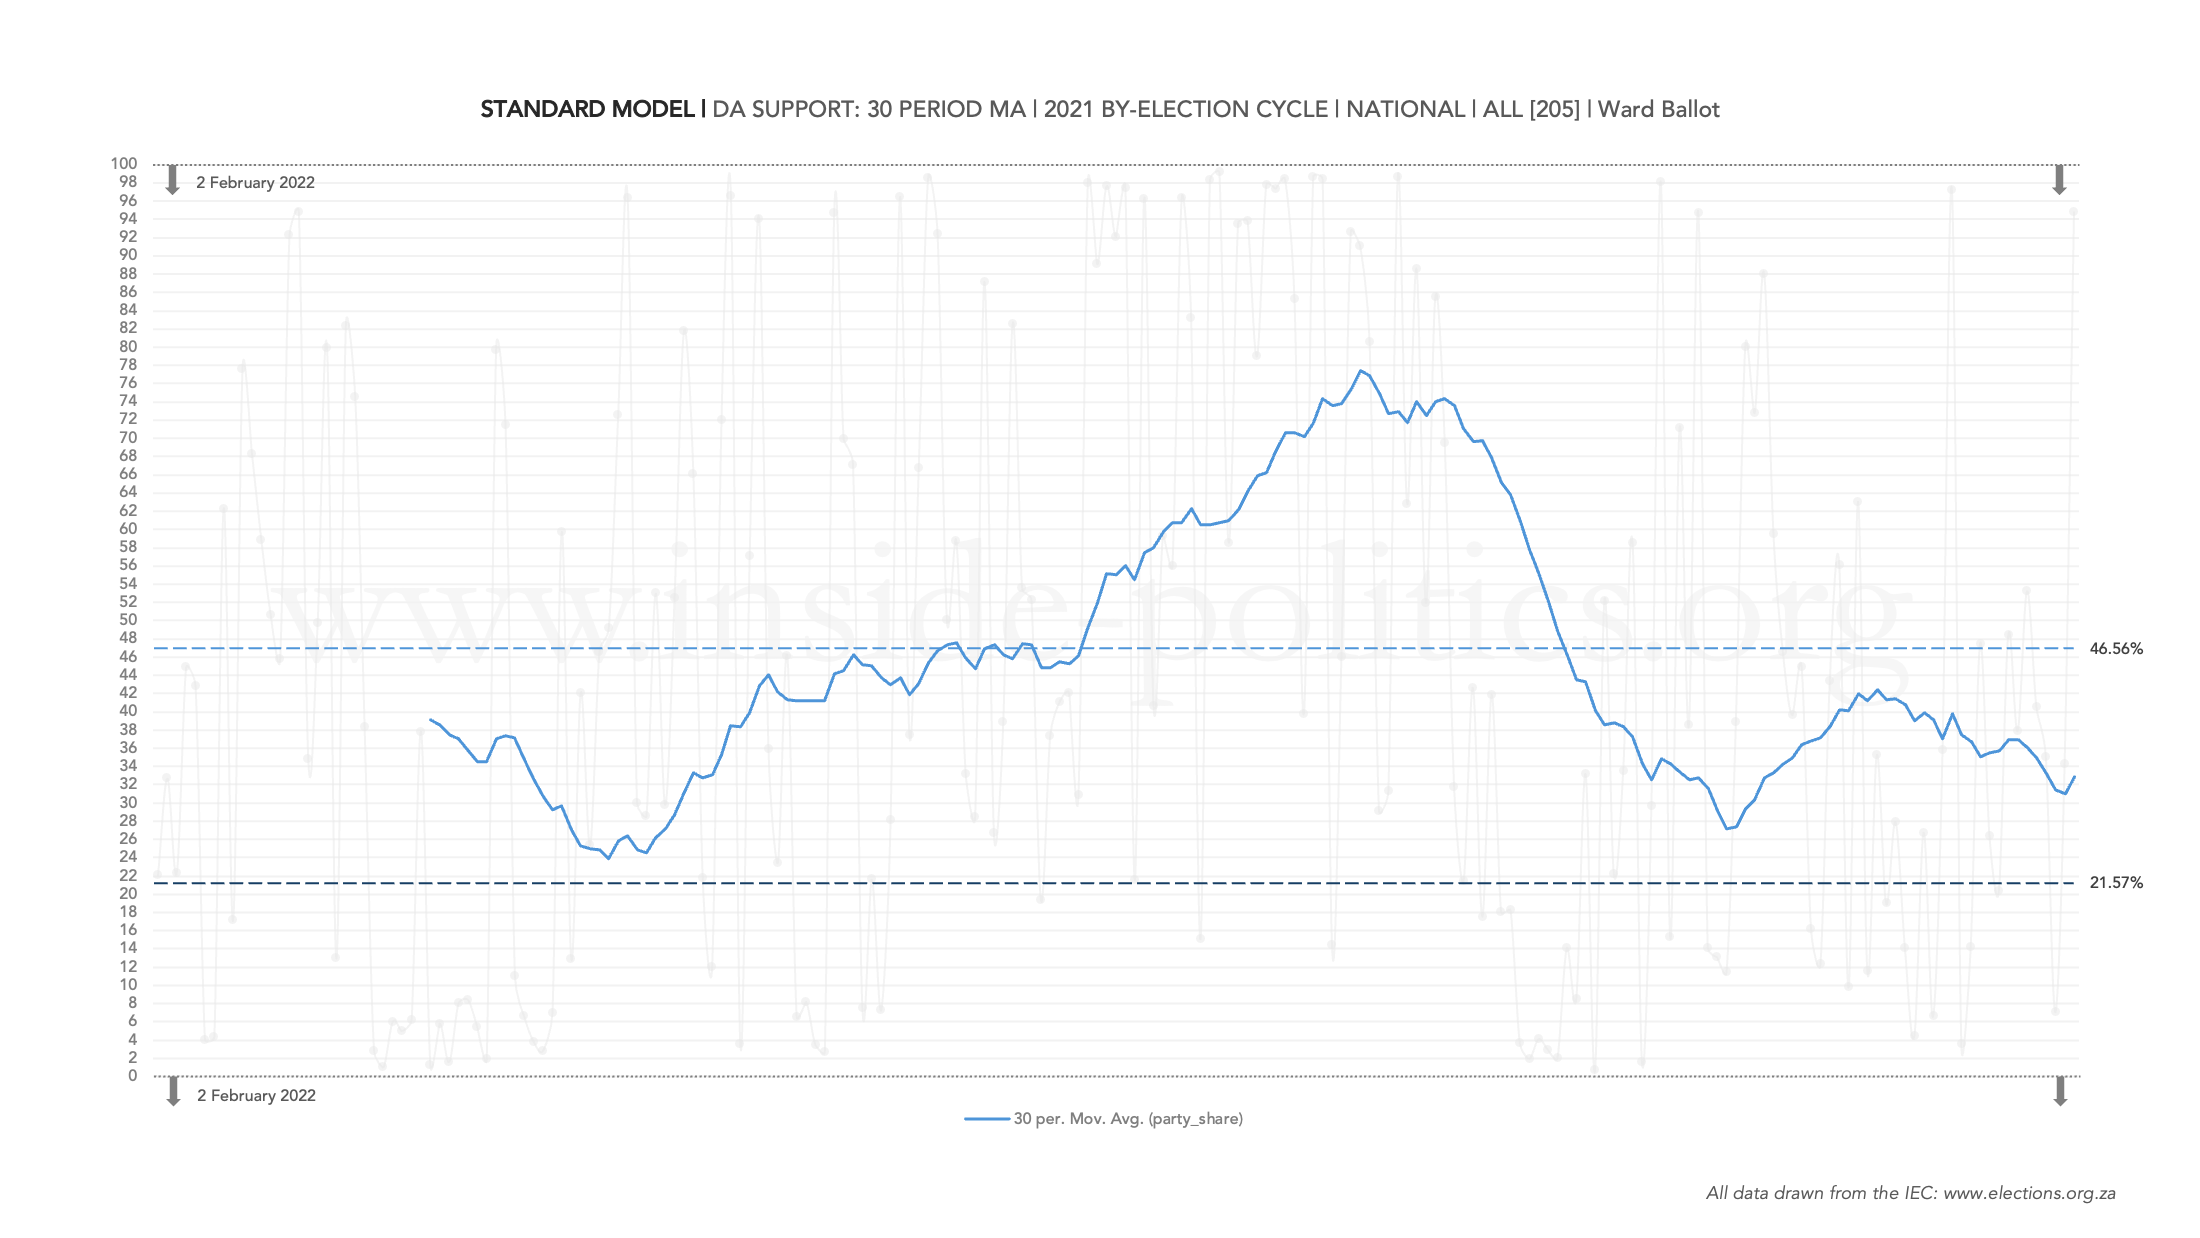
- 2021 Cycle [2 February 2022 to Present]
A standard model tracks support for either the ANC, DA or EFF per cycle (you can see this faded in the background). But the core indicator is the moving average – the solid visible line, which is set at 30 periods.
A 30 period moving average means every dot constitutes the average support level for the last 30 by-elections. As you move from one by-election to the next, from left to right, the latest by-election moves into the 30 period bank, the oldest one drops out, and a new average is calculated. This is a good statistical way of smoothing out the graph, while capturing the effect of every by-election.
The by-election move chronologically from left to right, however, as by-elections happen in clusters (a number on the same day), the graph ignores this and gives each by-election a standard spacing of 1. This is not a serious analytical problem. It is true, current affairs do impact by-election support but never immediately and so a general sense of time is perfectly sufficient. And each by-election is a self contained universe, worthy of its own dot.
Regardless, by-election tracks are most valuable for trends, not precise points of comparison.
The light dash-line represents the party’s average support level for the cycle. The dark dash-line represents the party’s support level in the previous LGE (on the ward ballot).
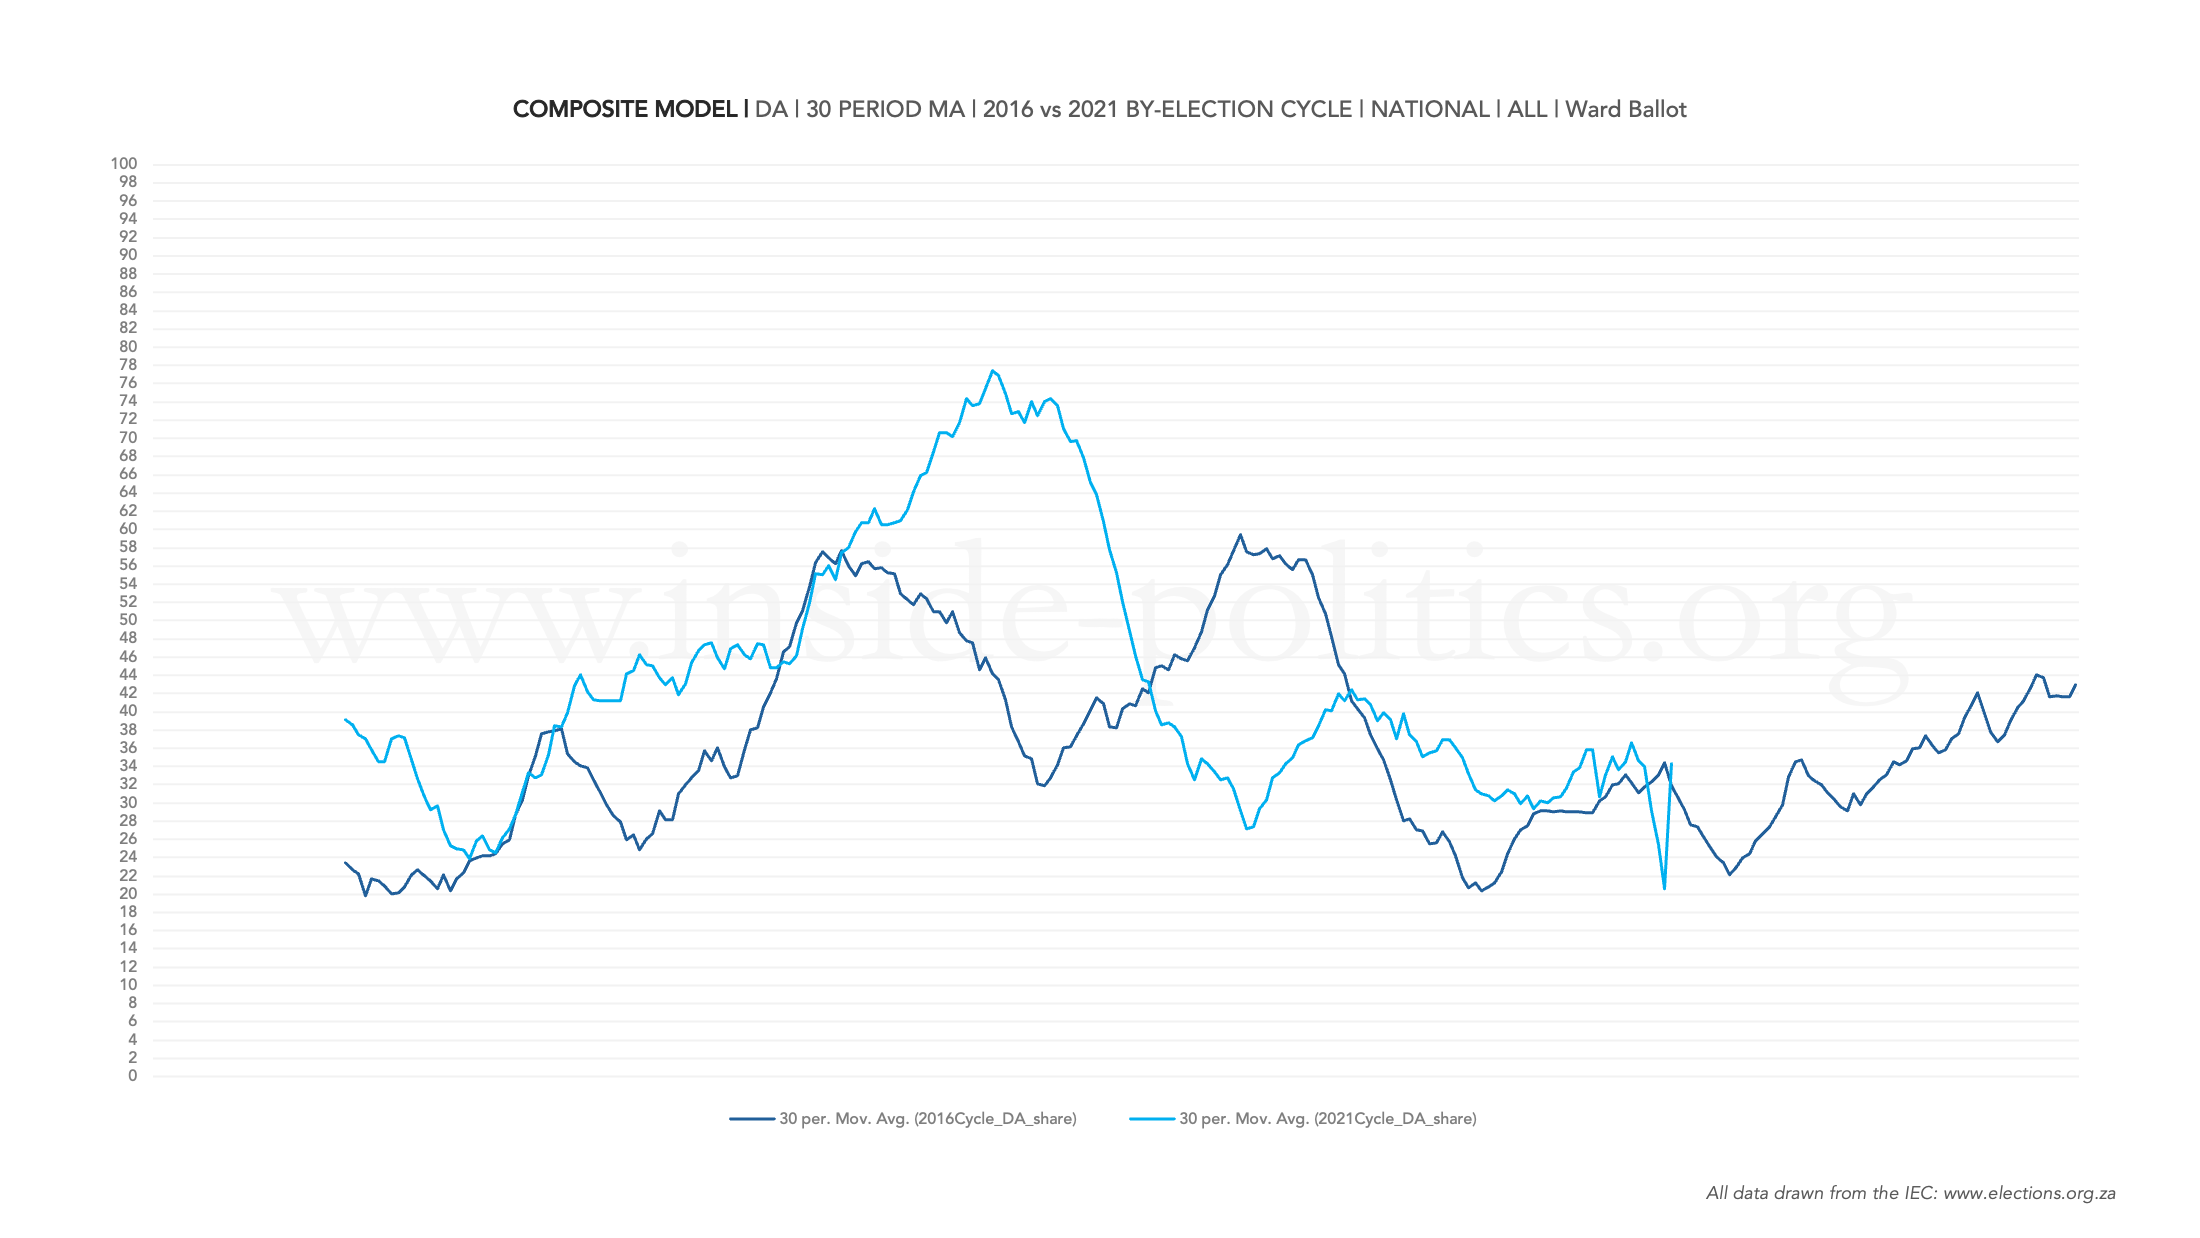
The Composite Model, at the end, stacks the Standard Models, so you can compare the two cycles on one graph.
Two cycles are currently fully captured [2016 and 2021]. More will be added with time.
Standard Model: DA Support | 2016 Election Cycle
Standard Model: DA Support | 2021 Election Cycle
Composite Model: DA Support | 2016 and 2021 Cycles
Discover more from inside politics
Subscribe to get the latest posts sent to your email.

You must be logged in to post a comment.