
Election 2026/7 Resource: By-Election Track | Standard Model | Turnout | By Cycle
by The Editor
Election 2026/7 Resource: By-Election Track | Turnout | By Cycle
Explanation:
These are Standard Model “By-Election Tracks”, and they form part of the consolidated By-Election Track.
By-elections run in cycles, between local government elections (LGEs). To date, there have been five cycles:
- 2000 Cycle [28 February 2001 to 12 October 2005]
- 2006 Cycle [7 June 2006 to 19 January 2011]
- 2011 Cycle [7 September 2011 to 16 March 2016]
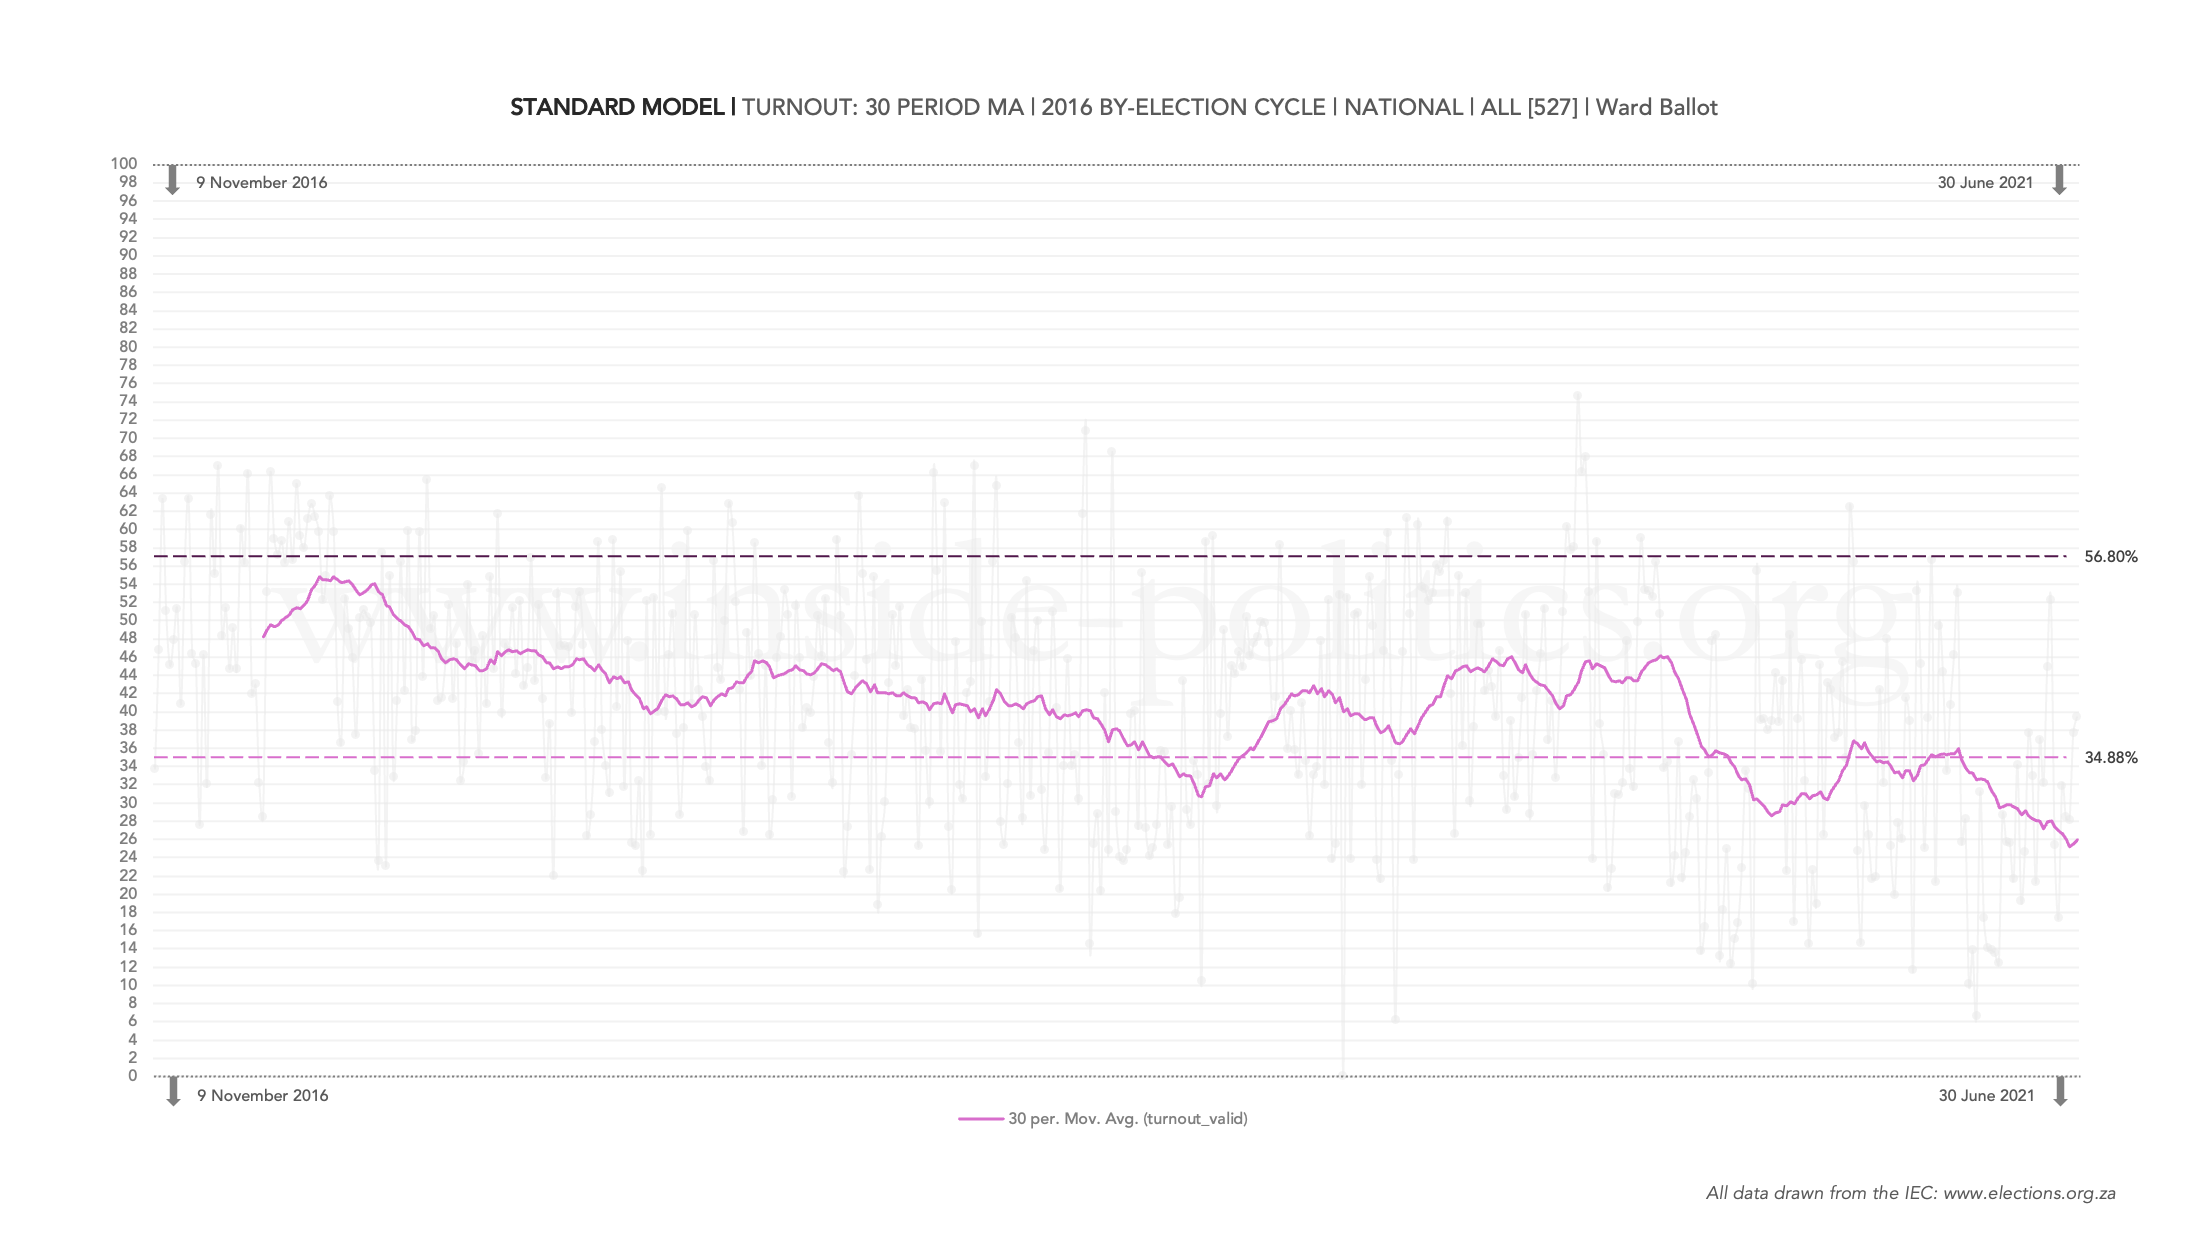
- 2016 Cycle [9 November 2016 to 30 June 2021]
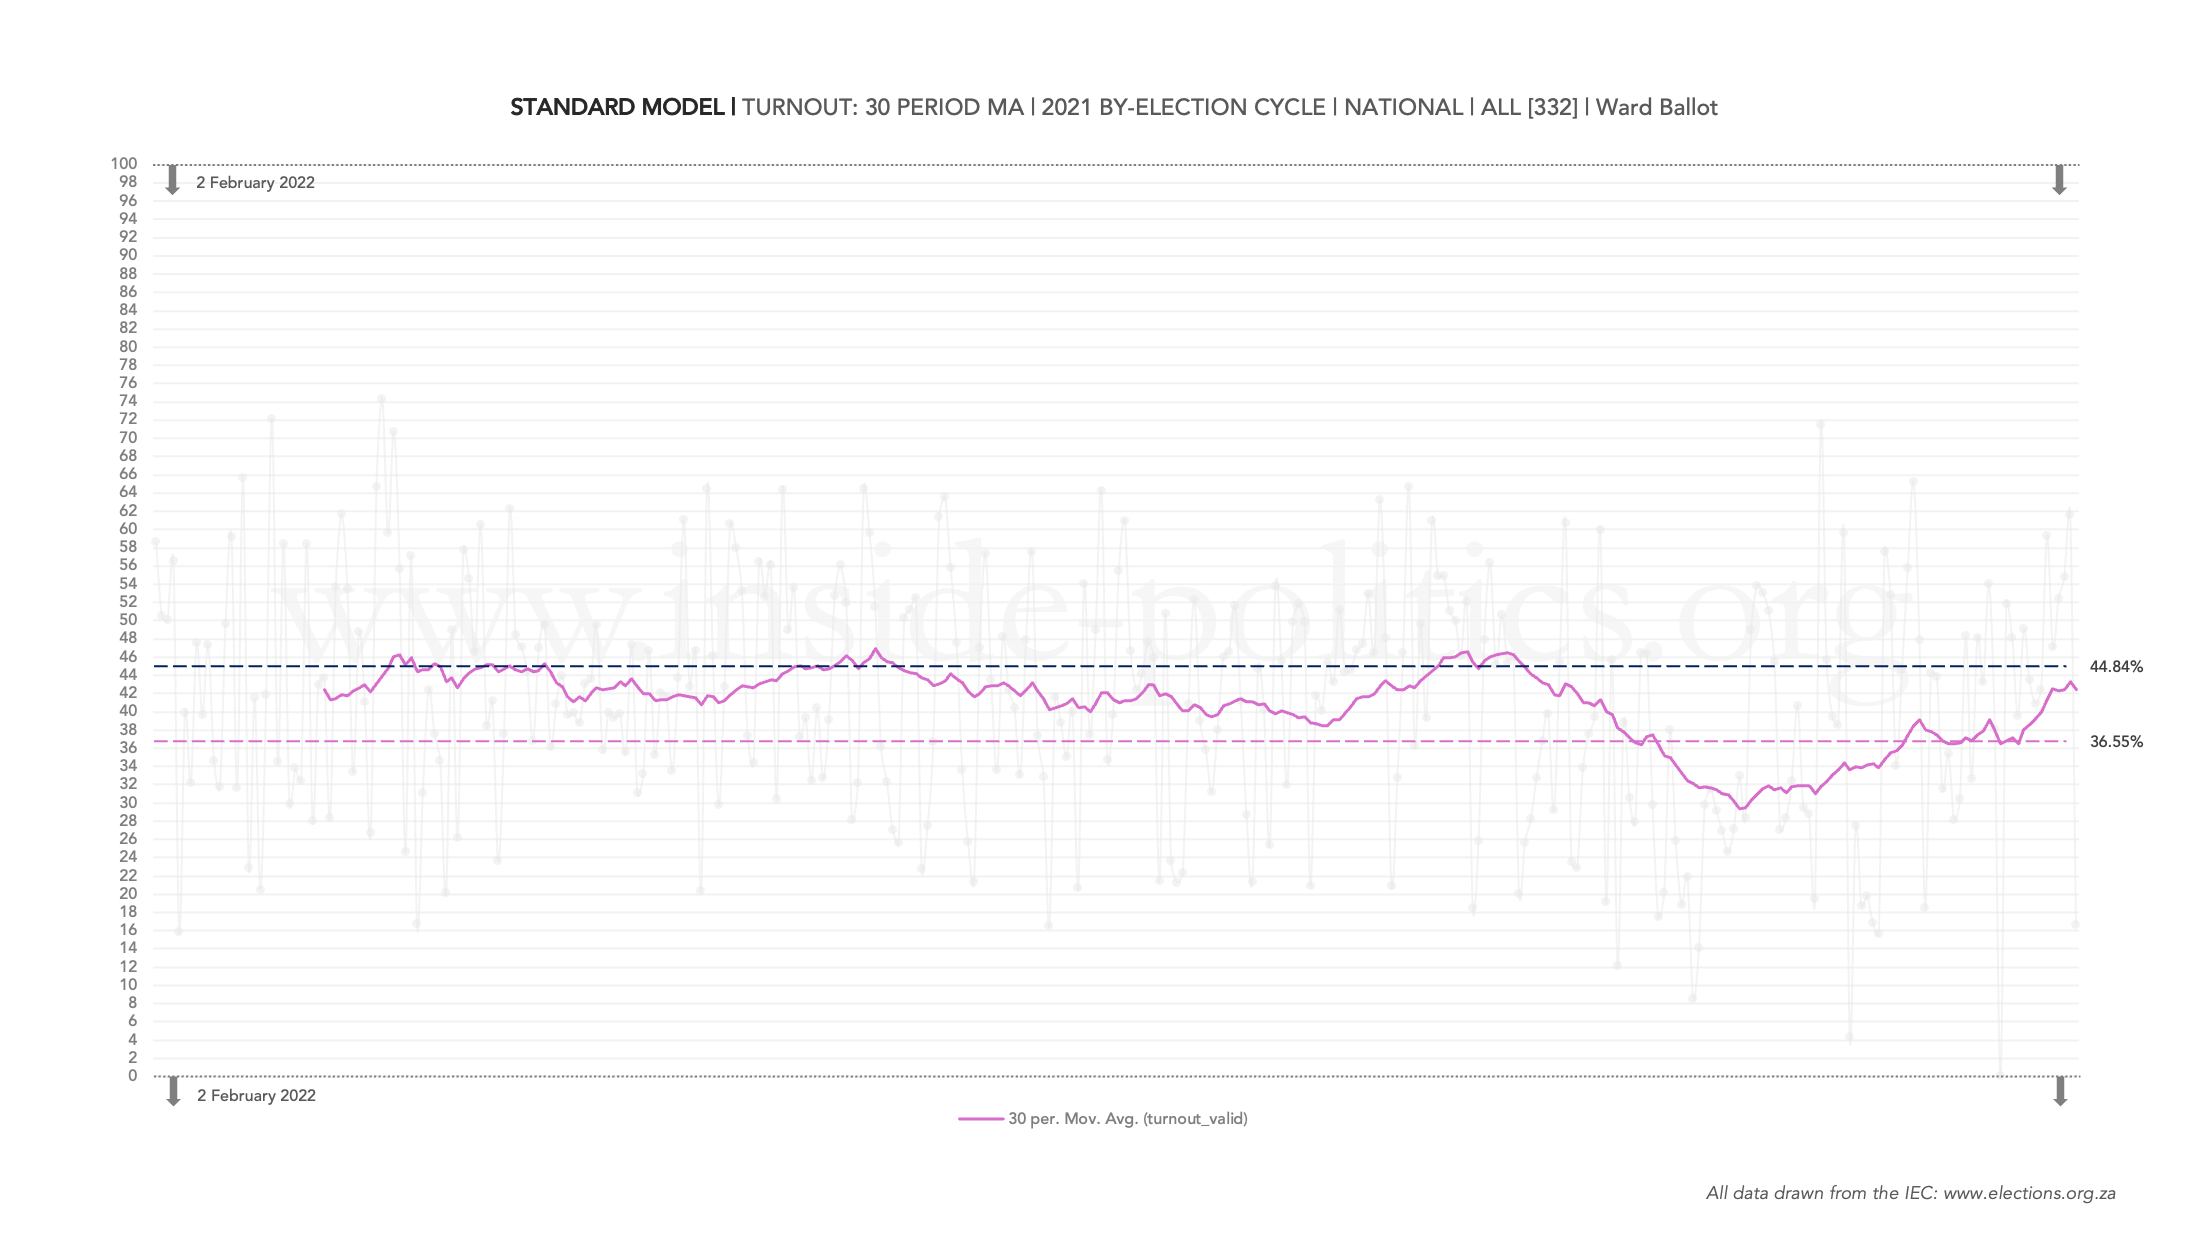
- 2021 Cycle [2 February 2022 to Present]
A standard model tracks turnout for each by-election, per cycle (you can see this faded in the background). But the core indicator is the moving average – the solid visible line, which is set at 30 periods.
A 30 period moving average means every dot constitutes the average turnout level for the last 30 by-elections. As you move from one by-election to the next, from left to right, the latest by-election moves into the 30 period bank, the oldest one drops out, and a new average is calculated. This is a good statistical way of smoothing out the graph, while capturing the effect of every by-election.
The by-election move chronologically from left to right, however, as by-elections happen in clusters (a number on the same day), the graph ignores this and gives each by-election a standard spacing of 1. This is not a serious analytical problem. It is true, current affairs do impact by-election support but never immediately and so a general sense of time is perfectly sufficient. And each by-election is a self contained universe, worthy of its own dot.
Regardless, by-election tracks are most valuable for trends, not precise points of comparison.
The light dash-line represents the average turnout level for the cycle. The dark dash-line represents the turnout level in the previous LGE (on the ward ballot).
Two cycles are currently fully captured [2016 and 2021]. More will be added with time.
Standard Model: Turnout | 2016 Election Cycle
Standard Model: Turnout | 2021 Election Cycle
Discover more from inside politics
Subscribe to get the latest posts sent to your email.

You must be logged in to post a comment.