
Election 2026/7 [18] A guide to the By-Election Track
by The Editor

A brief guide to the By-Election Track: how it works, what it contains and some insights that can be gleamed from its first iteration.
A guide to the By-Election Track
By: Gareth van Onselen
Follow @GvanOnselen
17 March 2026
This essay is the 18th in an on-going series on Election 2026/7, for all other editions of this series, please click here: Election 2026/7
Introduction
The By-Election Track is up and running. This is a guide to how it works and some insights that can be drawn from it.
By-elections run in cycles, between local government elections (LGEs). To date, there have been five cycles:
- 2000 Cycle [28 February 2001 to 12 October 2005]
- 2006 Cycle [7 June 2006 to 19 January 2011]
- 2011 Cycle [7 September 2011 to 16 March 2016]
- 2016 Cycle [9 November 2016 to 30 June 2021]
- 2021 Cycle [2 February 2022 to Present]
The Track has all the data for the 2016 cycle (527 by-elections) and the 2021 cycle (414 by-elections to date) for a total of 941 data points (or individual by-elections captured).
With time I will aim to capture the outstanding cycles but, as things stand, 2016 and 2021 are a good set of tools. They allow for comparative analysis (current performance vs the 2016 cycle) and contemporary analysis (the 2021 cycle alone).
To do this, there are a range of models that constitute “The Track”. I am not going to set them all out here (they are on the actual Track with a brief description of each) but they can be broadly divided into four categories:
- Models that measure party support
- Models that measure change in party support
- Models that measure turnout
- Models that allow for comparative analysis
The parties
Regards the parties that are tracked: There are five parties that deliver the most value analytically – they are, in order, the ANC, EFF, DA, IFP and MK.
The reason for this order is the number of by-elections each of these parties contest.
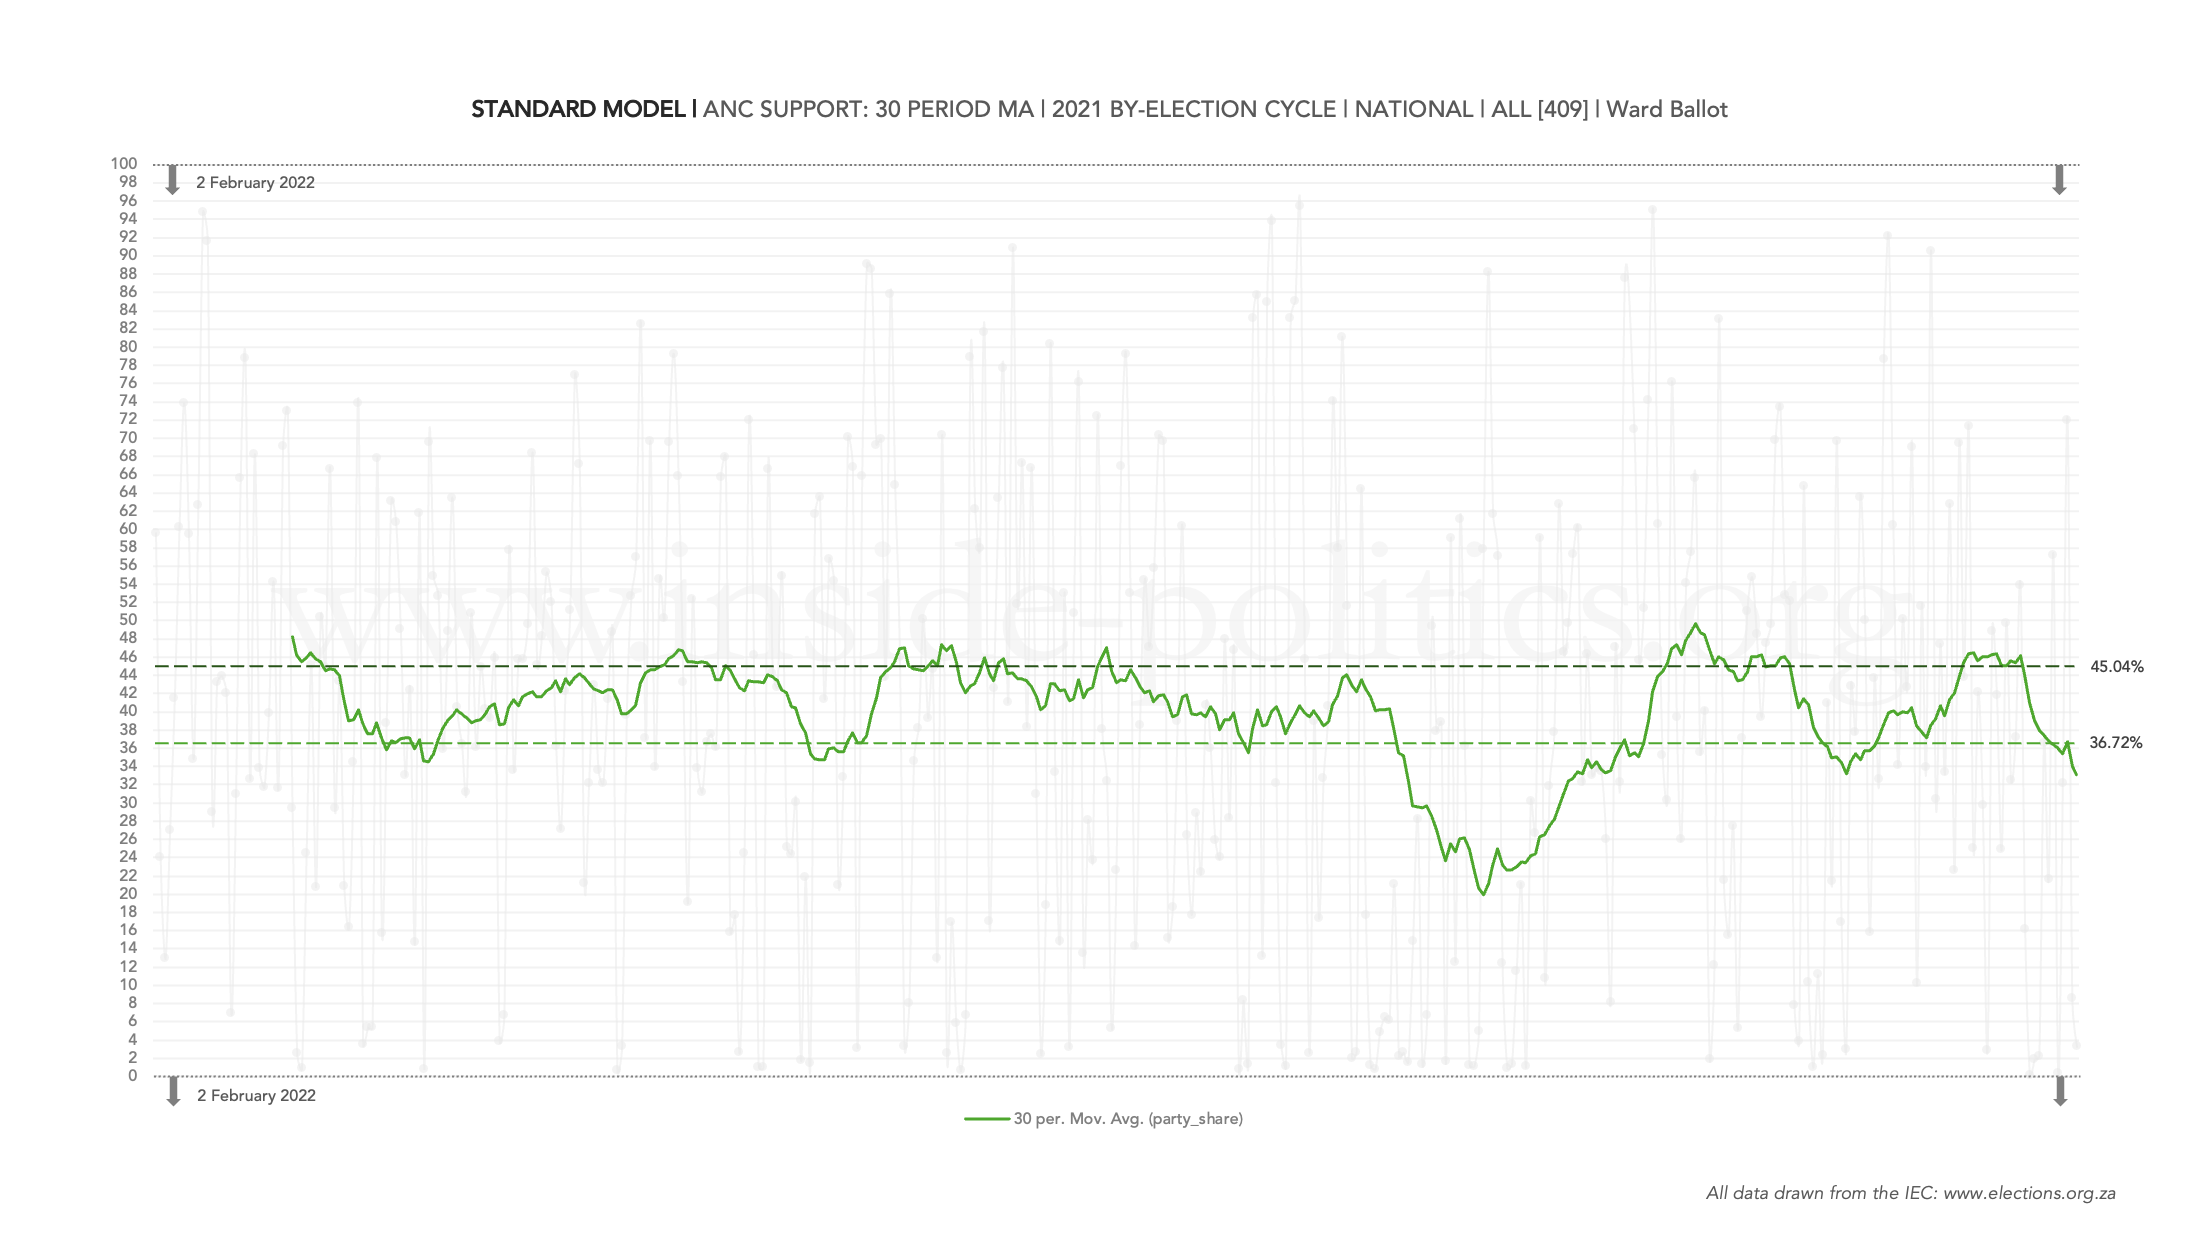
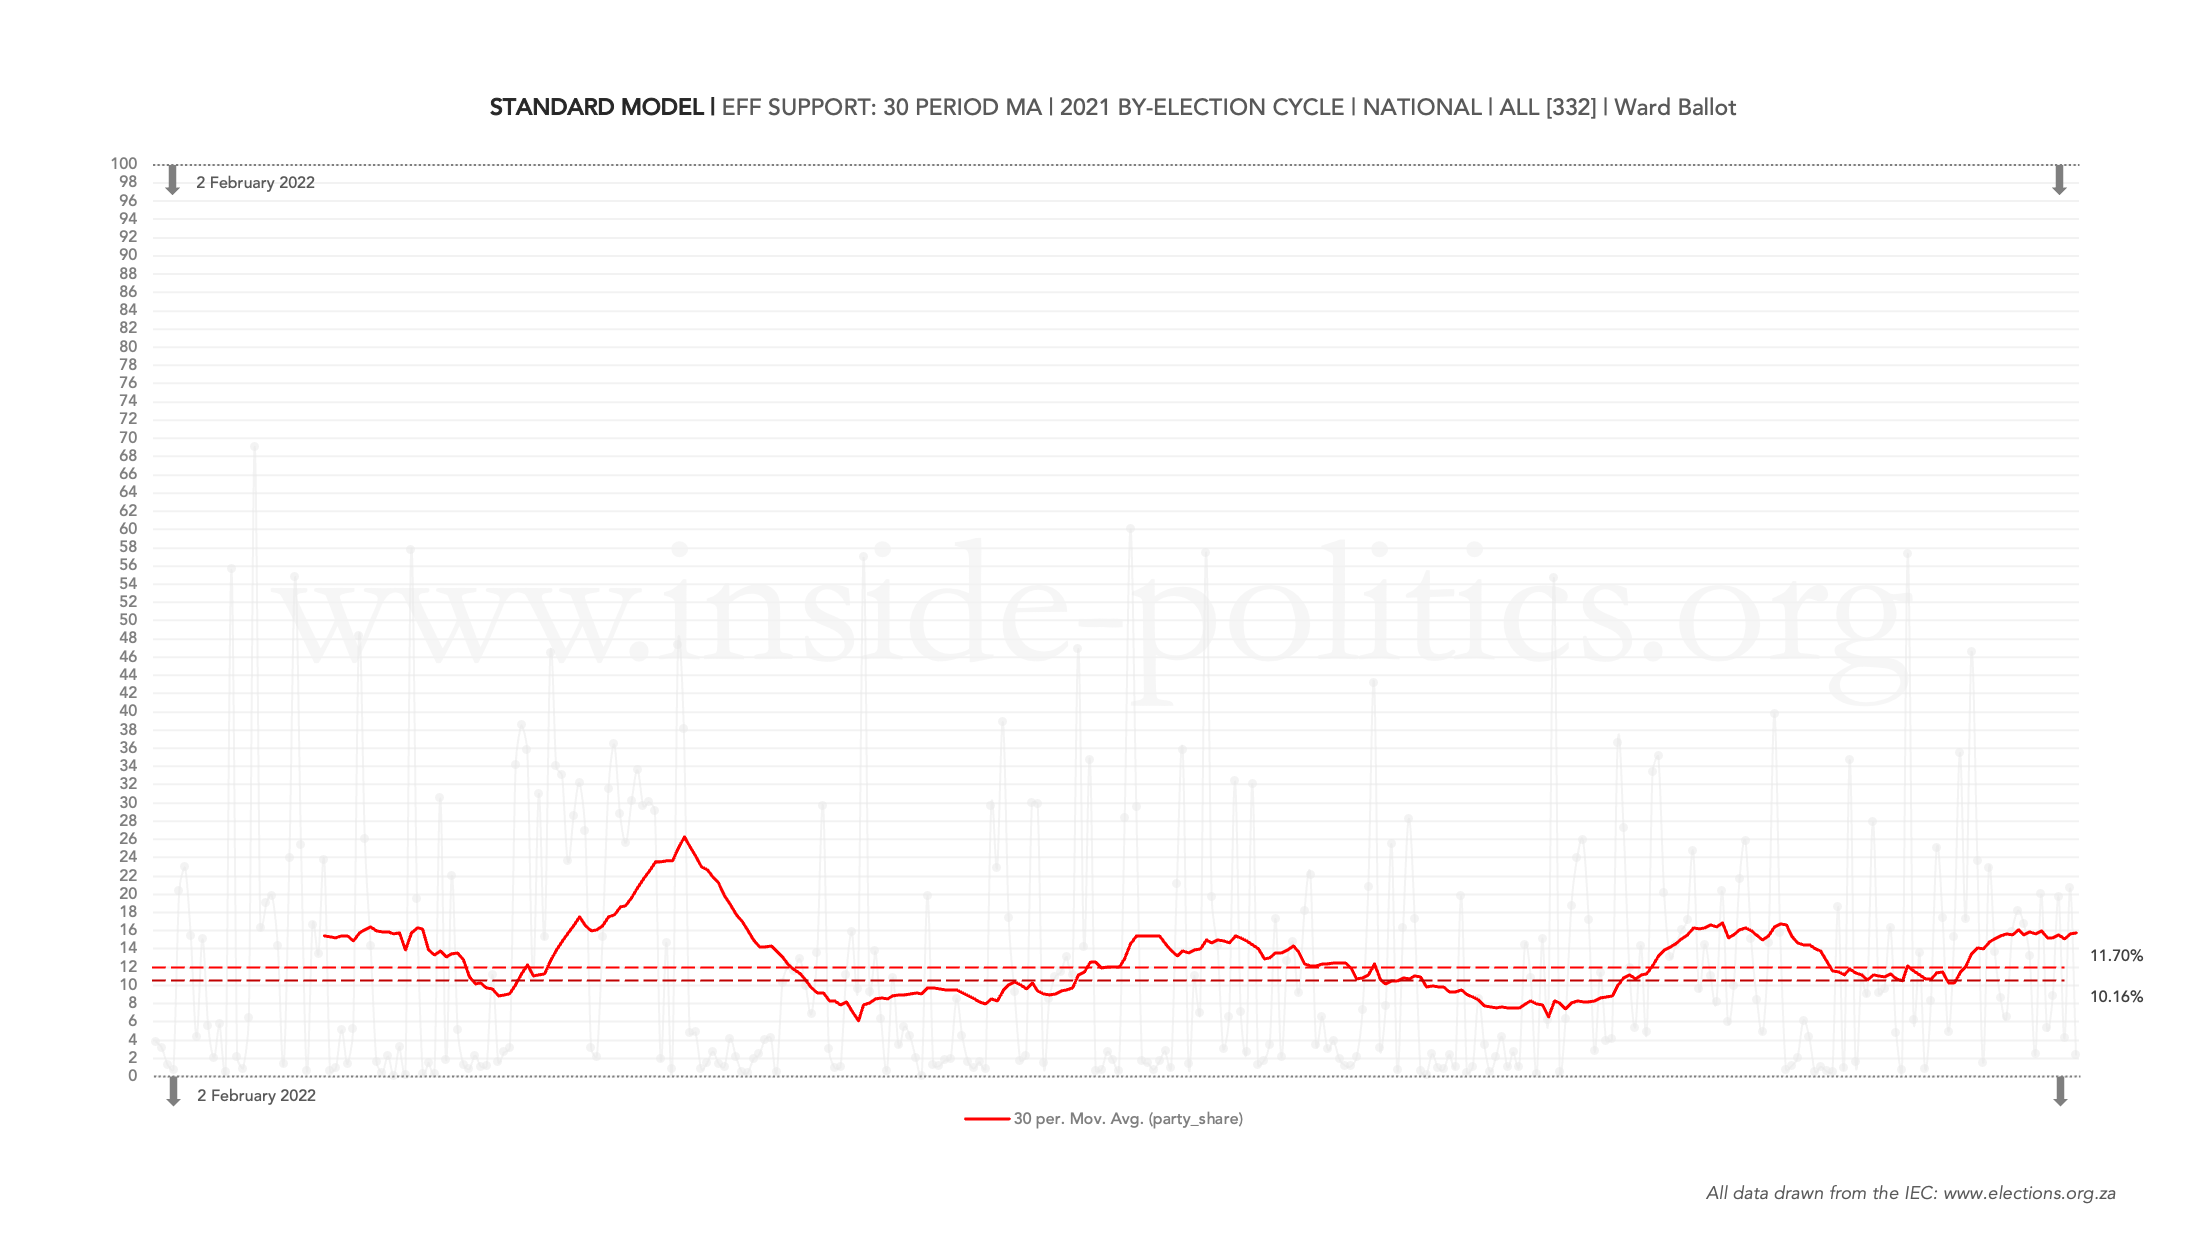
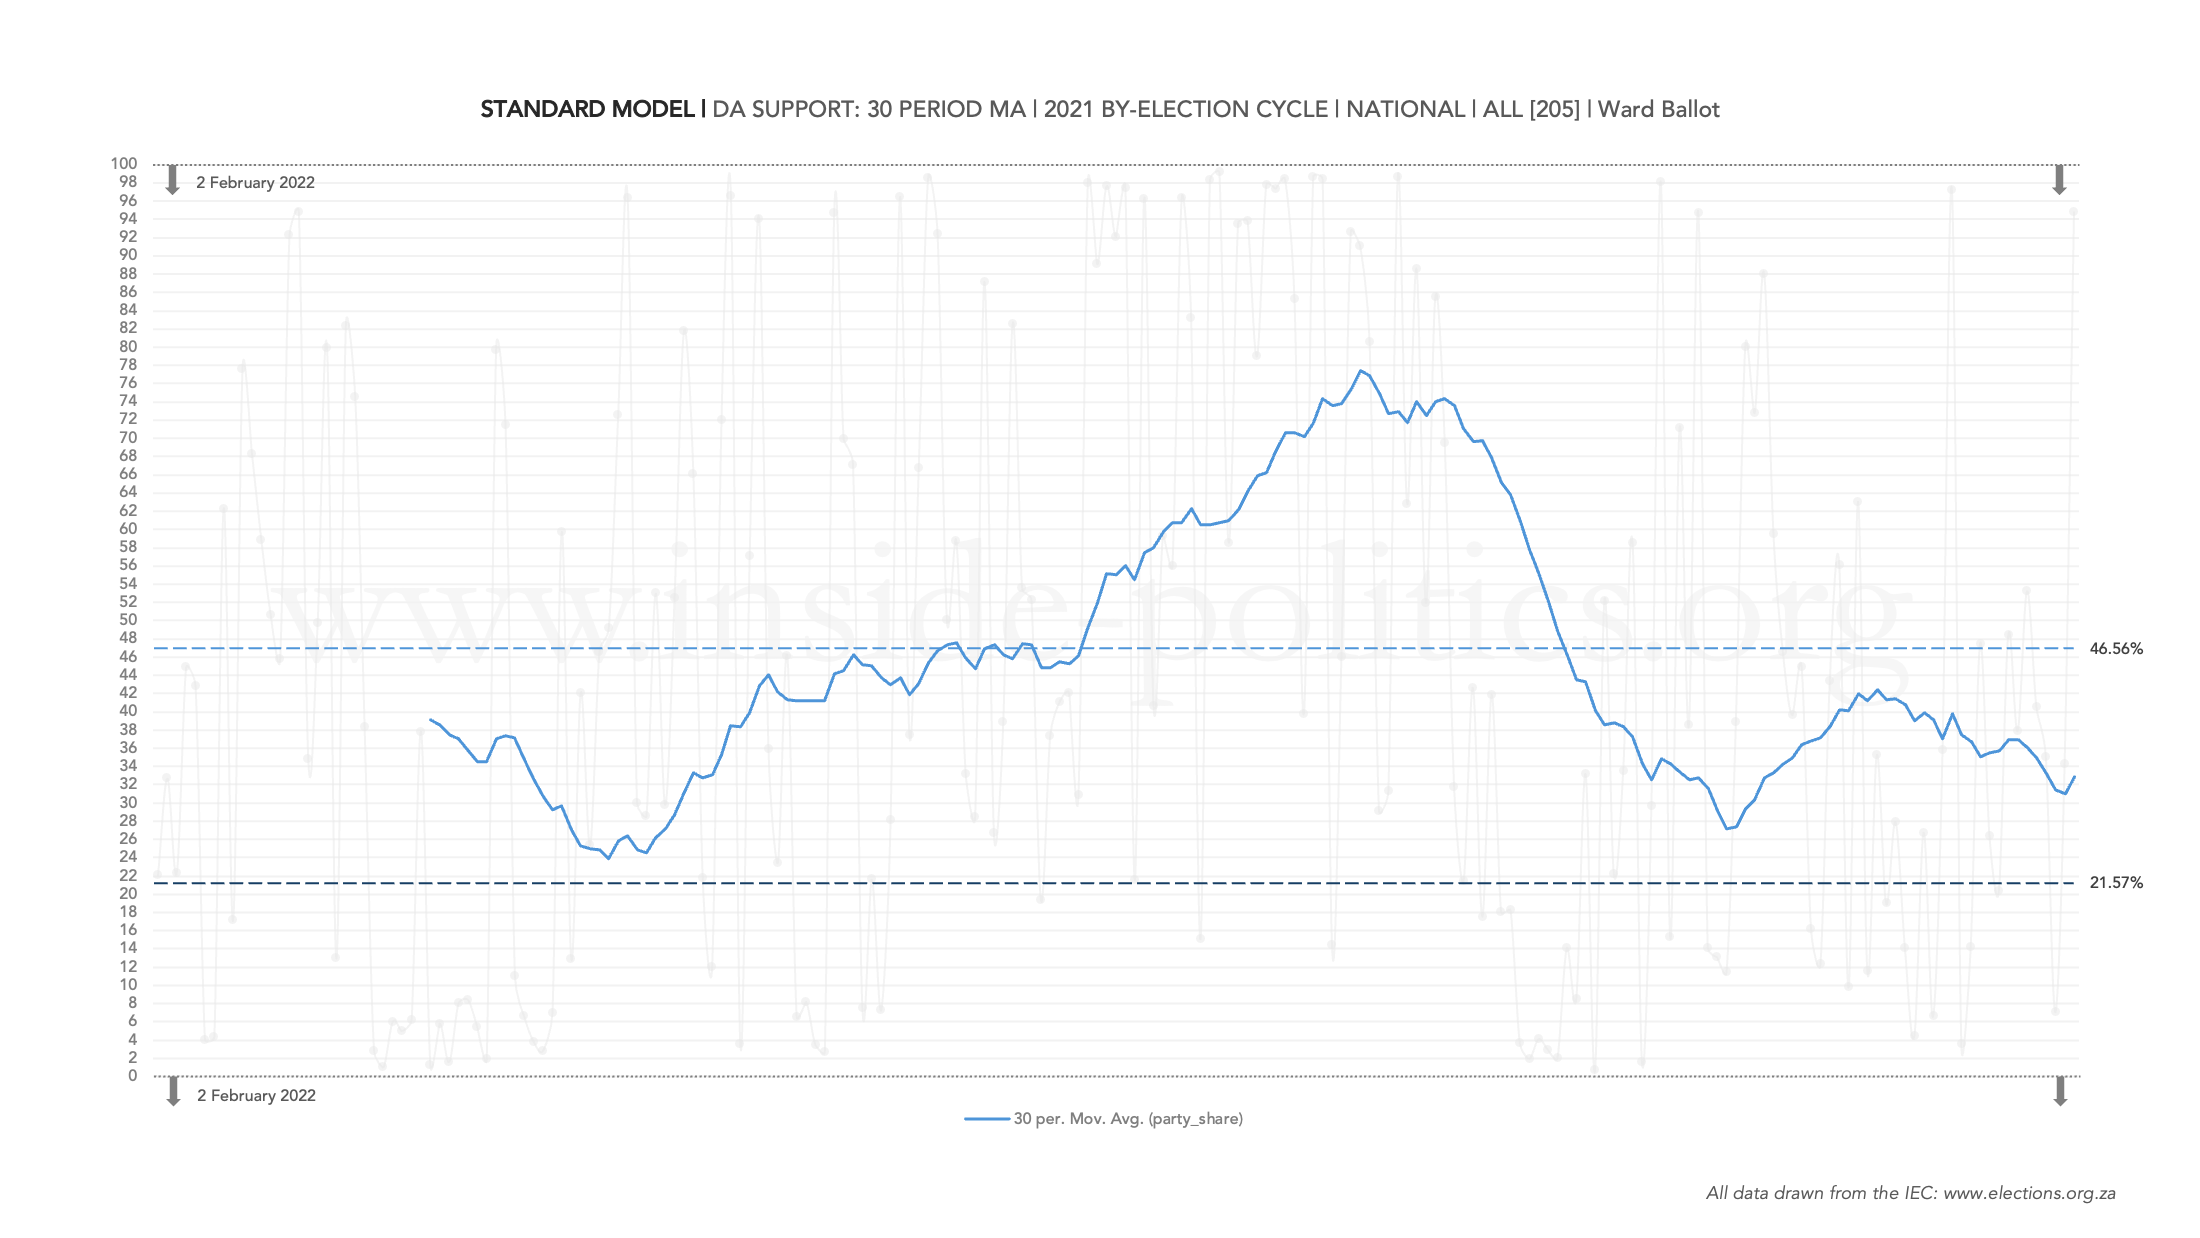
The ANC [contested 409 of 414 by-elections in 2021 cycle] and the EFF [332] are in a league of their own. These two parties contest almost every by-election, regardless of their prospects. The DA contests almost half of all by-elections [205]. The IFP [115] and MK [103] contest around a quarter of all by-elections but, because they are regional parties (KwaZulu-Natal), if you analyse them from a provincial perspective, they contest a very high proportion of those by-elections.
Nationally, however, the ANC and EFF are by some considerable distance the best data points. In fact, they contest so many by-elections, the long terms trends for these two parties closely matches their actual party support levels.
For example, the ANC is currently averaging 36.72% in the 2021 cycle. The SRF has just released a nationally representative survey (n=2,222, MOE: 2.1%) that puts the ANC around 39%. The EFF is currently averaging 11.70% in the 2021 cycle. The SRF has the party around 7%.
Outside of the ANC and EFF, parties become much more selective in which by-elections they contest (typically only those where a party’s prospects of growth are good). So the performance of these parties systematically becomes artificially inflated in their favour.
The DA, for example, is currently averaging 46.56% in the 2021 cycle. The SRF has it around 28%. And the further away you get from these three parties the worse the inflation gets. Small parties, which only contest a handful of by-elections, boast some absurd numbers. The PA for example, is currently averaging 20% in the 2021 cycle, the FF+ 14%. The SRF has them both on 3%.
Now, that is not to say there is no value to be had in analysing the performance of these parties, only the more you move away from the big parties, almost all valuable insights are to be found comparatively.
It is for this reason that smaller parties are excluded from the Track. We will look at them on a case-by-case basis however, down the line.
The timeline and the core indicator
Two final methodological points.
The by-election moves chronologically from left to right, however, as by-elections happen in clusters (a number on the same day), the graph ignores this and gives each by-election a standard spacing of 1. This is not a serious analytical problem. It is true, current affairs do impact by-election support but never immediately and so a general sense of time is perfectly sufficient. And each by-election is a self contained universe, worthy of its own dot.
Finally, the primary line on all graphs. With one or two exceptions, I have used a 30 period moving average.
A 30 period moving average means every dot constitutes the average support level for the last 30 by-elections. As you move from one by-election to the next, from left to right, the latest by-election moves into the 30 period bank, the oldest one drops out, and a new average is calculated. This is a good statistical way of smoothing out the graph, while capturing the effect of every by-election. Without it, the graph is massively volatile and core trends become difficult to distinguish.
Key insights
These are the core takeaways, and in future the track will focus on reporting primarily these sets of numbers. Each indicator is linked to the relevant graphs on the track.
Party support [2021 cycle]
The ANC
- Overall Average: 36.72% [down 10.79pts from the 2016 cycle: 47.51%]
- Average in wards where it is defending: 51.15% [down 11.44pts from the 2016 cycle: 62.59%]
- Average in ward where it is challenging: 18.40% [down 7.56pts from the 2016 cycle: 25.96%]
The DA
- Overall Average: 46.56% [up 8.06pts from the 2016 cycle: 38.50%]
- Average in wards where it is defending: 67.50% [up 8.56pts from the 2016 cycle: 58.96%]
- Average in ward where it is challenging: 19.06% [up 4.71pts from the 2016 cycle: 14.35%]
The EFF
- Overall Average: 11.70% [up 2.04pts from the 2016 cycle: 9.66%]
Change in party support [2021 cycle vs 2021 LGE result]
- Average ANC Swing: -3.19pts [ANC losing about 3.2 points on average vs its 2021 baseline]
- Average DA Swing: +3.95pts [DA gaining about 4 points on average vs its 2021 baseline]
- Average EFF Swing: +2.51pts [EFF gaining about 2.5 points on average vs its 2021 baseline]
Turnout [2021 cycle]
- Average turnout level: 36.55% [up 1.6pts from the 2016 cycle: 34.88%]
Analysis
The greatest insight by-elections can offer is in identifying trends. The ANC is clearly trending downwards, its overall average is down significantly from the 2016 cycle, and that is driven primarily by a decline in those wards where it is defending [down 11.4pts]. So its strongholds are significantly weakening. But it is also failing to win over new support. In wards where it is challenging, it is down too, 7.6pts from the 2016 cycle. There is not much more to say about the ANC, other than it is down. Its tracks are not in a tailspin, just significantly suppressed across the board.
The DA has, to date, had a positive cycle. Its overall average has improved significantly from the 2016 cycle (up 8pts) but that seems to have been driven by a fairly dramatic post GNU high, which has significantly tailored off over the last 12 months, to the point where it is now, and has been for some time, tracking below its average for the cycle. This will be of serious concern for the party in the run-up to the 2026 LGEs. It has fared better in both defending [up 8.6pts] and challenging [up 4.7pts] by-elections but, like its overall average, it is tracking down in its defending graph, which will be of concern.
The EFF is interesting. It is clearly doing better in the 2021 cycle than it did in the 2016 cycle. Its overall average is up 2pts. There is no point in producing defending tracks for the EFF, it won too few wards in the 2021 LGEs. In turn, its challenging track is therefore effectively its overall average, and there is no point producing a challenging track either. But the party does significantly better in by-elections than it does in market surveys and so its core concern is being able to replicate those results on Election Day.
Possibly the most important insight from the Track is turnout. It has stabilised, even improved slightly, from the 2016 cycle [up 1.6pts]. Turnout in by-elections is always dramatically less than in national elections, local or otherwise. But the trends do matter, and this will be very encouraging for all parties. The 2016 cycle saw turnout systematically collapse, a trend exacerbated by Covid and cemented by South Africa’s lowest ever national turnout level in 2021: 45.8%. If that collapse can be slowed, even arrested or slightly reversed in 2026, it will make a fundamental change to the prospects of all parties.
Conclusion
There is a huge amount of other data that the Track can be used for. For the moment, it will be limited to focusing on the indicators above, which are important, insightful and statistically meaningful enough to track consistently. Also brief enough (these are a lot of graphs to update on a regular basis).
The Track is important. South Africa has not been able to contextualise by-election results, each batch being analysed in and of itself. This of course is critical, there is valuable information to be gained from that kind of analysis. But it is limited. We now have a far more meaningful general framework into which any by-election can be situated.
This essay is the 18th in an on-going series on Election 2026/7, for all other editions of this series, please click here: Election 2026/7
Discover more from inside politics
Subscribe to get the latest posts sent to your email.

You must be logged in to post a comment.