
Election 2026/7 [11] A brief history of the voters’ roll
by The Editor

A look at the voters’ roll, its relationship to election turnout, the manner in which it has fluctuated over time and what that means. All of which sets the scene for 2026/7 and emphasises just how critical the two registration weekends that will precede the next election are to political parties generally, and the opposition in particular.
A brief history of the voters’ roll
By: Gareth van Onselen
Follow @GvanOnselen
2 February 2026
This essay is the 11th in an on-going series on Election 2026/7, for all other editions of this series, please click here: Election 2026/7
Introduction
Typically, any view on the voters’ roll (the IEC-maintained national database of who is registered and thus eligible to vote) revolves around an election, when the number of people it contains is brought into sharp relief.
When the IEC announces after the standard two registration weekends that precede any national election, the roll now comprises X or Y people, comparisons are done with the previous election (mostly by the IEC itself) and, for the most part, we live with the general impression the roll is always growing.
But the fact is the roll is maintained and updated by the IEC on a monthly basis, and these election-to-election comparisons don’t give one the full picture. They are also inconsistent and a proper understanding requires a more systematic set of numbers.
The only way you could theoretically track this, is to log into the IEC website and make a monthly (even daily, if you are feeling particularly enthusiastic) note of where the total figure stands, as the IEC maintains a real-time archive of the roll. Outside of that, however, the next best thing is IEC annual reports which, since 2006, publish where the roll stood at the beginning (1 April) and end (31 March) of each financial year.
The graph below tracks those numbers, since 2006.
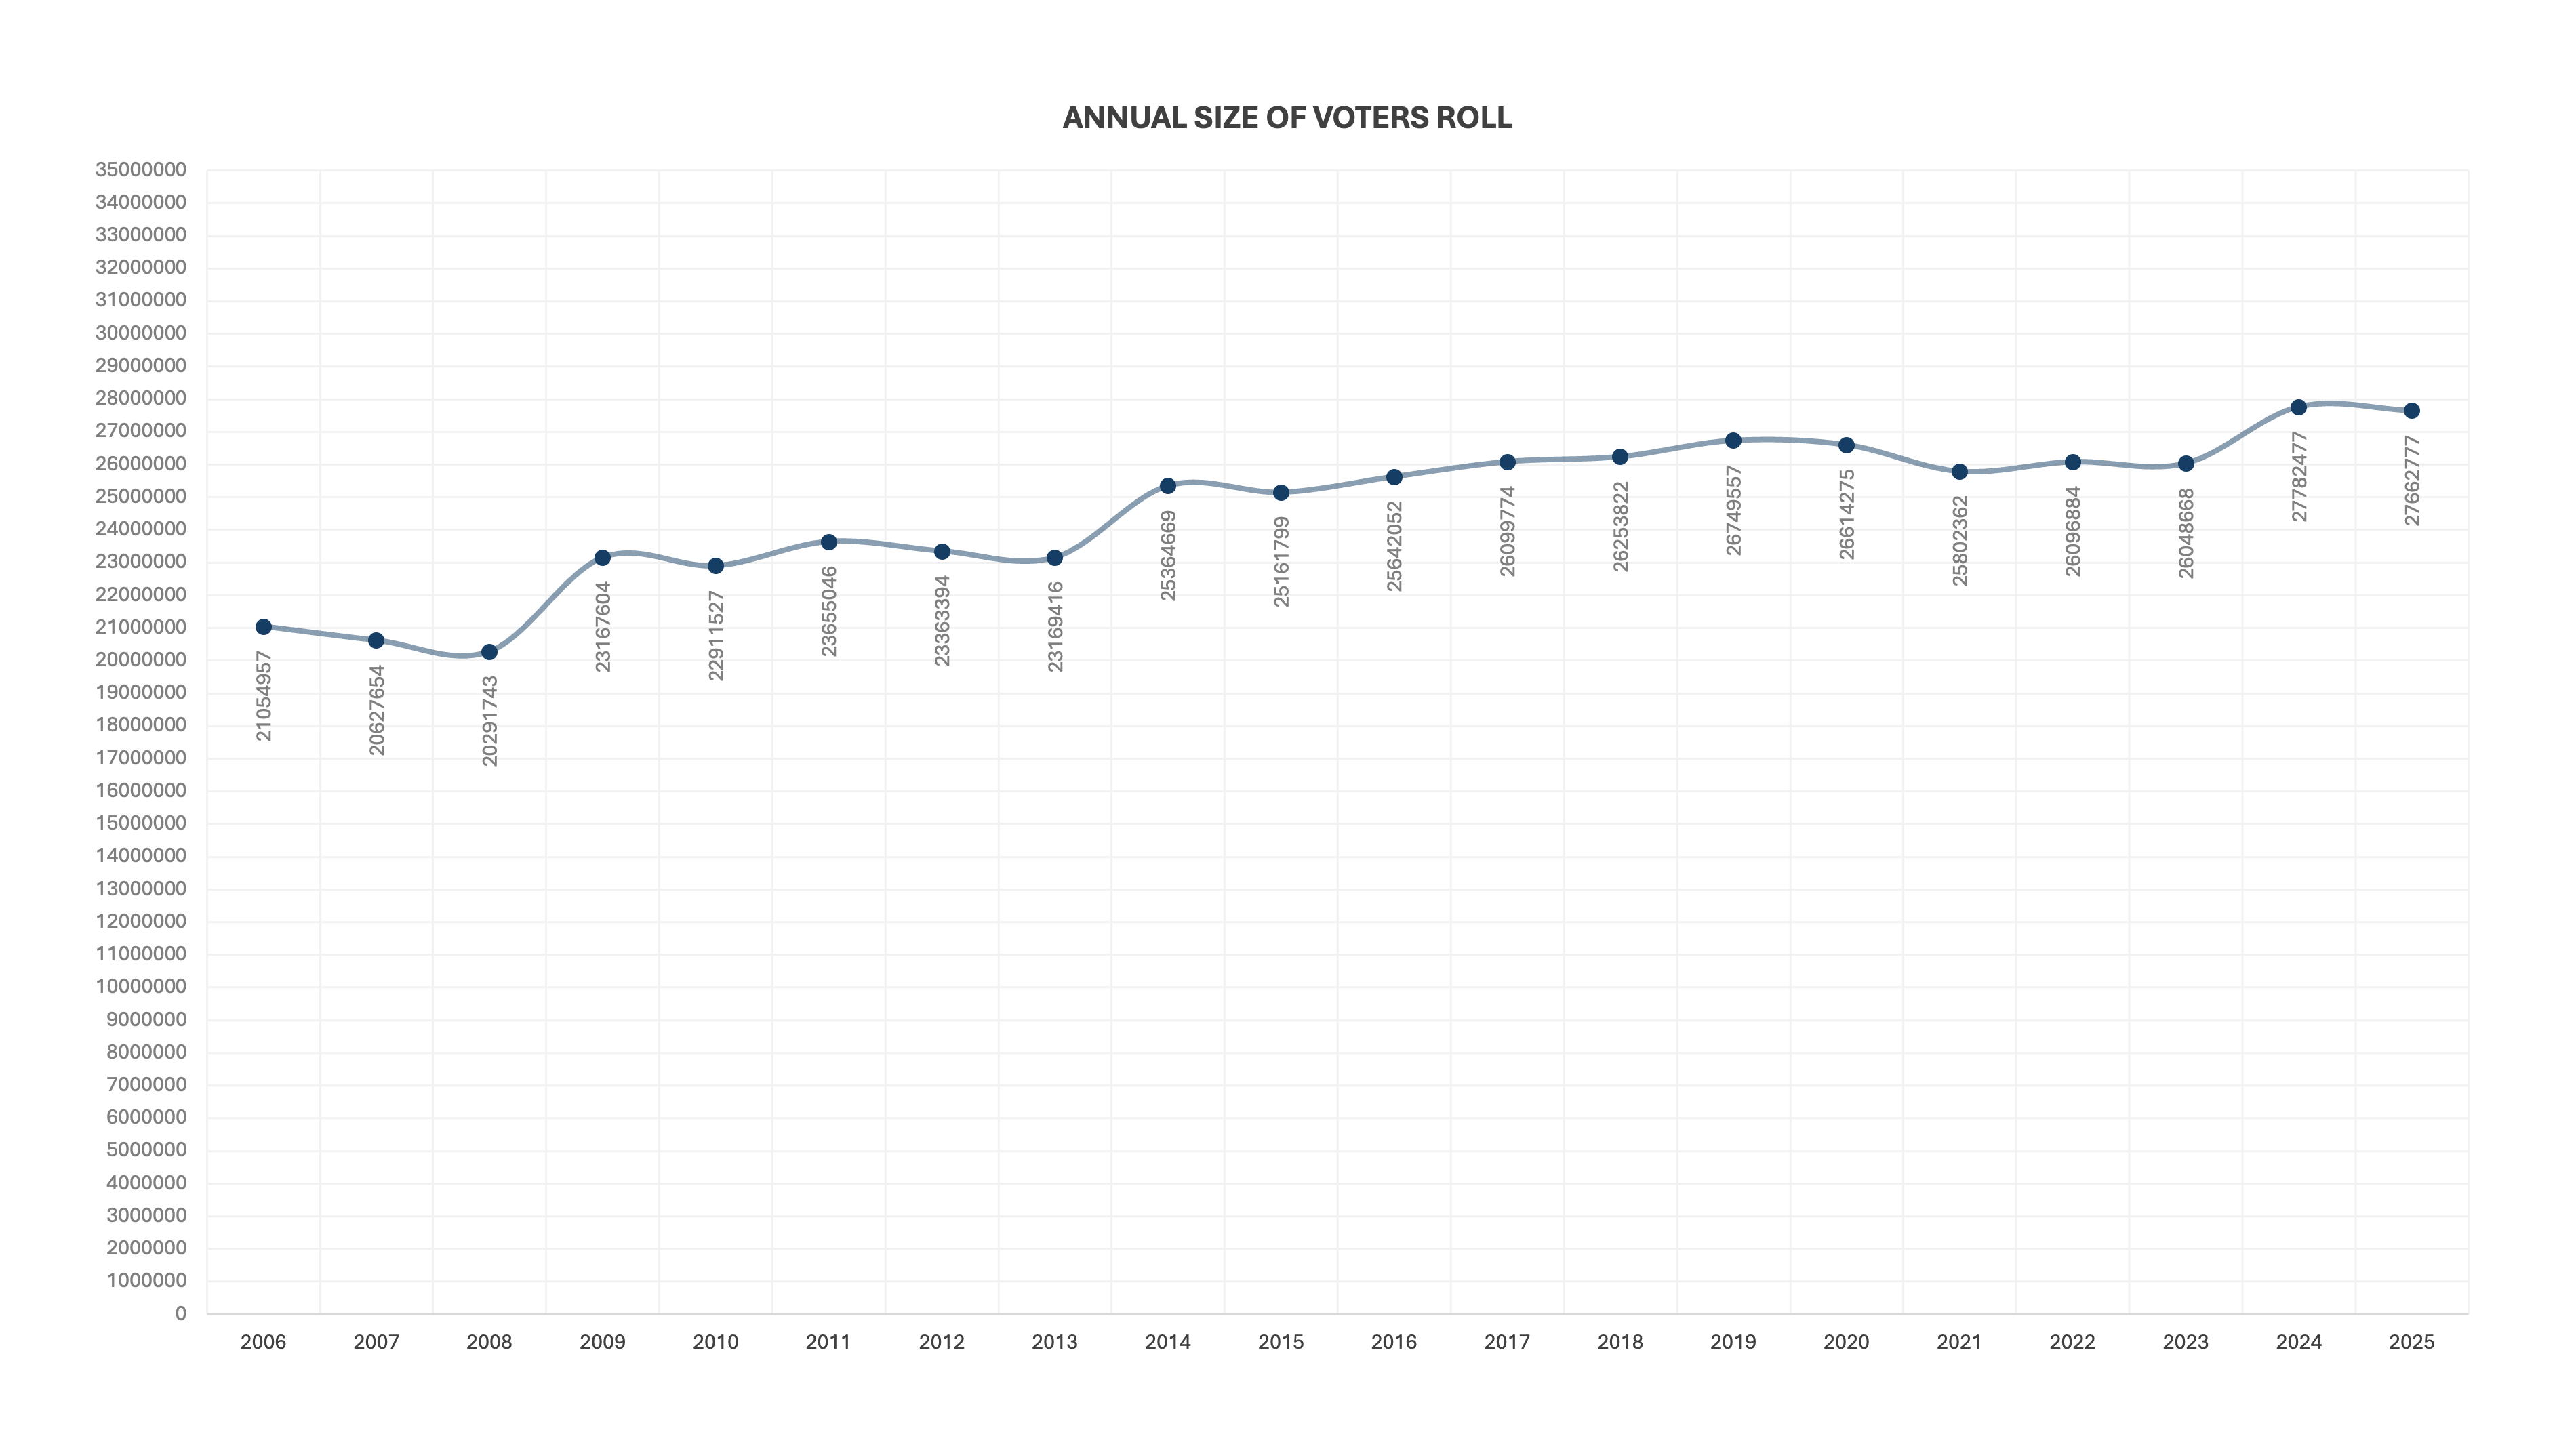
It’s not the most impressive showing. Since 2006, the roll has grown from 21,054,957 to 27,662,777 on 31 March 2025. That’s a growth of 6,607,820 registered voters, or 31.8% in 19 years. Put another way: a straight line compound growth rate of 1.45% (FYI, as of writing, the roll stands at: 27,672,264).
That this is bad, is a story for another column. You would prove it is problematic by looking at the size of the Voting Age Population (VAP), and how it has grown by comparison. But, for our purposes, it suffices to the say the IEC is well behind the curve: we are registering voters at a far slower rate than the VAP is growing.
If you plot the annual changes in the voters’s roll, you get the following graph:
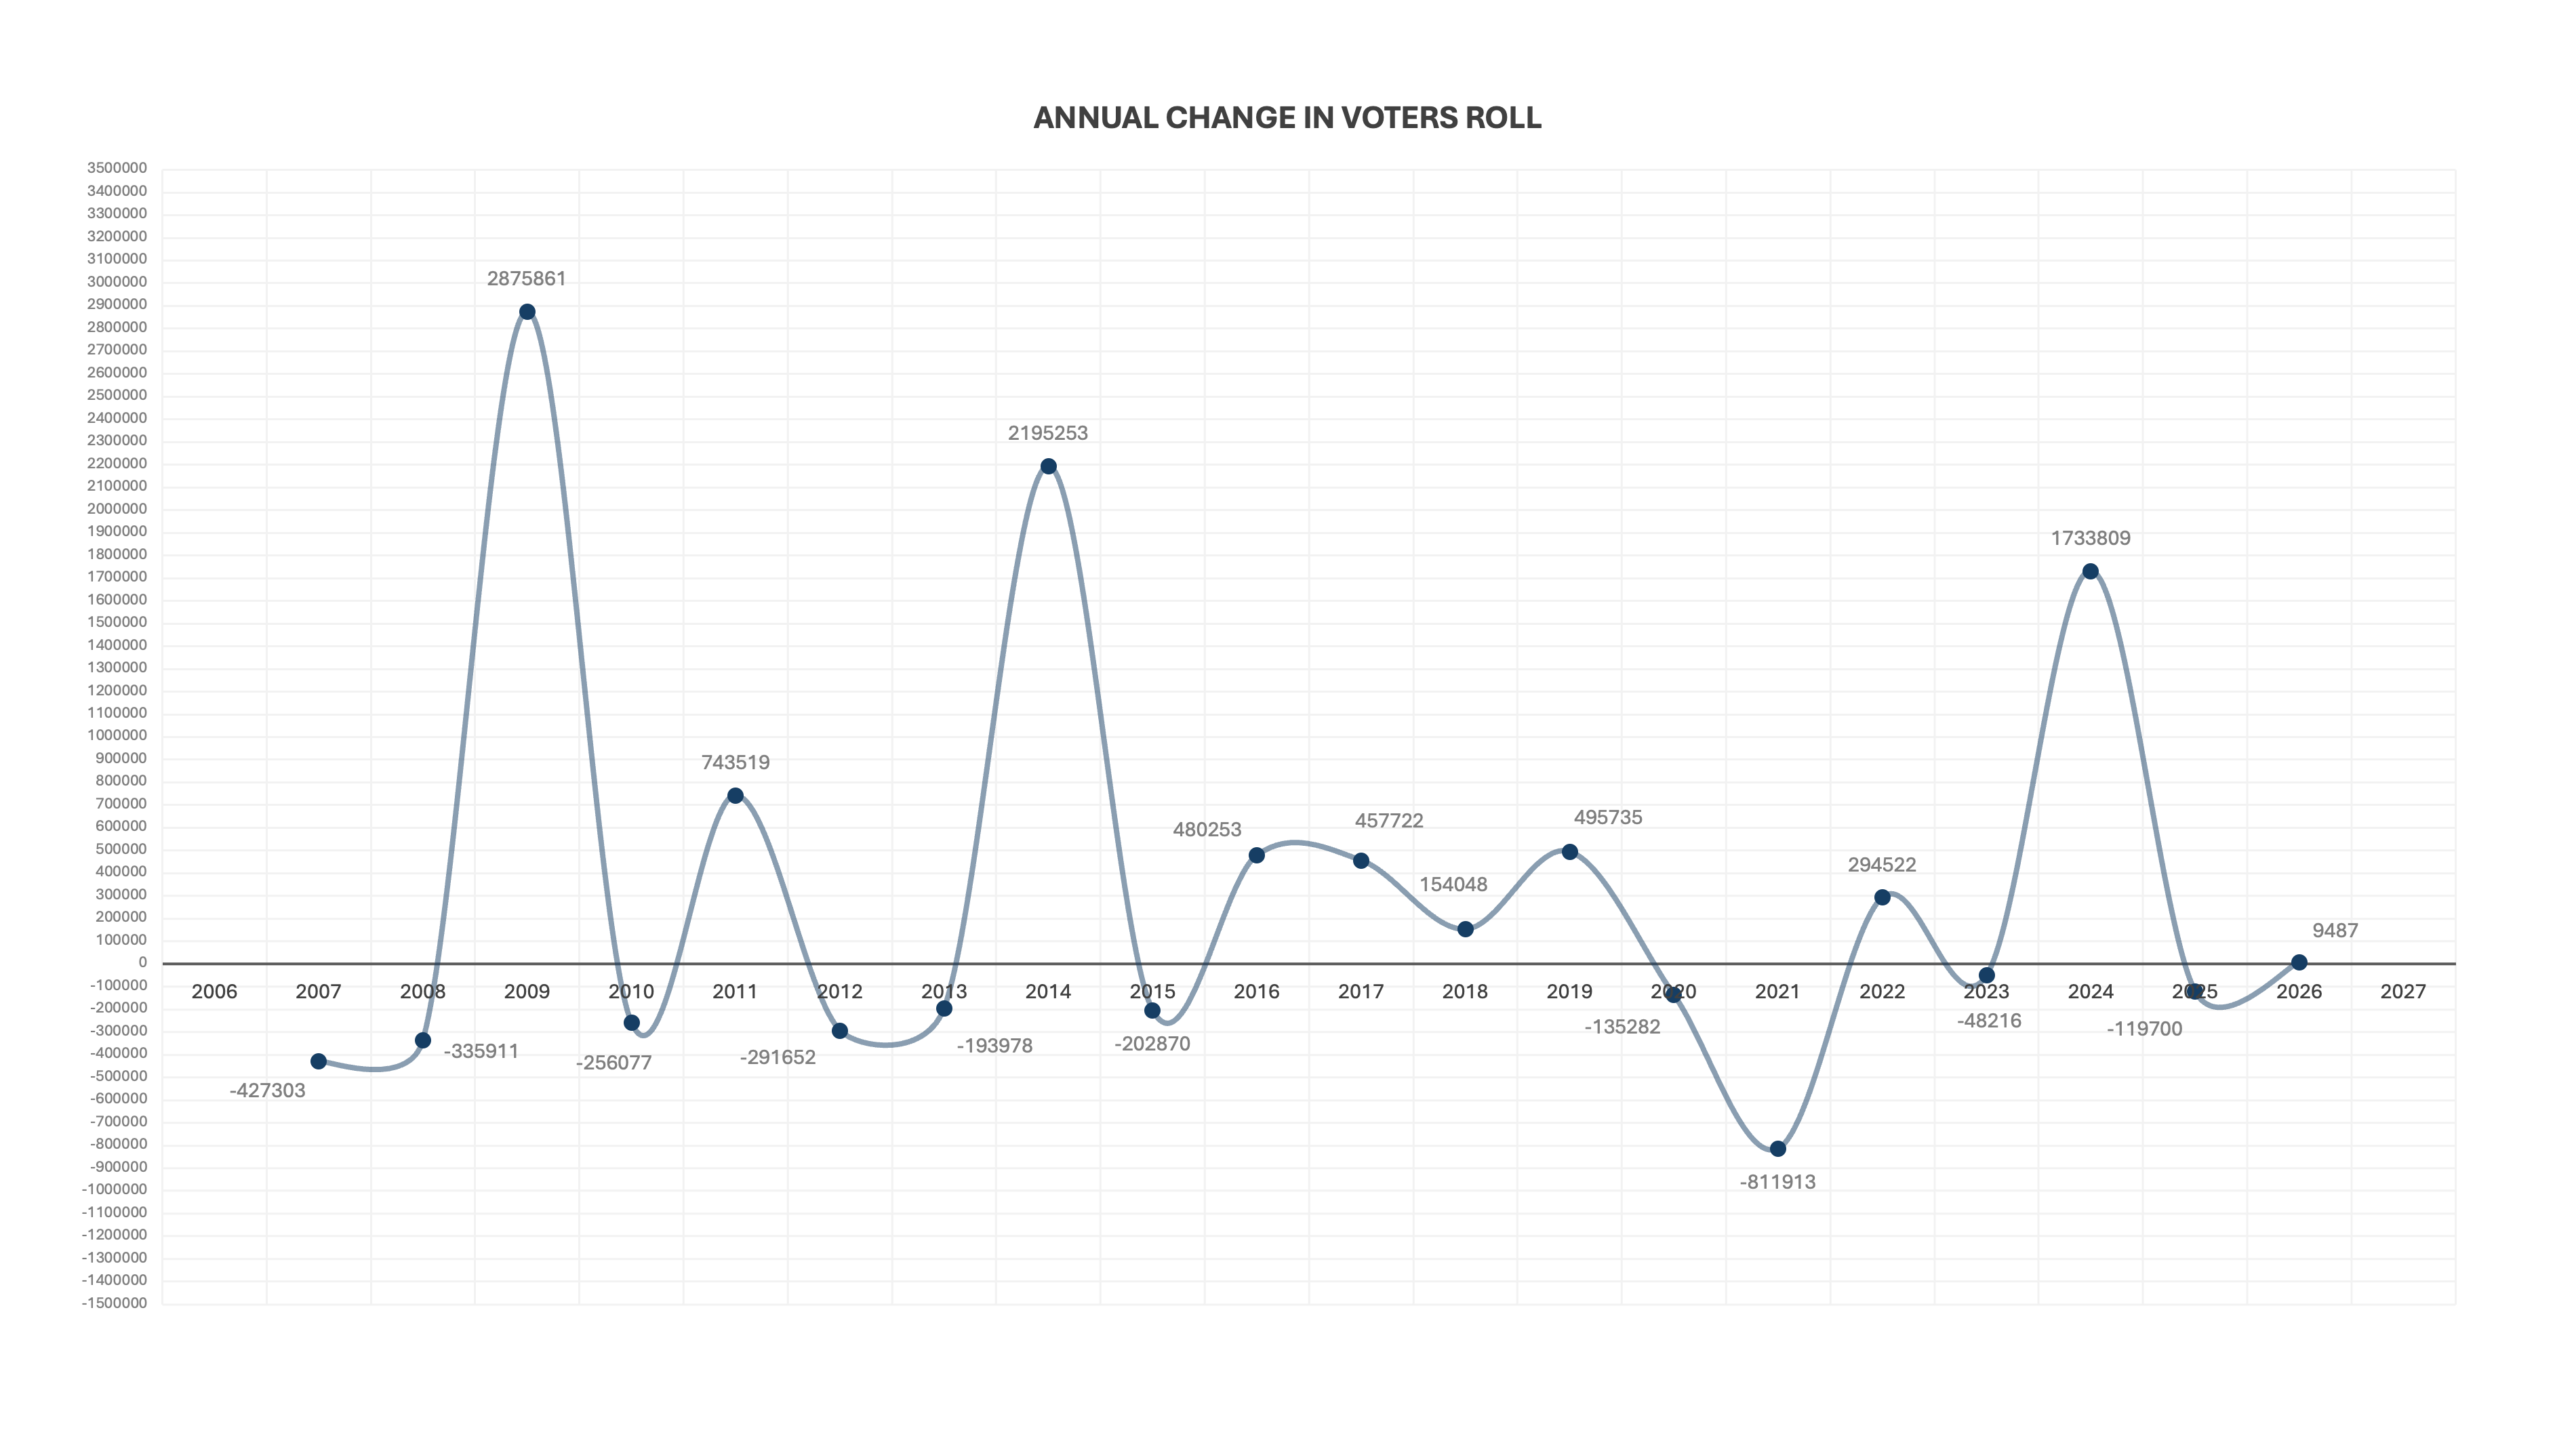
This is far more insightful. But also complicated to read. So what I am going to do, is repeat this graph several times, and highlight a different section each time, moving from left to right. That way, we can tell the story of the voters’ roll over the past 19 years.
Let’s start with obvious and the general: there are significant fluctuations. When national elections occur (see 2009 and 2014 for example), there are huge spikes. These tend to matter more to people, and the two IEC registration weekends that precede a national election, deliver the bulk of voters’ roll growth. There are smaller spikes for local elections (see 2011 and 2016). Again, local government registration weekends deliver growth, but less so than national elections. In between this, there are declines (see 2012 and 2013), when there are no registration weekends, or elections, and the roll is continuously “cleaned” of voters (mainly due to mortality or immigration).
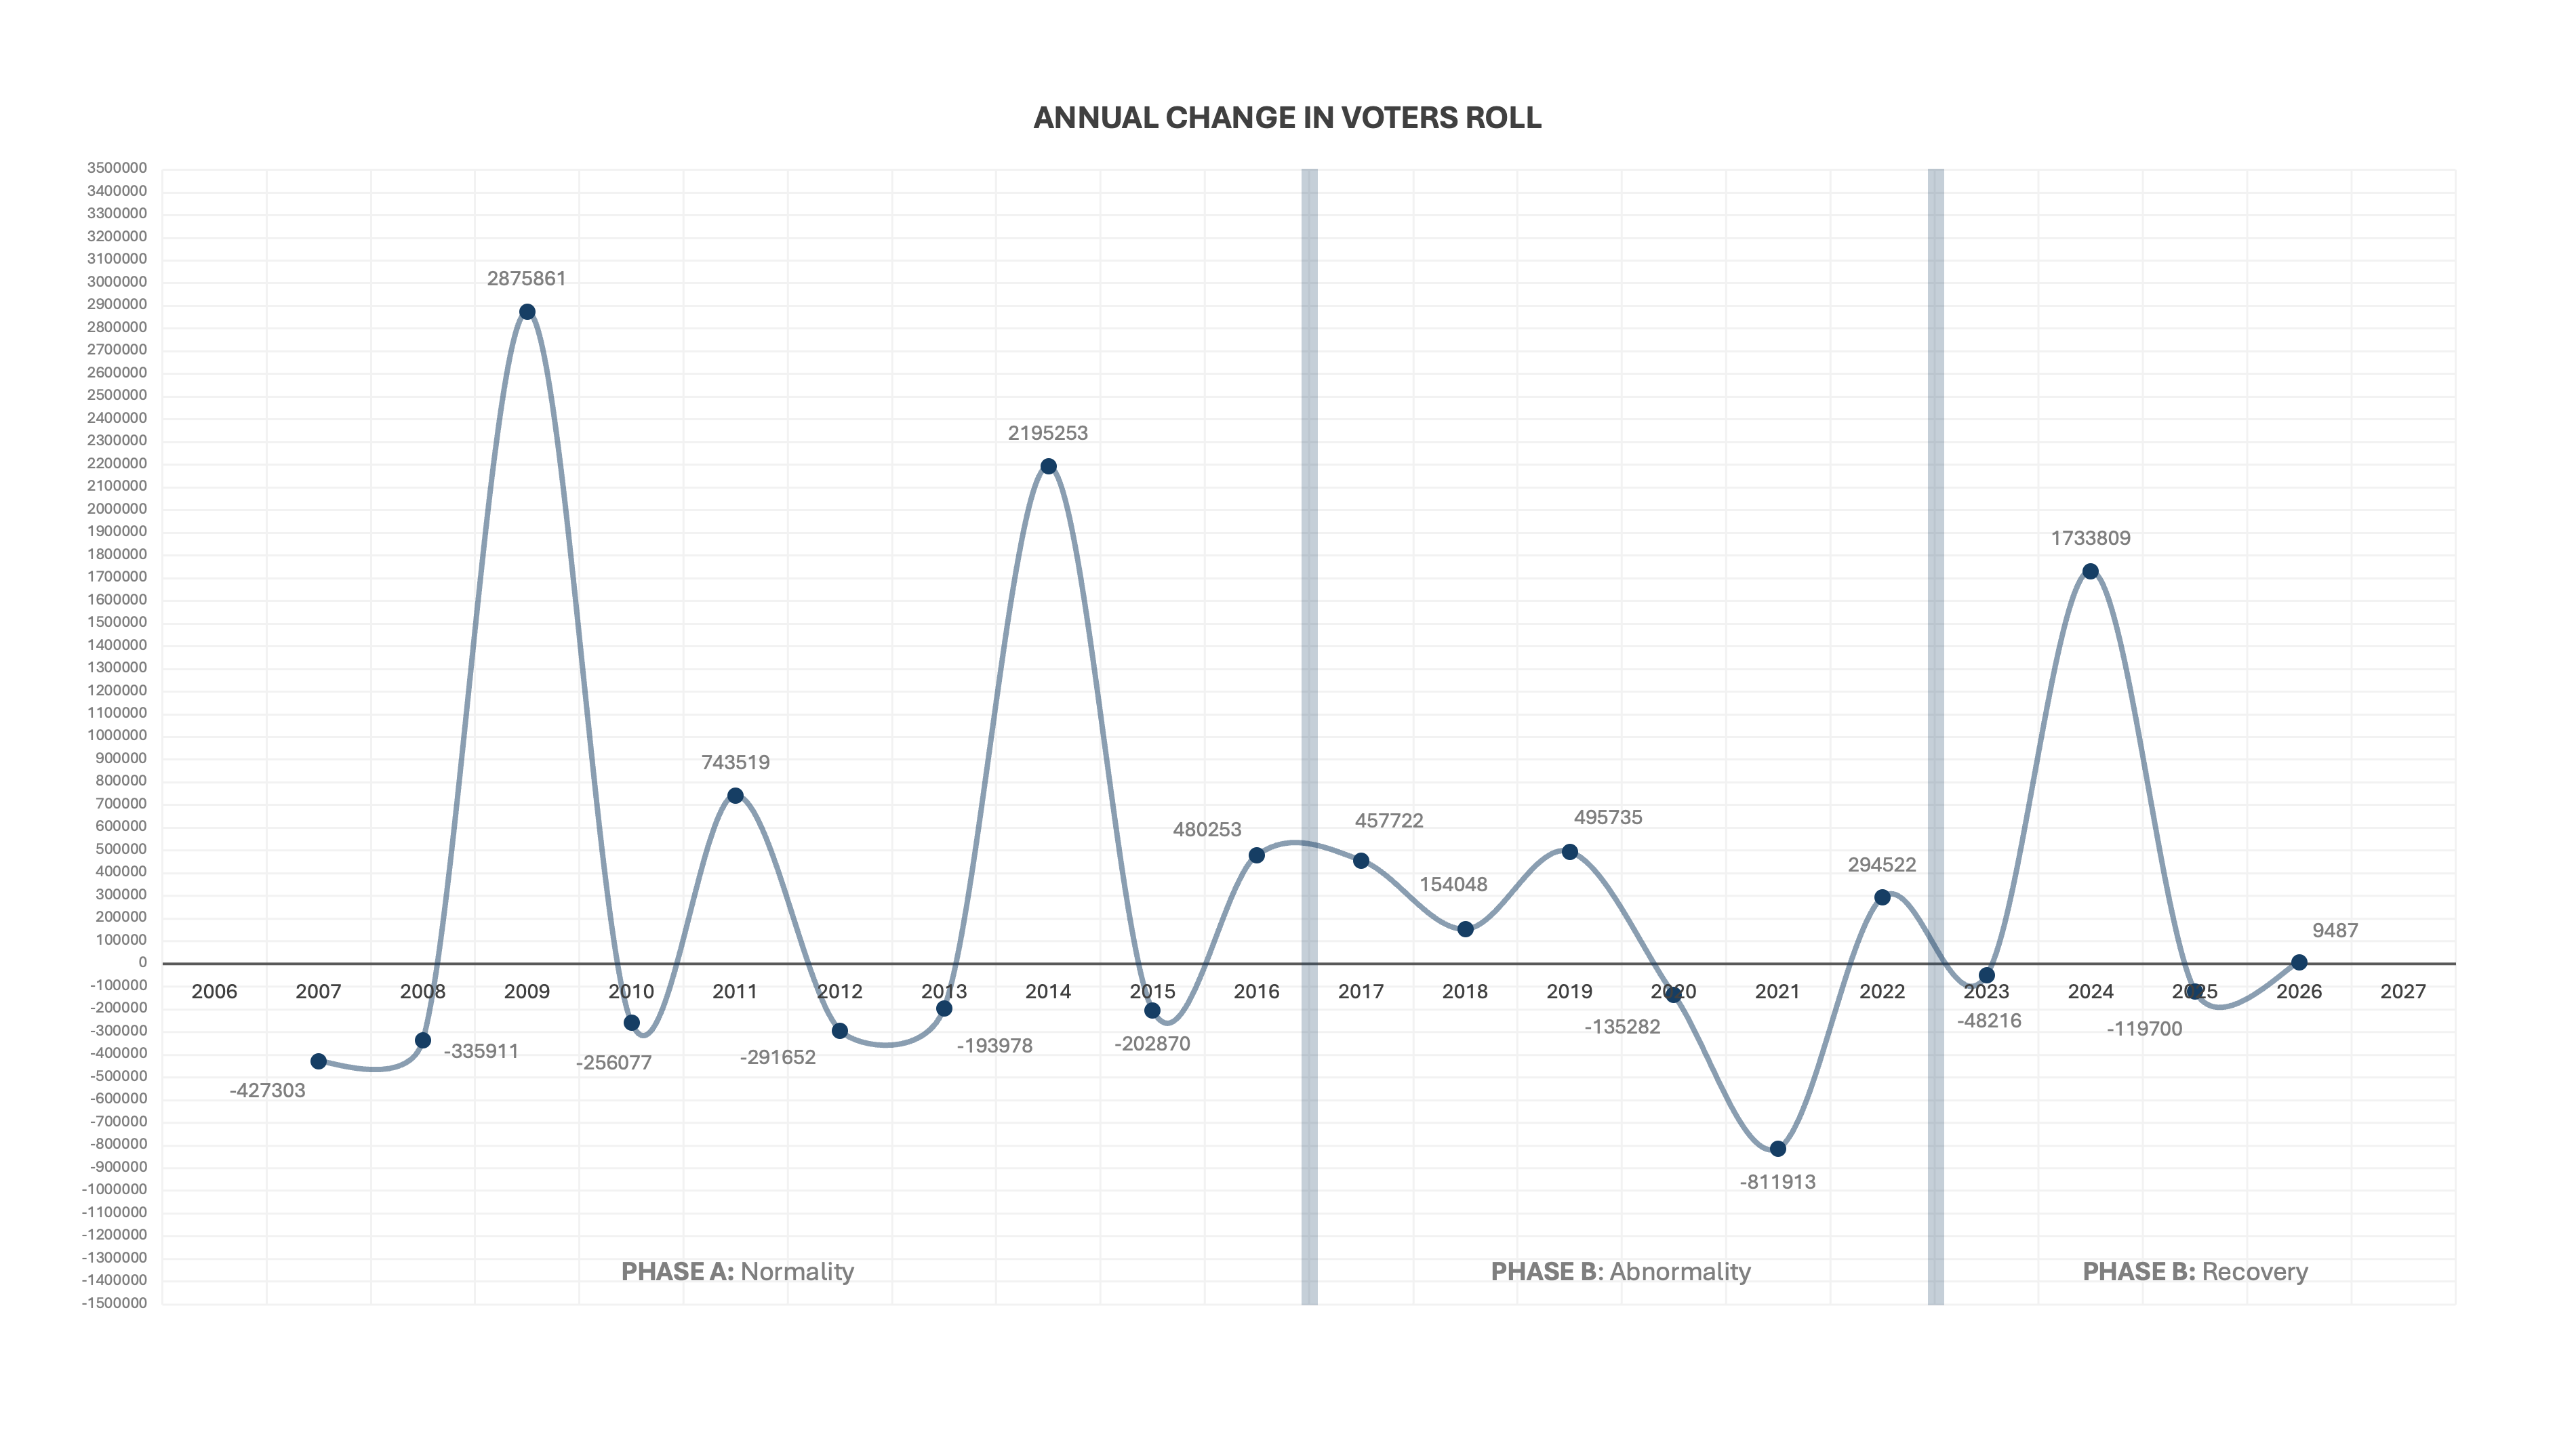
What is also obvious, is that between around 2017 and 2022, things went haywire.
Let’s divide the graph up into three distinct phases. We will call them Phase A: Normality, Phase B: Abnormality and Phase C: Recovery:
Phase A: Normality
All things being good and healthy, Phase A is the IEC’s ideal scenario. Healthy spikes in 2009 and 2014 (both national elections), and 2011 and 2016 (both local elections). In fact, things were so healthy in 2016, that 2017 recorded a spike as well, unprecedented for the IEC. That was reflected in the 2016 election, which saw the opposition (the DA in particular) deliver extraordinary results in urban metros. In fact, the opposition did so well, it masked a relatively good performance for the ANC in local elections. All in all, the period around 2016 was exceptional.
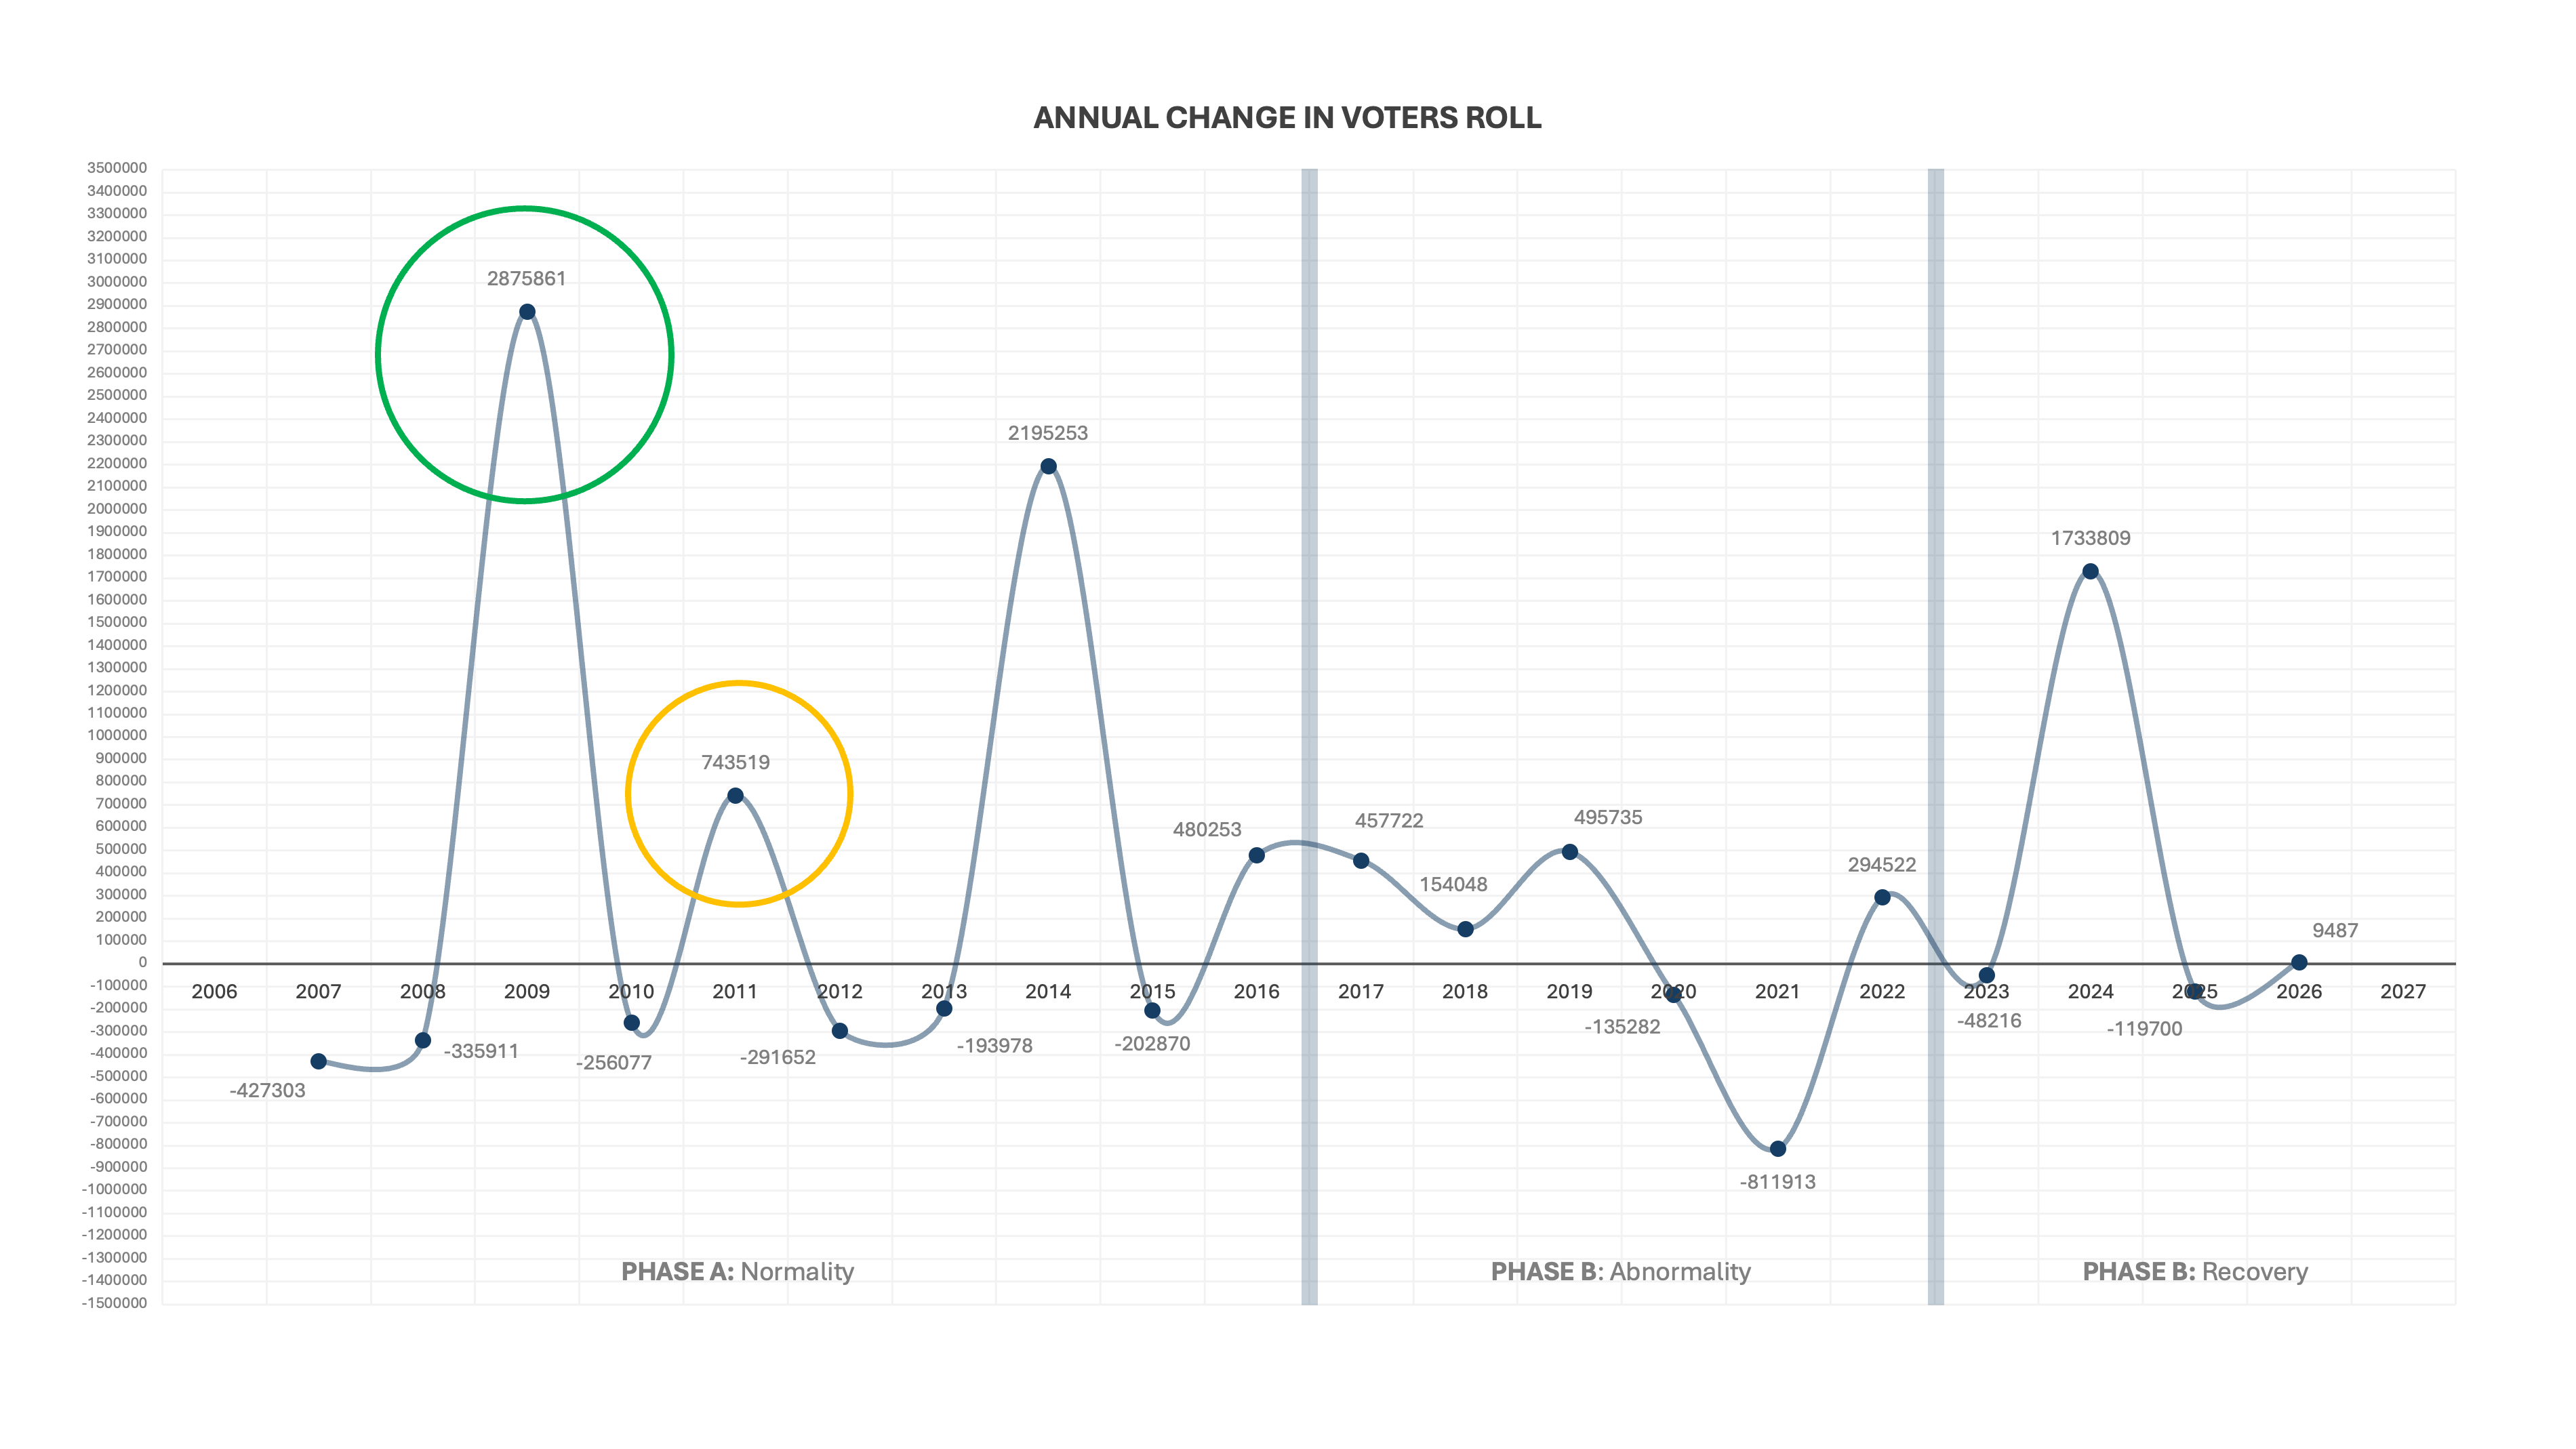
This relationship – between the state of the voters’ roll, and election turnout – is important. Both speak to voter enthusiasm, as we shall see in more detail later.
Phase B: Abnormality
The period 2017 to 2023 was an unmitigated disaster for the voters’ roll. Some of this can be explained by Covid-19 – 2021 in particular, when the roll declined by 811,913 people, and only one registration weekend, also as a result of Covid-19, did little to mitigate the problem.
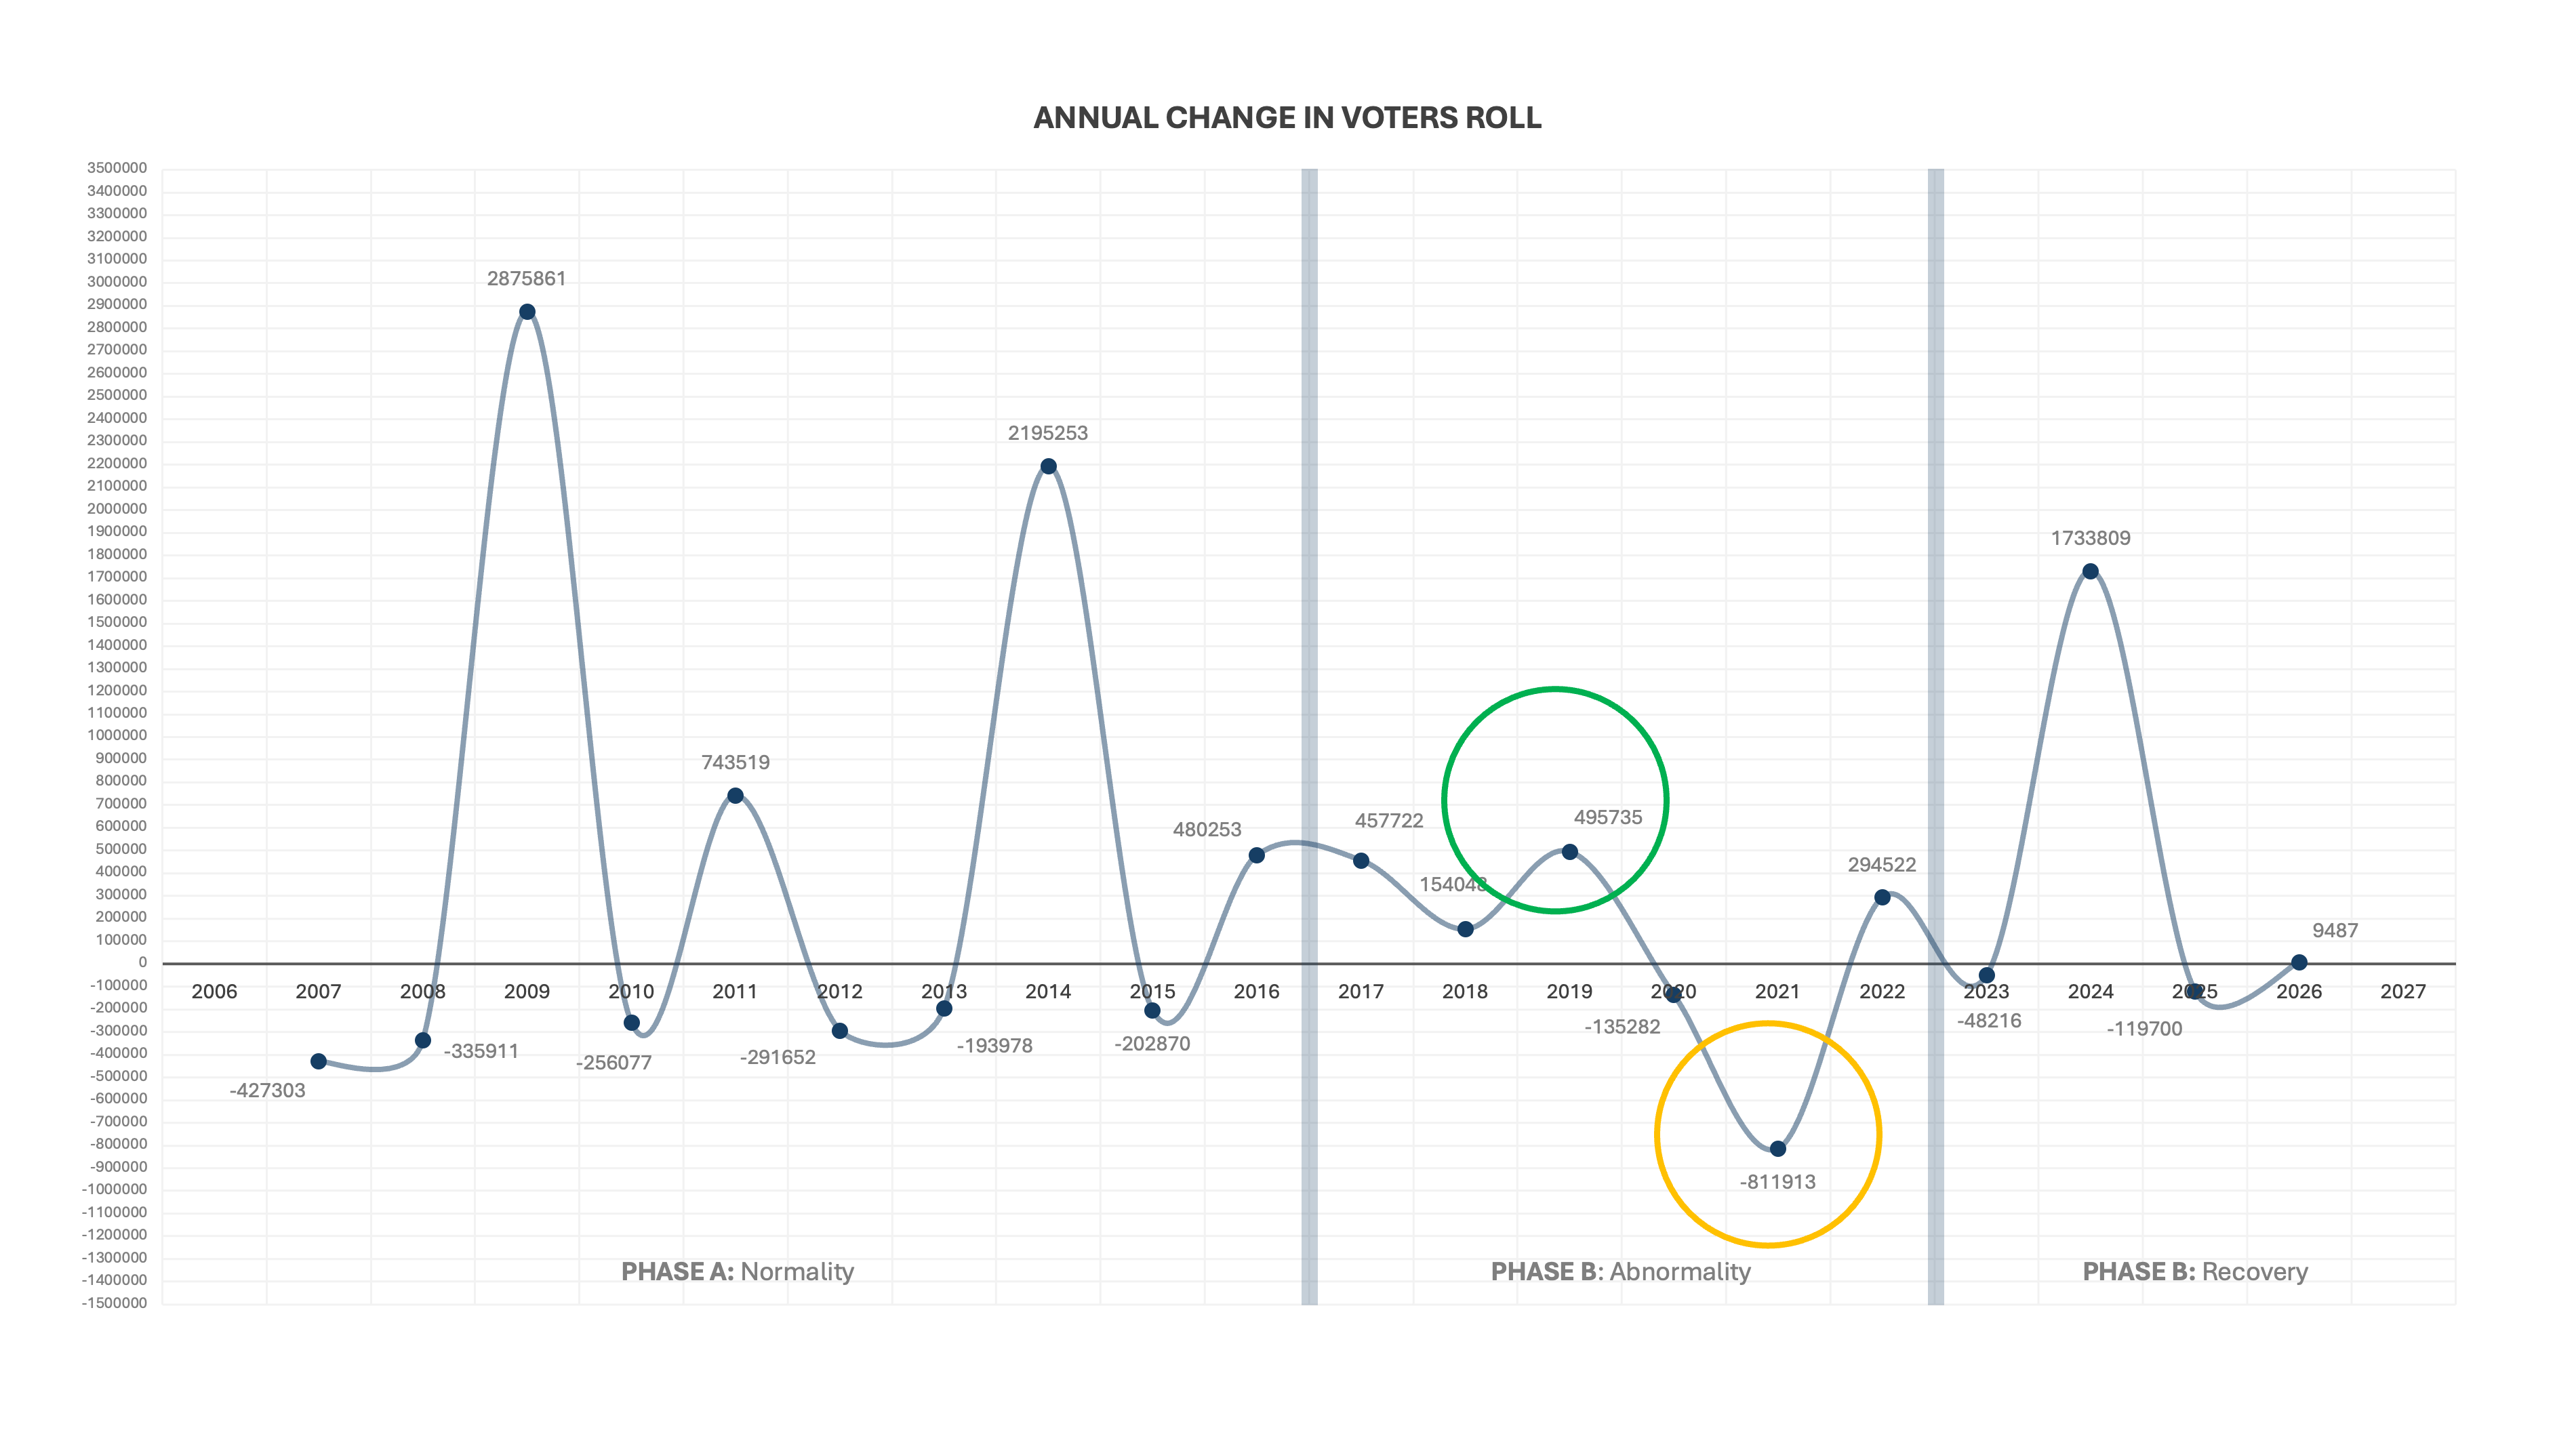
But the decline started before then. The 2019 national election was a catastrophic disaster. From well over 2m new registrations in 2009 and 2014, the roll grew by just 495,735 in 2019. The most logical explanation for this is Jacob Zuma, and the steady implosion of both the ANC’s credibility and government service delivery over the preceeding decade. As those both went through the floor, so potential voters (and registered voters alike) opted out in record numbers.
Covid-19 just added fuel to a fire that was already burning hot on apathy and alienation. Together, they set the voters roll back years. Consider this: On 31 March 2021 the voters rolls stood at 25,802,362. On 31 March 2014, it stood at 25,364,669. Over that 11 year period, the roll grew just by just 437,693 new registrations (or 1.7%). The damage that period did to the legitimacy of the South Africa’s democracy was profound.
Phase C: Recovery
The 2024 national and provincial elections saw some semblance of normality resume.
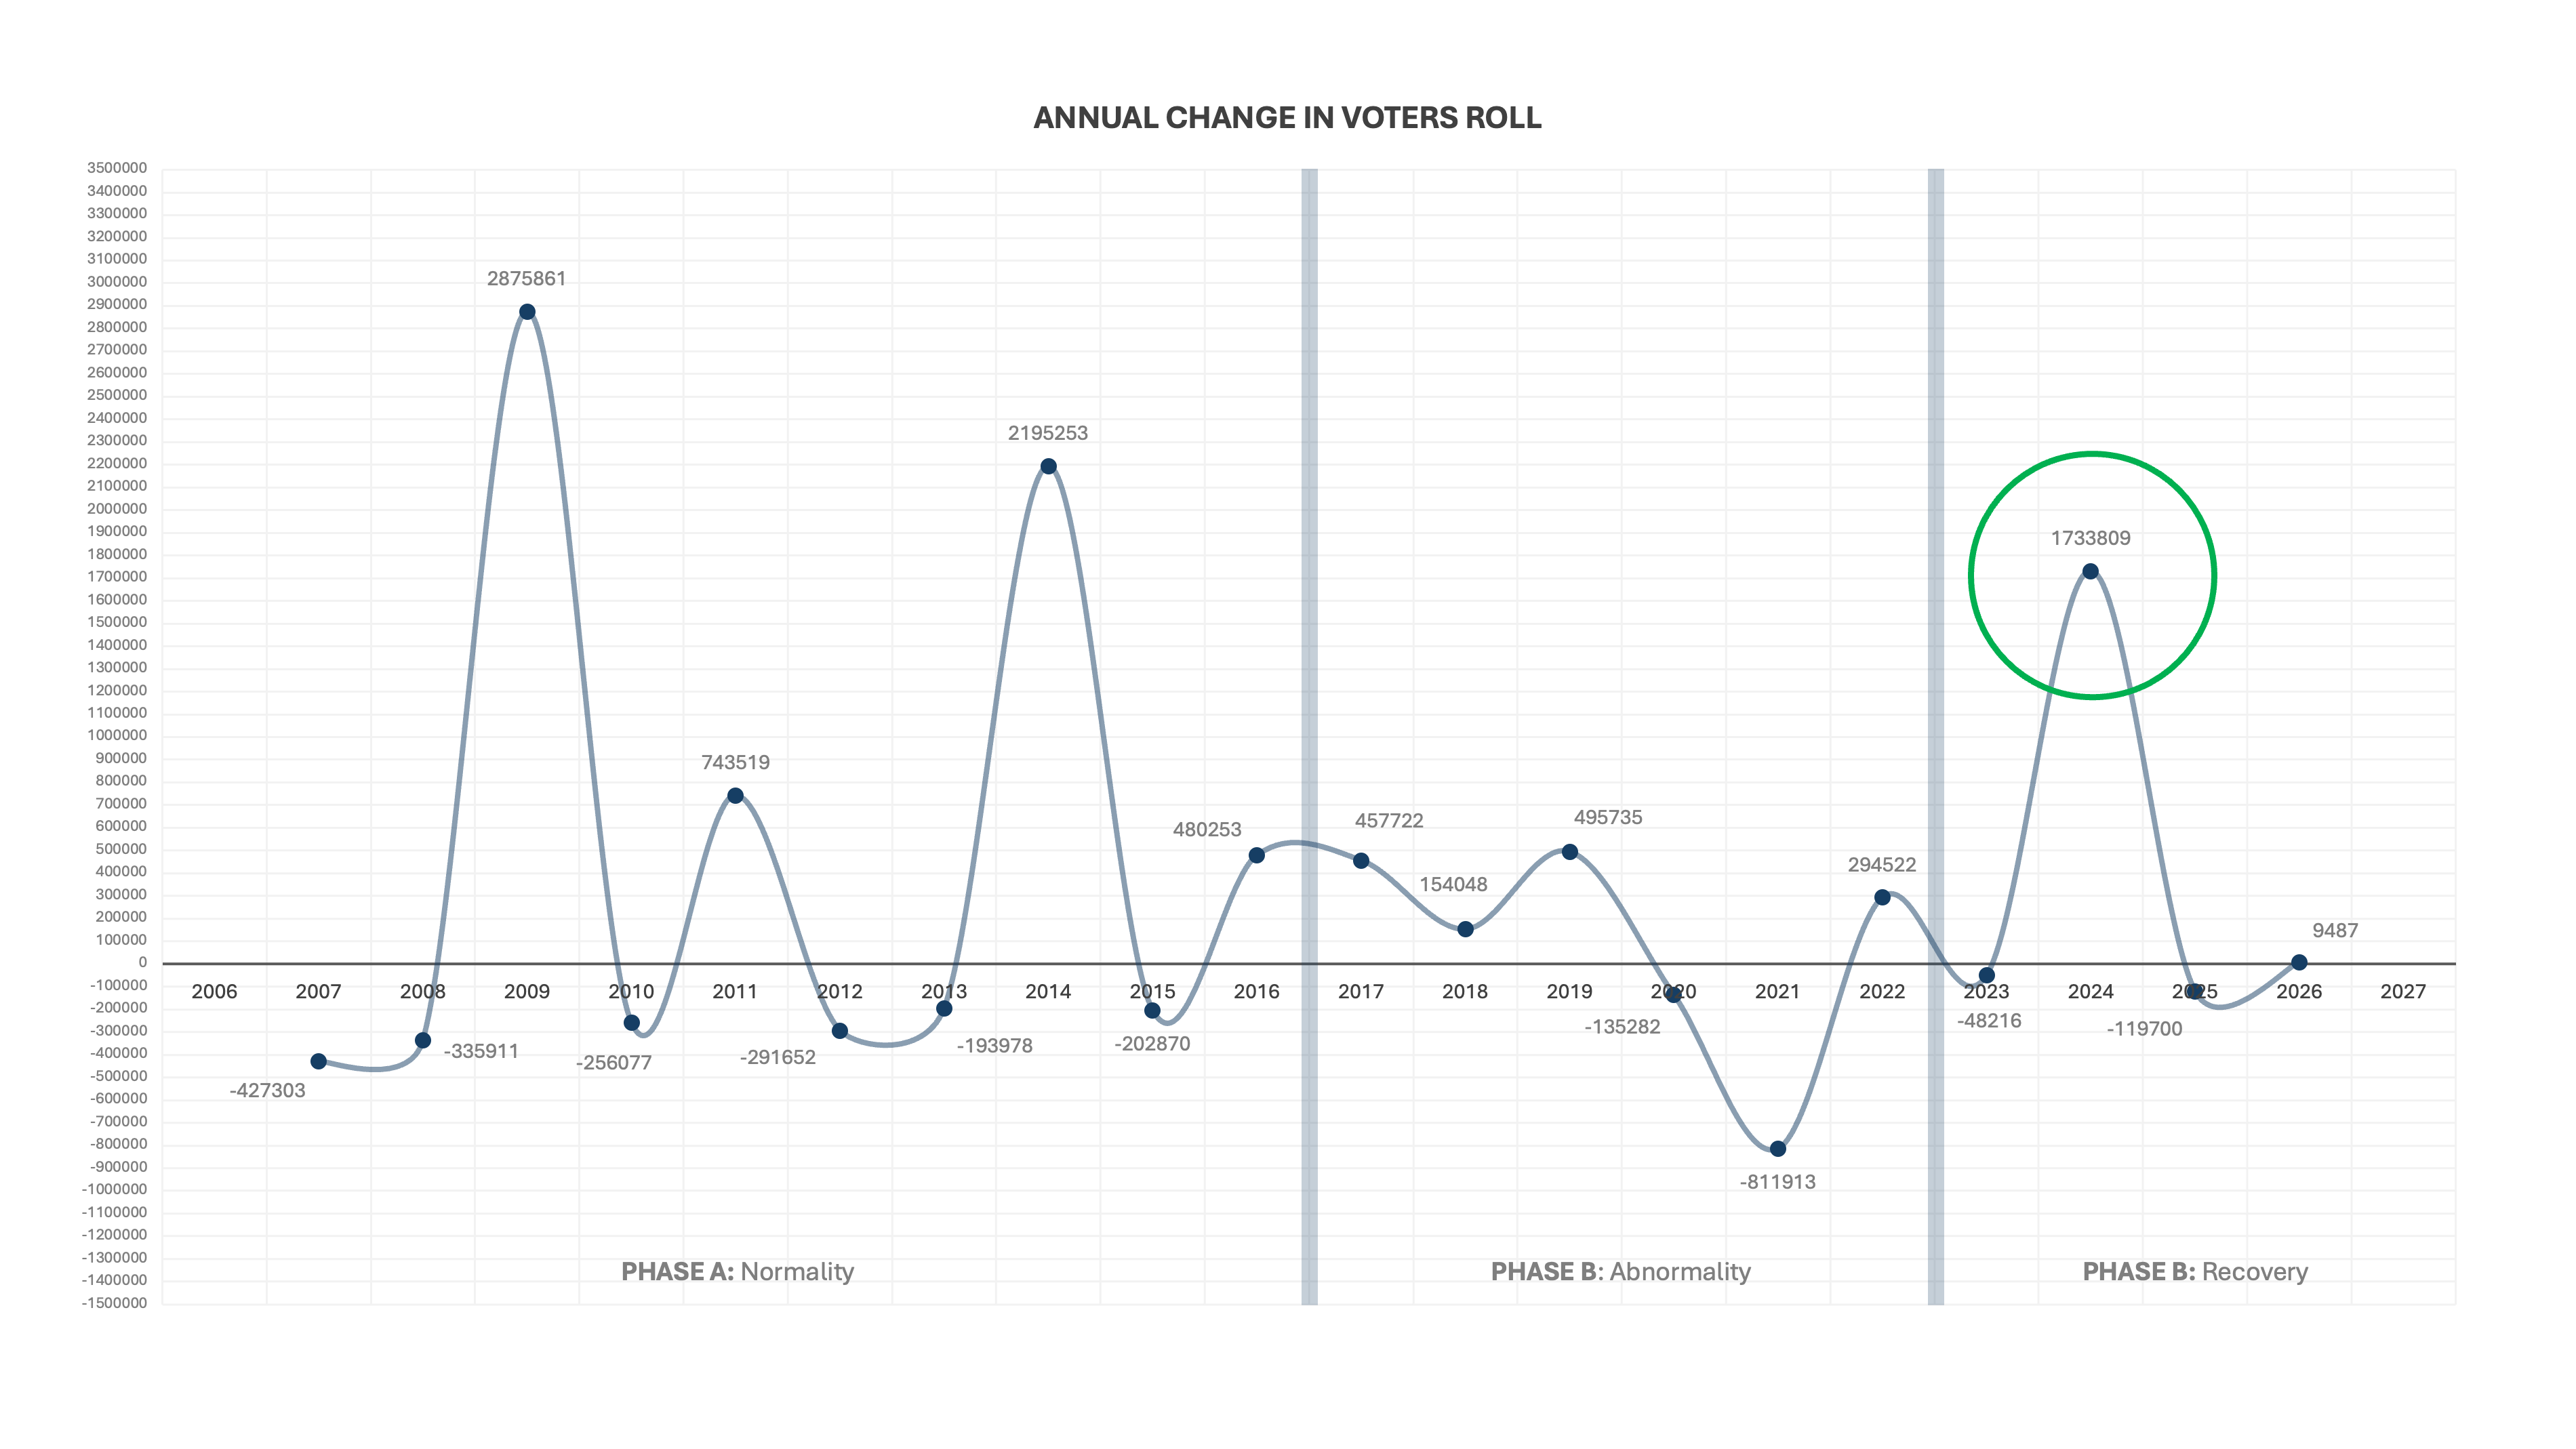
The two registration weekends before the 2024 national and provincial elections (supplemented by the advent of online registration, started in 2021 but no longer a novelty) saw the typical national spike reappear, with 1.7m new registrations.
As of writing, the size of the voters roll has increased since then, by 9,487 new voters (an encouraging upward trend) and so the ultimate question will be, where will it end up when the 2026/7 local elections arrive?
Will they too see a typical (if not smaller) spike reappear. It is absolutely critical for the opposition, if it is to take advantage of the ANC’s decline, as it did in 2016, that it knock the ball out the park when it comes to the two upcoming voter registration weekends. But, even if it does, there are greater forces as play, they will have to overcome.
Here is what happens if you plot election turnout against the voters’ roll.
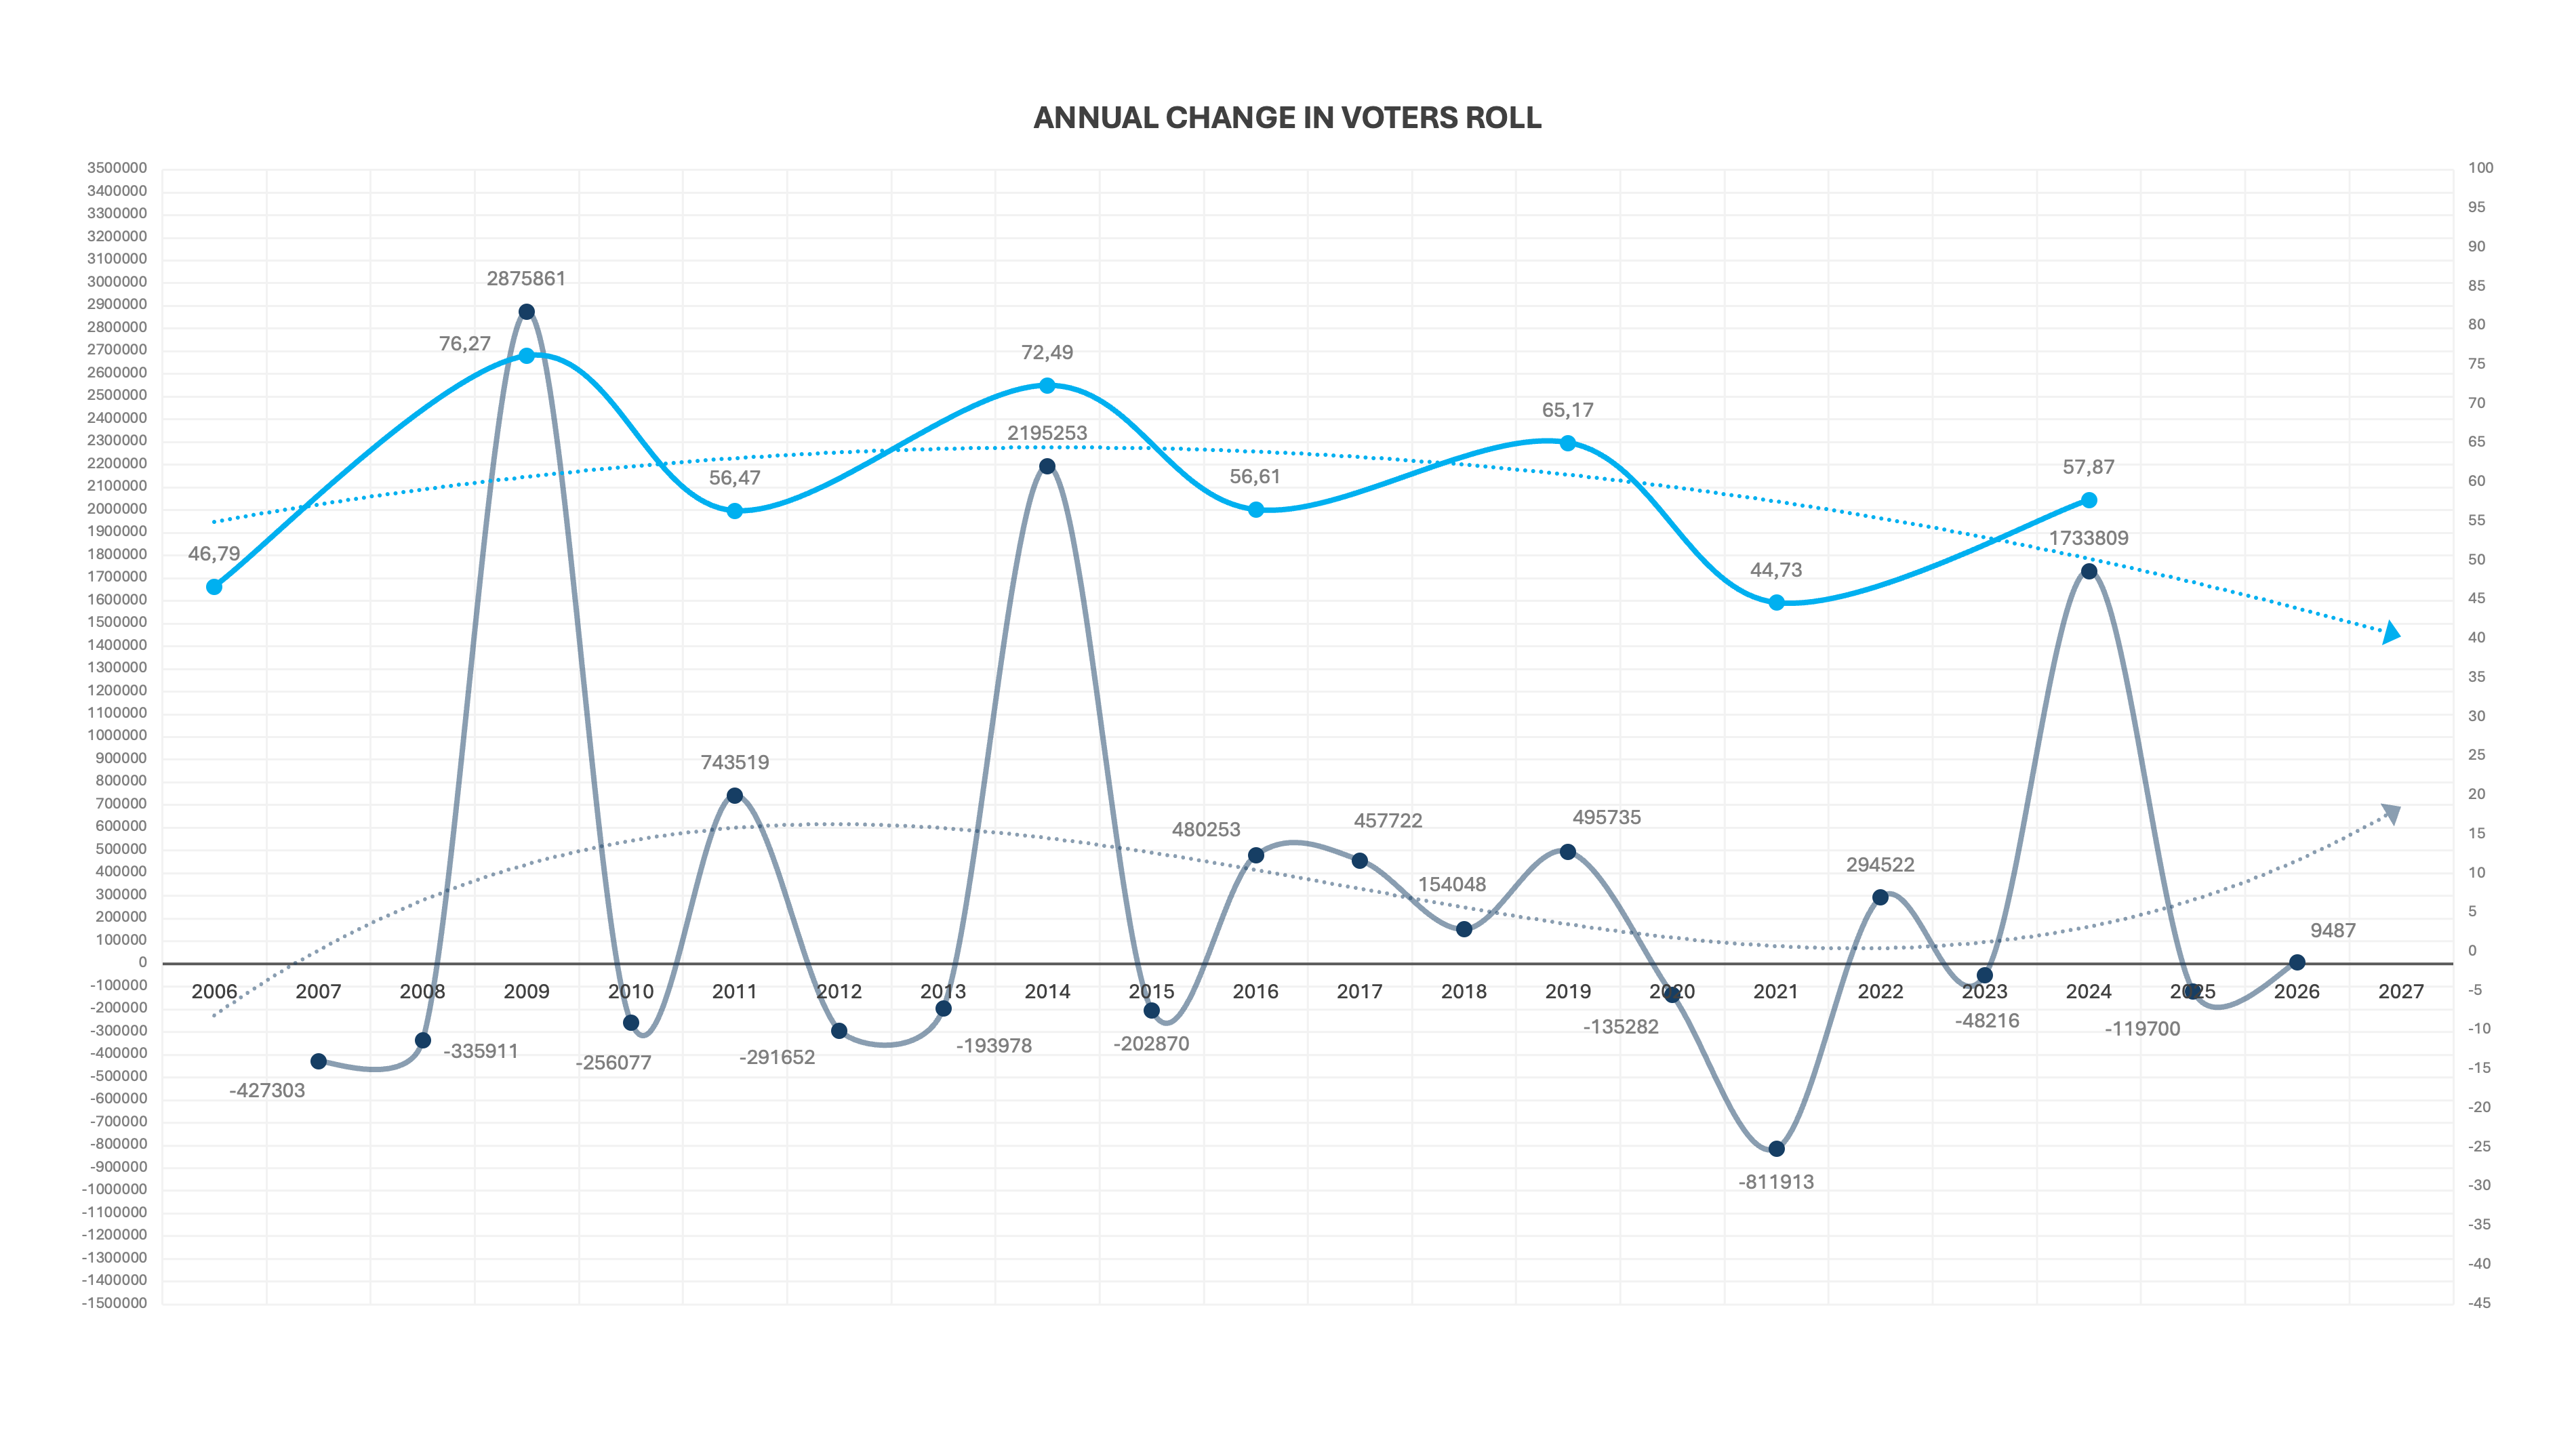
Yes, registration seems to be on the up, following the 2024 election, but turnout is on the decline regardless. It is important to remember, that while both registration rates and turnout measure voter enthusiasm, they are two different measures: registering to vote is not a commitment to actually vote (although there are correlations). And besides, that recent up tick in 2024 registrations is misleading, if you look at the trends hidden in that graph.
Let’s join up the national election spikes, and local election spikes and see what they say:
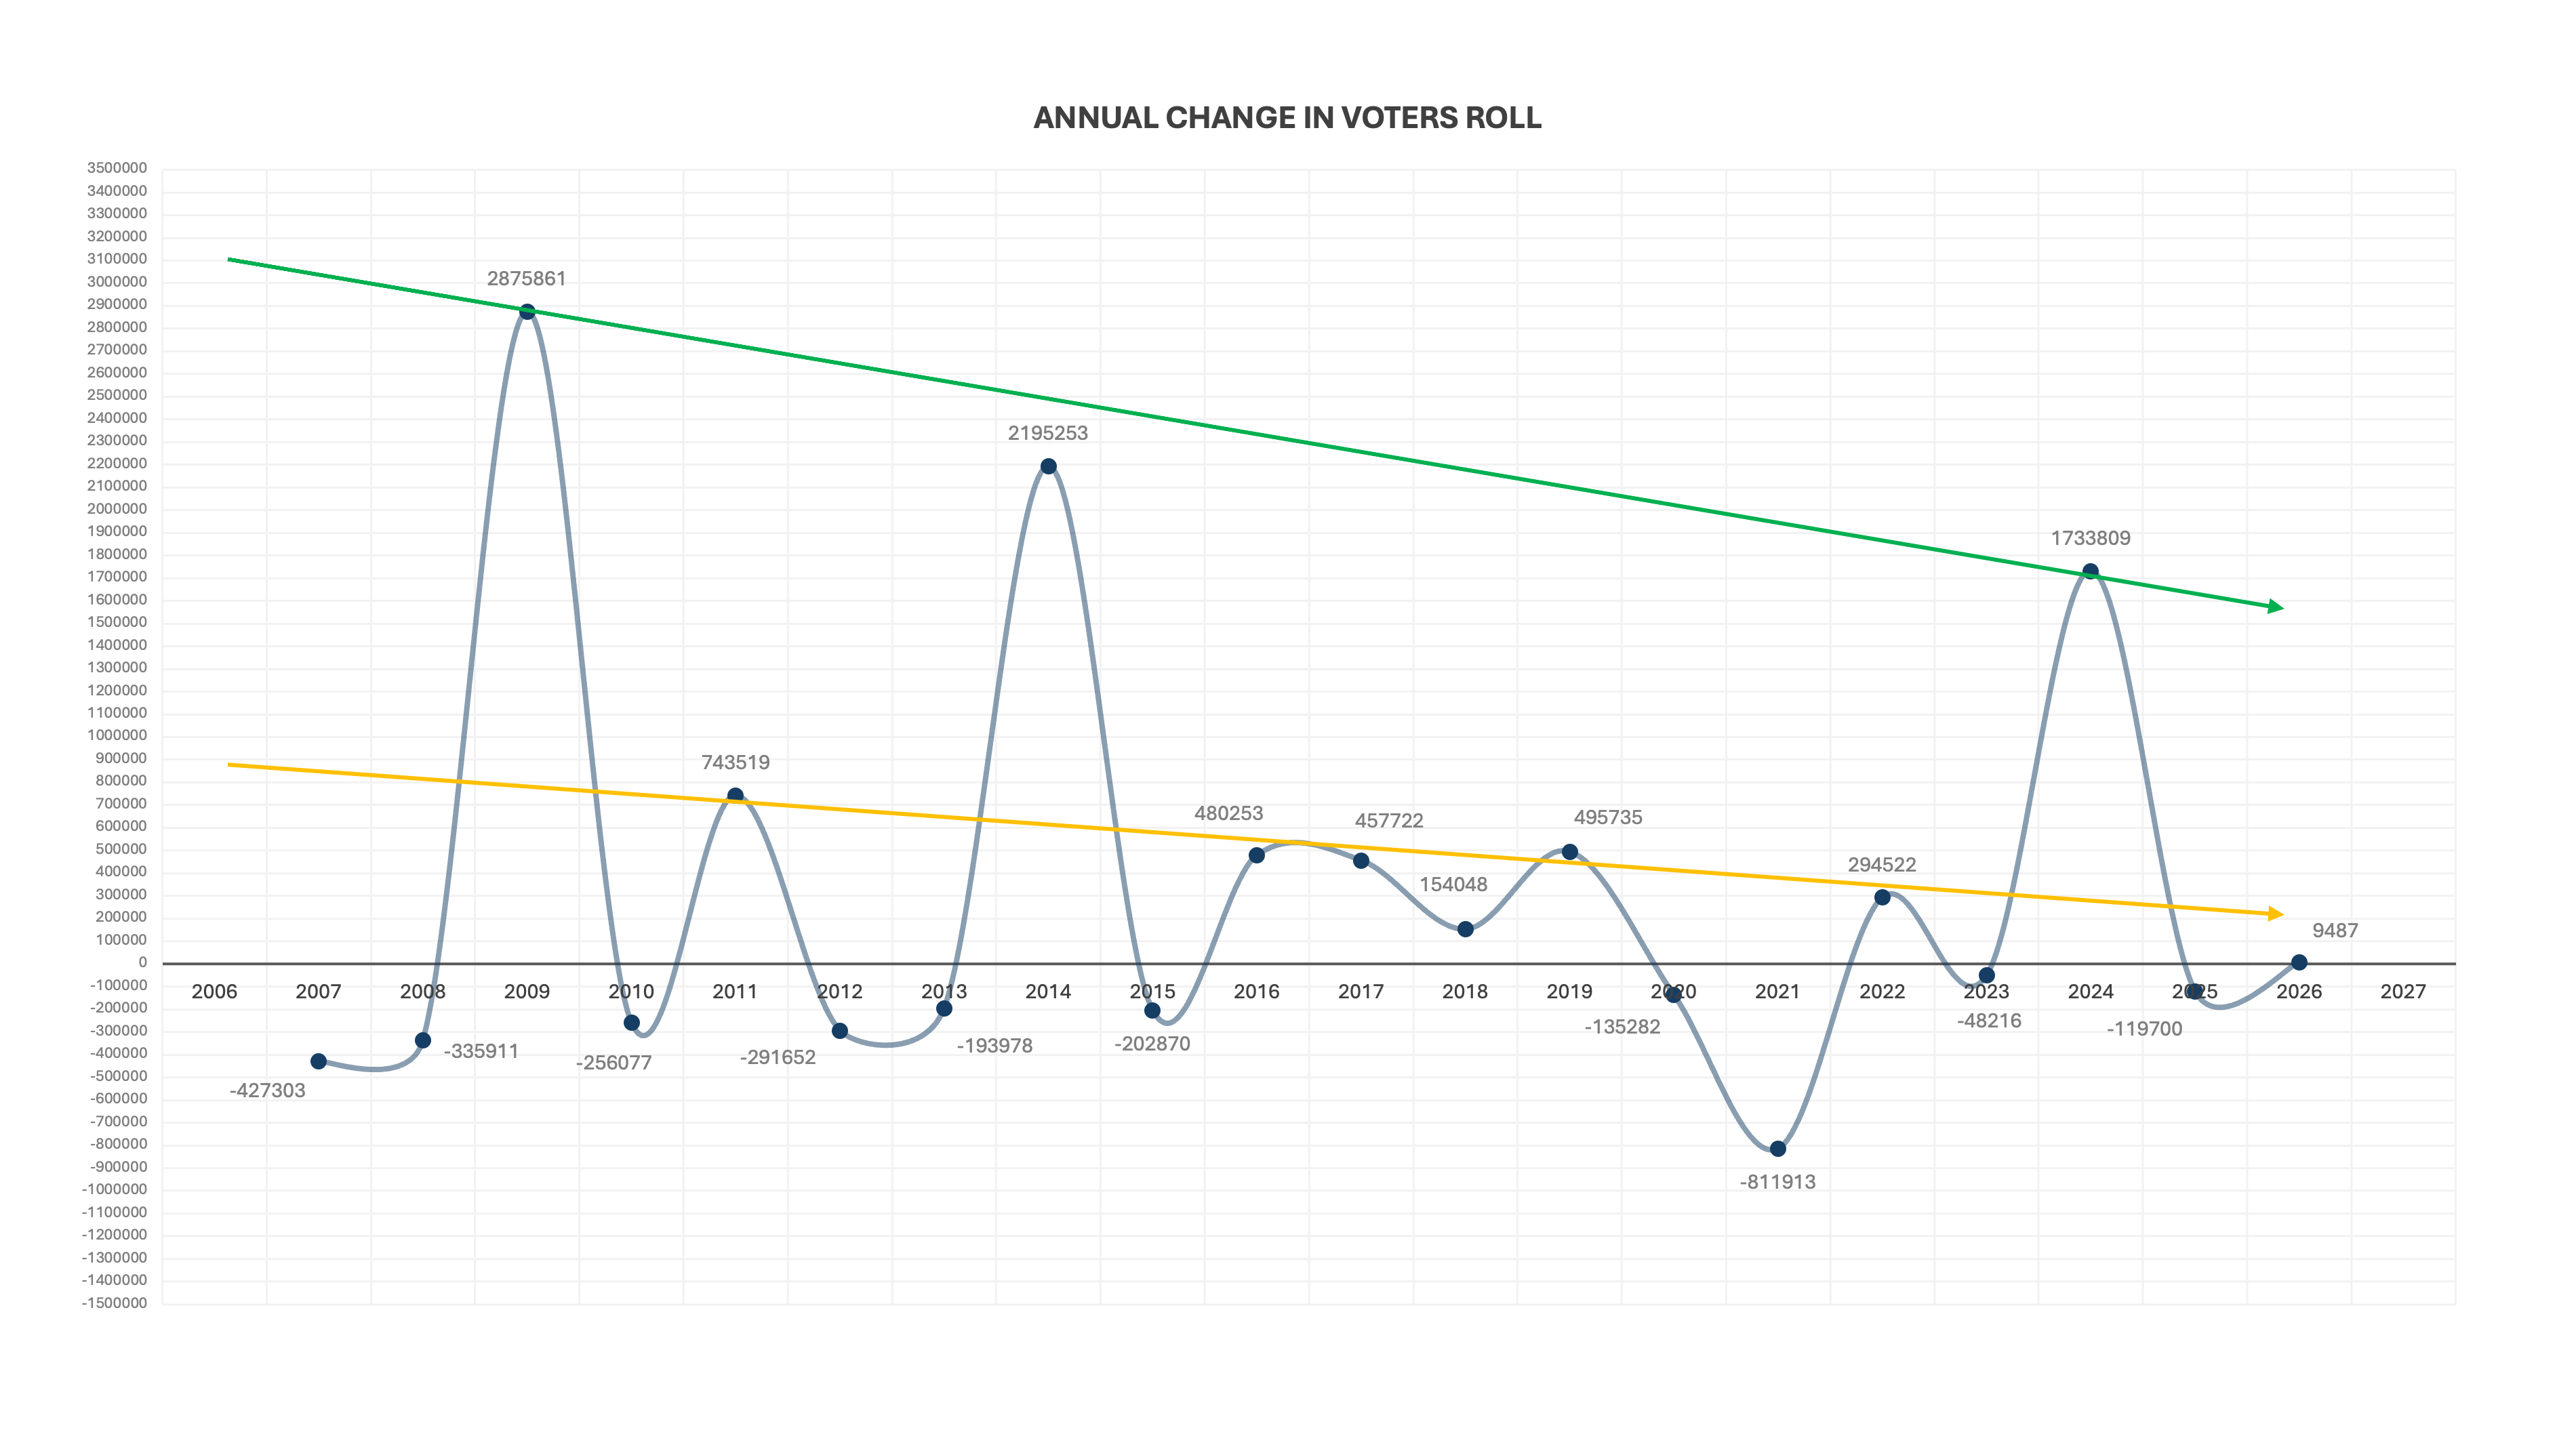
That is a far less encouraging perspective. What we are looking at, is a series of diminishing returns (and, quite frankly, a dismal set of long terms KPIs for the IEC which, Covid not withstanding, constantly pretends it is shooting the lights out).
To replicate 2016, the voters roll is going to have to spike significantly this year, and that spike is going to have to be driven by the opposition. If the roll can grow by around 500,000 before the next election, history suggests enthusiasm too will have been meaningfully reinvigorated. That is possible, but a big ask.
Even then, you need registered voters to actually vote, a whole other conundrum, but registration is a start, and our first litmus test for where this election is headed. You can expect millions to spent on registration and registration weekends, and national operations from the likes of the DA unrivalled in the past. So much is going to revolve around those two weekends. They are in many ways, just as important as the election itself.
This essay is the 11th in an on-going series on Election 2026/7, for all other editions of this series, please click here: Election 2026/7
Discover more from inside politics
Subscribe to get the latest posts sent to your email.

You must be logged in to post a comment.