
Election 2026/7 [12] How many votes the DA needs for 50% in JHB [Part I]
by The Editor

This is the first in a two part series, that sets out the methodological ground work for Part II. Here I will establish the numbers and method used to generate plausible 50% scenarios for the DA in Johannesburg. In Part II, I will focus on the outcomes of this process.
How many votes the DA needs for 50% in JHB [Part I]
By: Gareth van Onselen
Follow @GvanOnselen
20 February 2026
This essay is the 12th in an on-going series on Election 2026/7, for all other editions of this series, please click here: Election 2026/7
Introduction
In a recent interview with the Common Sense, Helen Zille said the following: “We are expecting about a million votes in Johannesburg, and you can do the maths: what we need to get close to 50%”. This essay is a response to that comment, and her challenge – “you can do the maths”.
There is one important grand proviso. I am going to assume, when Zille says “a million votes”, she is talking about combined PR and Ward votes. The DA got 247,533 Ward and 235,120 PR votes, for a combined total of 482,653 votes in 2021. So, I presume, she is talking about doubling the DA’s combined vote count in 2026. If she talking about the PR Ballot only (the typical measure of LGE party performance), one million votes is an aspiration so spectacular, one needn’t say more than that, and perhaps wish the party good luck, because rational analysis of that target would be meaningless.
As you can see from the DA’s 2021 performance, PR and ward votes counts are basically same, and percentage wise, wether you use Ward (26.8%), PR (25.5%) or Combined (26.1%), in the big picture it doesn’t matter too much. So we are just going to use the PR ballot, which means we talking about 500,000 votes here (still double the DA’s 2021 performance, which is quite something).
Determining a credible answer is going to require a significant number of calculations. Part I, below, will do that in great detail. I am sure it will be of marginal interest to most people. If it is the raw outcomes you are more interested in, simply skip to Part II. I would, however, recommend reading Part I, if you want to fully understand what you are looking at, in Part II.
That said, to “do the maths”, we need some turnout models. To generate turnout models, we need a few other things first. Let us begin.
Determining the parameters
We need three things to determine the parameters for our calculations. 1. A plausible number of registered voters, 2. A plausible turnout scenario, and 3. a plausible number of votes for the DA, on Election Day.
To generate these things we are going to rely on history and informed intuition. Neither of these are 100% reliable, so bear that in mind. In turn, the goal here is not to predict the future with absolute certainty, but to create some reasonable scenarios, and see what numbers they produce, as a guide to what is and what is not possible, when it comes to the DA’s prospects in Johannesburg.
1. A plausible number of registered voters
As of writing (3 February), the voters’s roll in Johannesburg stands at 2,315,372. That is 94,662 more registered JHB voters than were certified for the 2021 local government election (2,220,710).
This is what the JHB voters’s roll looks like, since 2000:
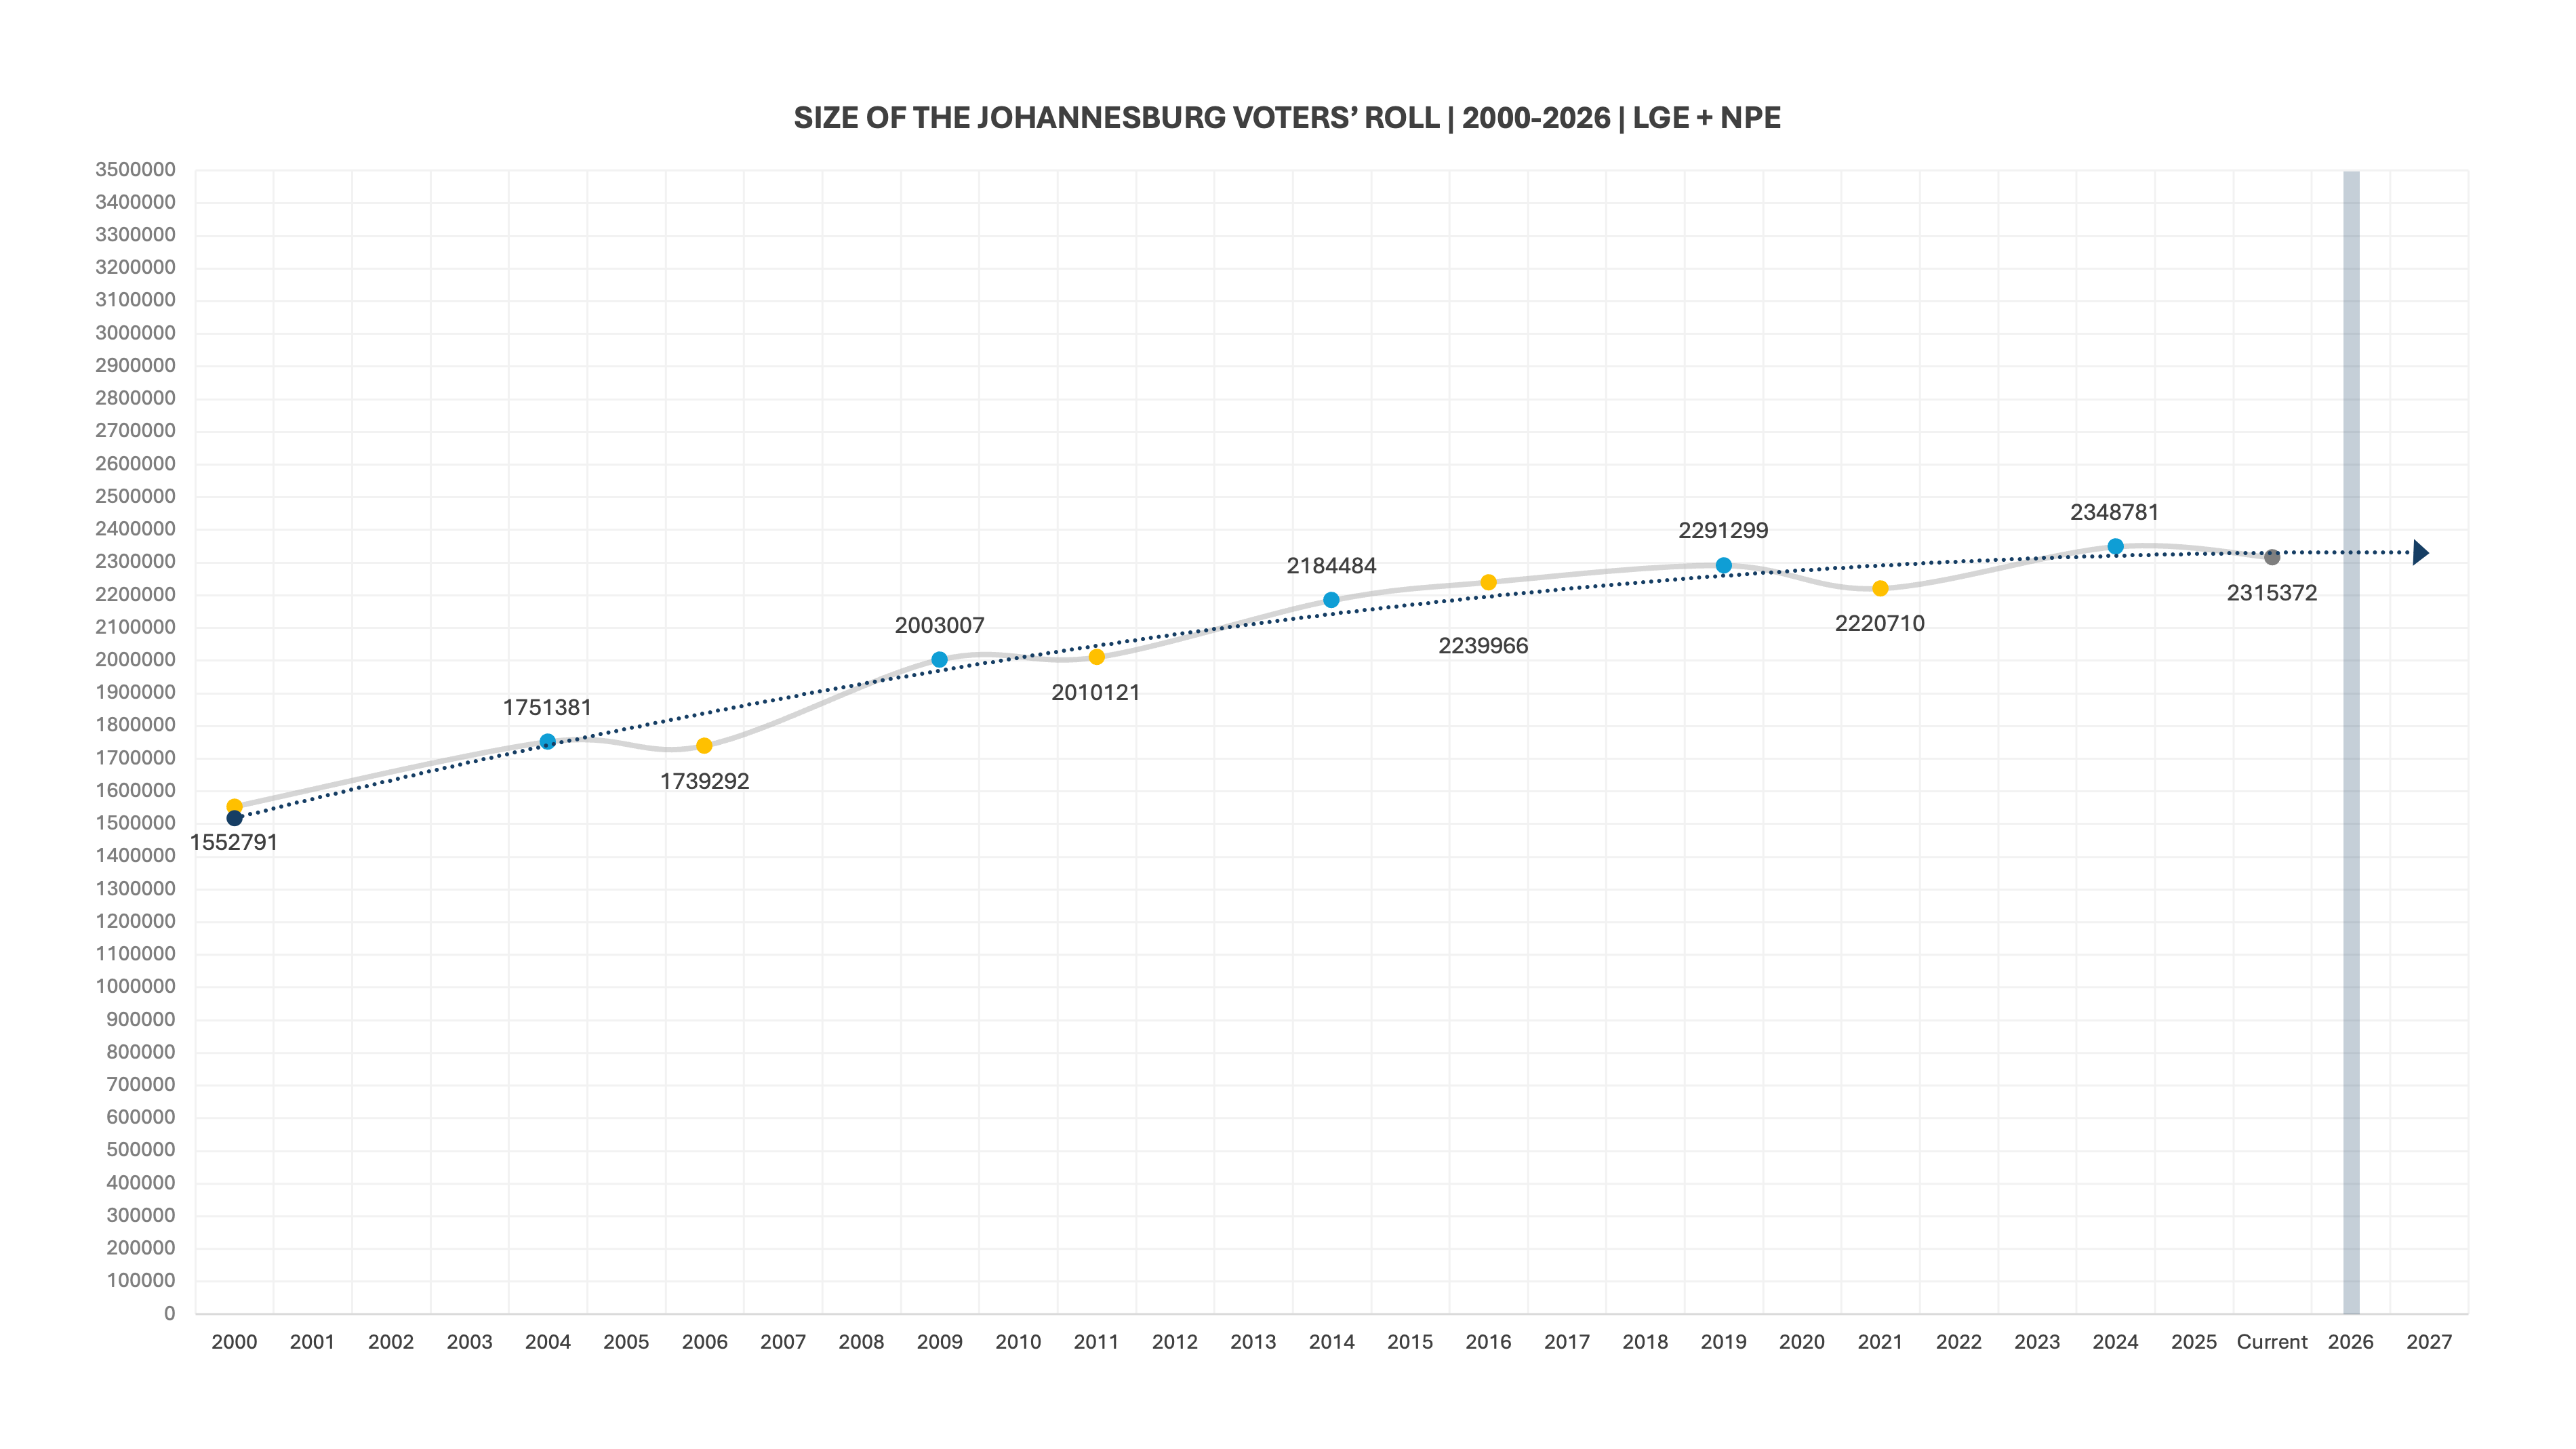
But, as with the national voters’ roll, if we look at it in terms of change – election-to-election – the view is less encouraging:
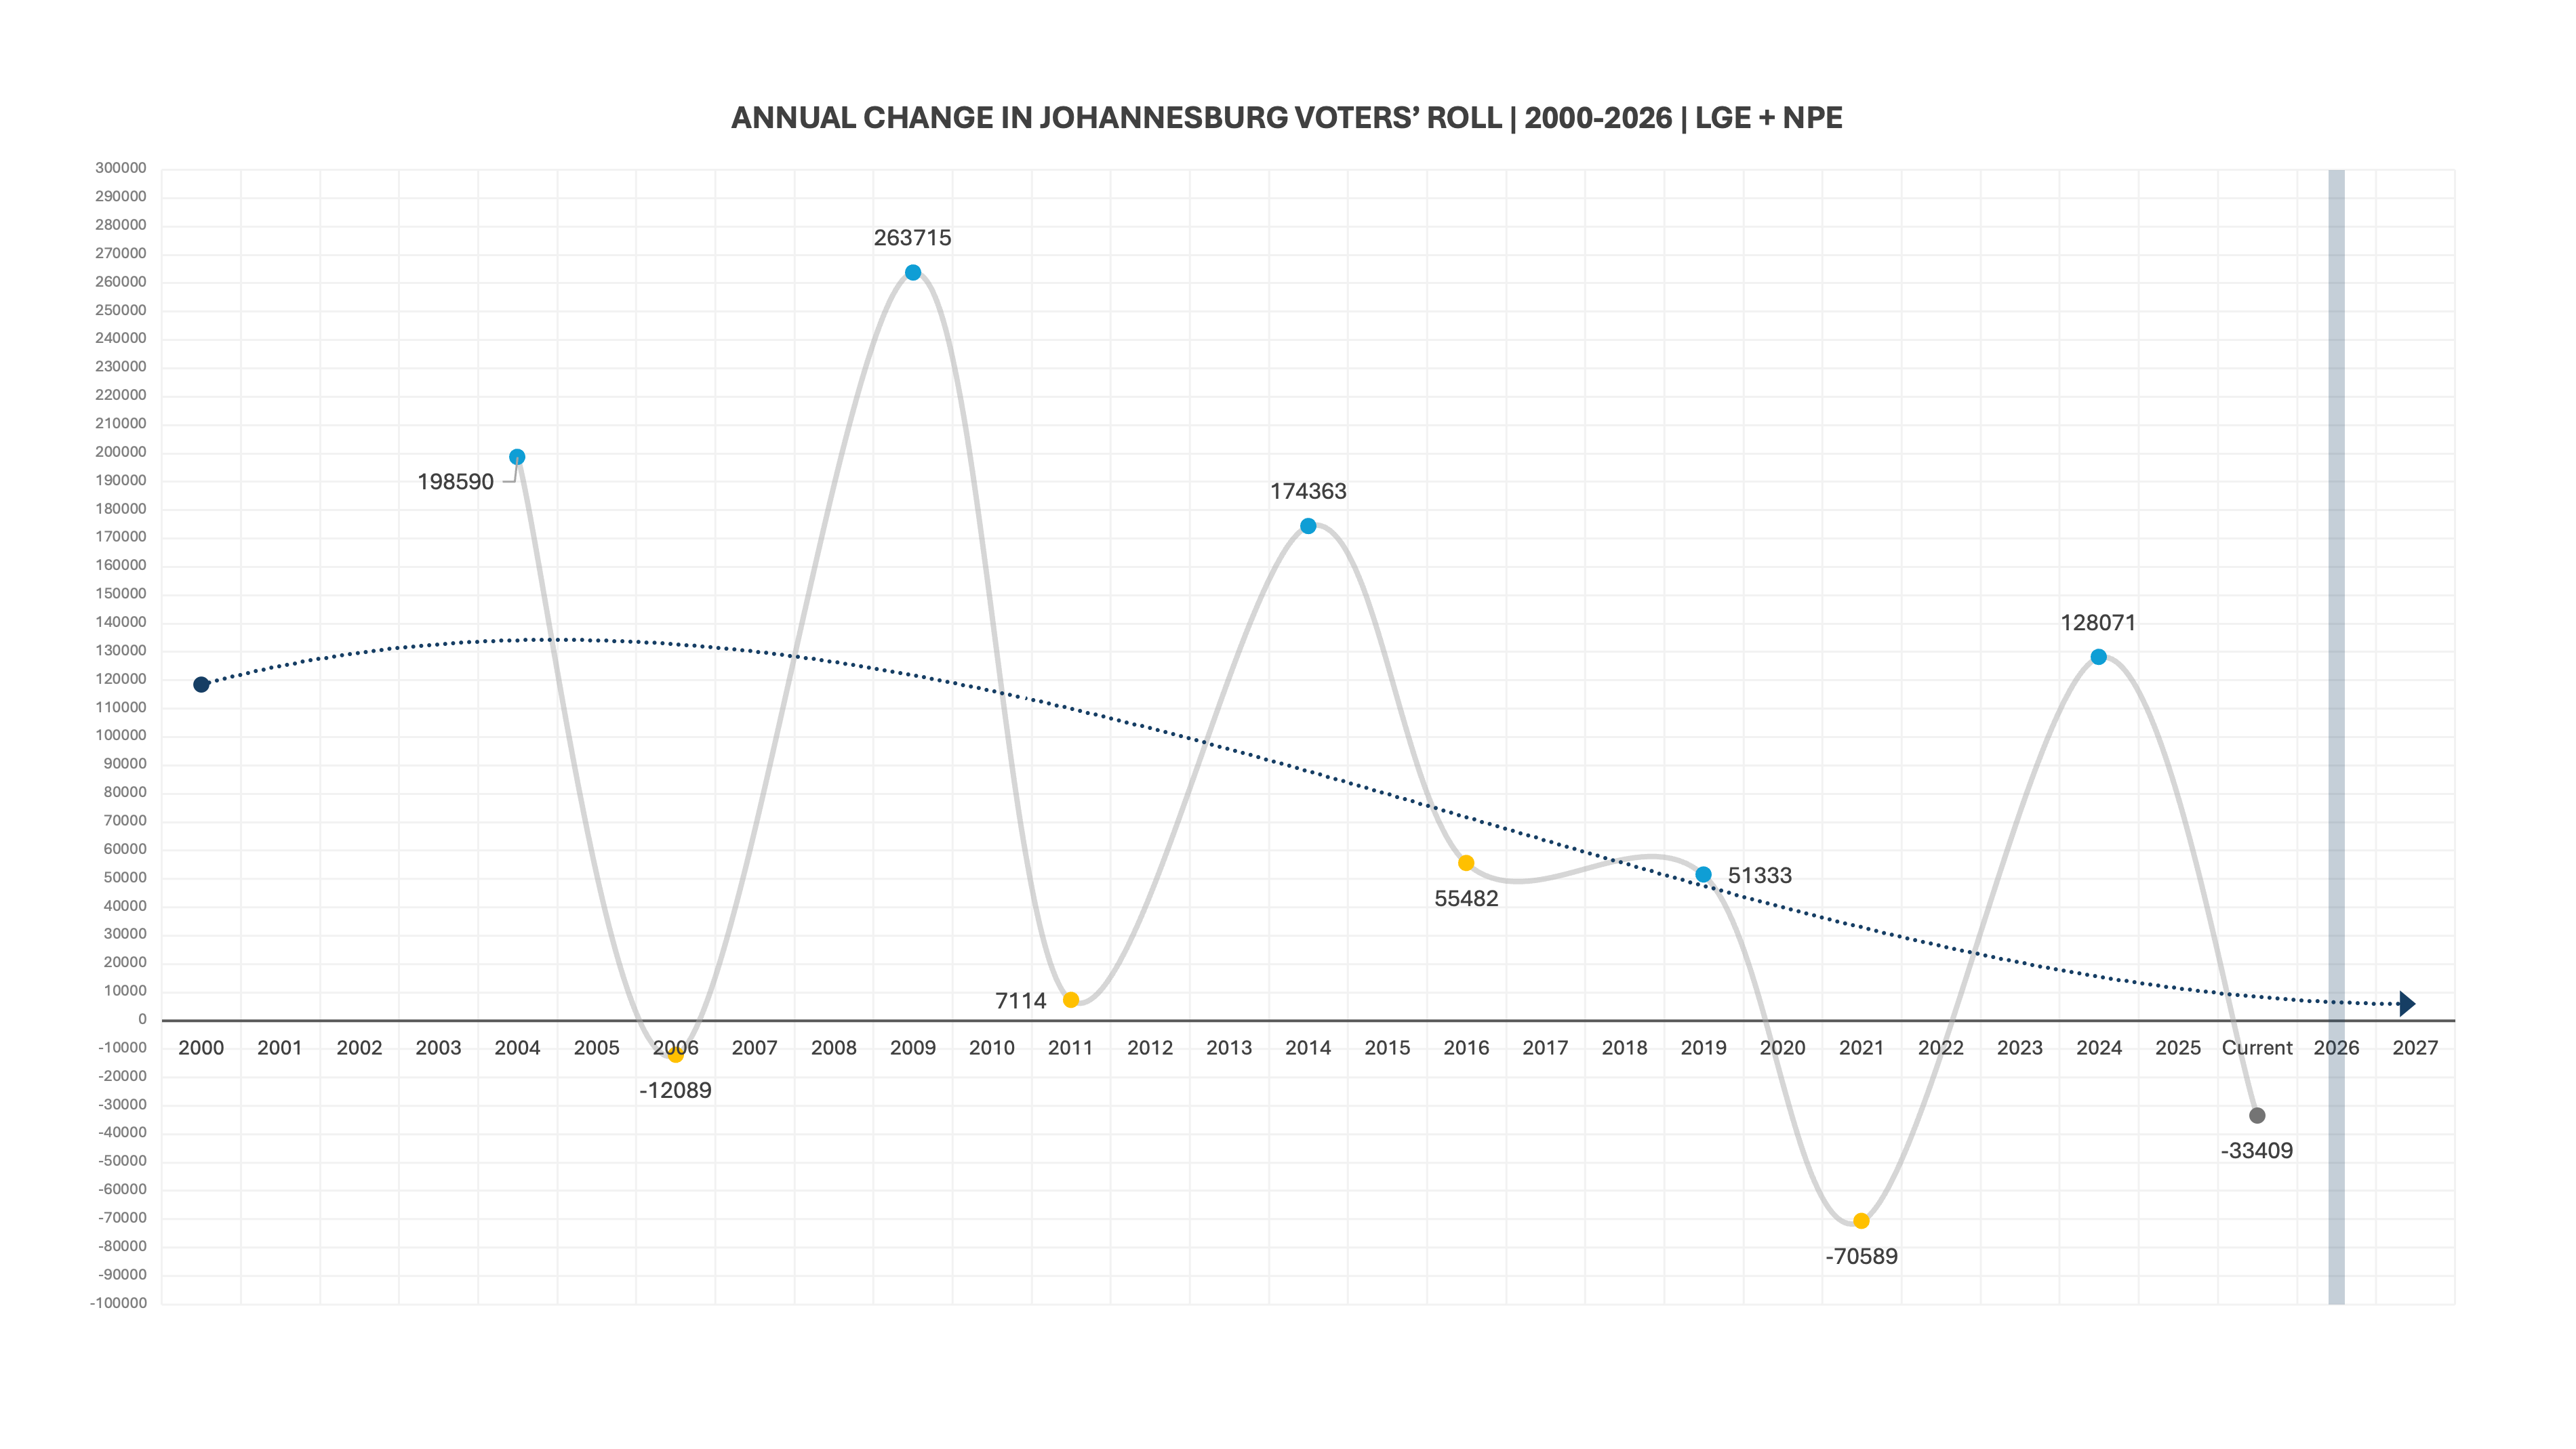
The current total (2,315,372) is up from 2021, but down from the last national and provincial election, in 2024. This happens after every national election, but the current total is way below past, “healthy” LGE totals (2006, 2011 and 2016 – ignoring 2021, which was impacted ted by Covid). This is the furthest it has dropped, and seems to still be headed downwards. Nevertheless, it is still above 2021 and, with registration weekends to come, that trend will reverse at some point. As far as the DA is concerned, the sooner the better.
But let us assume any further drop will not be dramatic, and thus confirm our first number: a baseline of 2,315,372 registered voters (the current total). Let us also assume this situation will improve. By how much we do not know, so let us create a reasonable spread:
- Baseline (2,315,372)
- Baseline + 20,000 new voters (2,335,372)
- Baseline + 40,000 new voters (2,355,372)
- Baseline + 60,000 new voters (2,375,372)
- Baseline + 80,000 new voters (2,395,372)
- Baseline + 100,000 new voters (2,415,372)
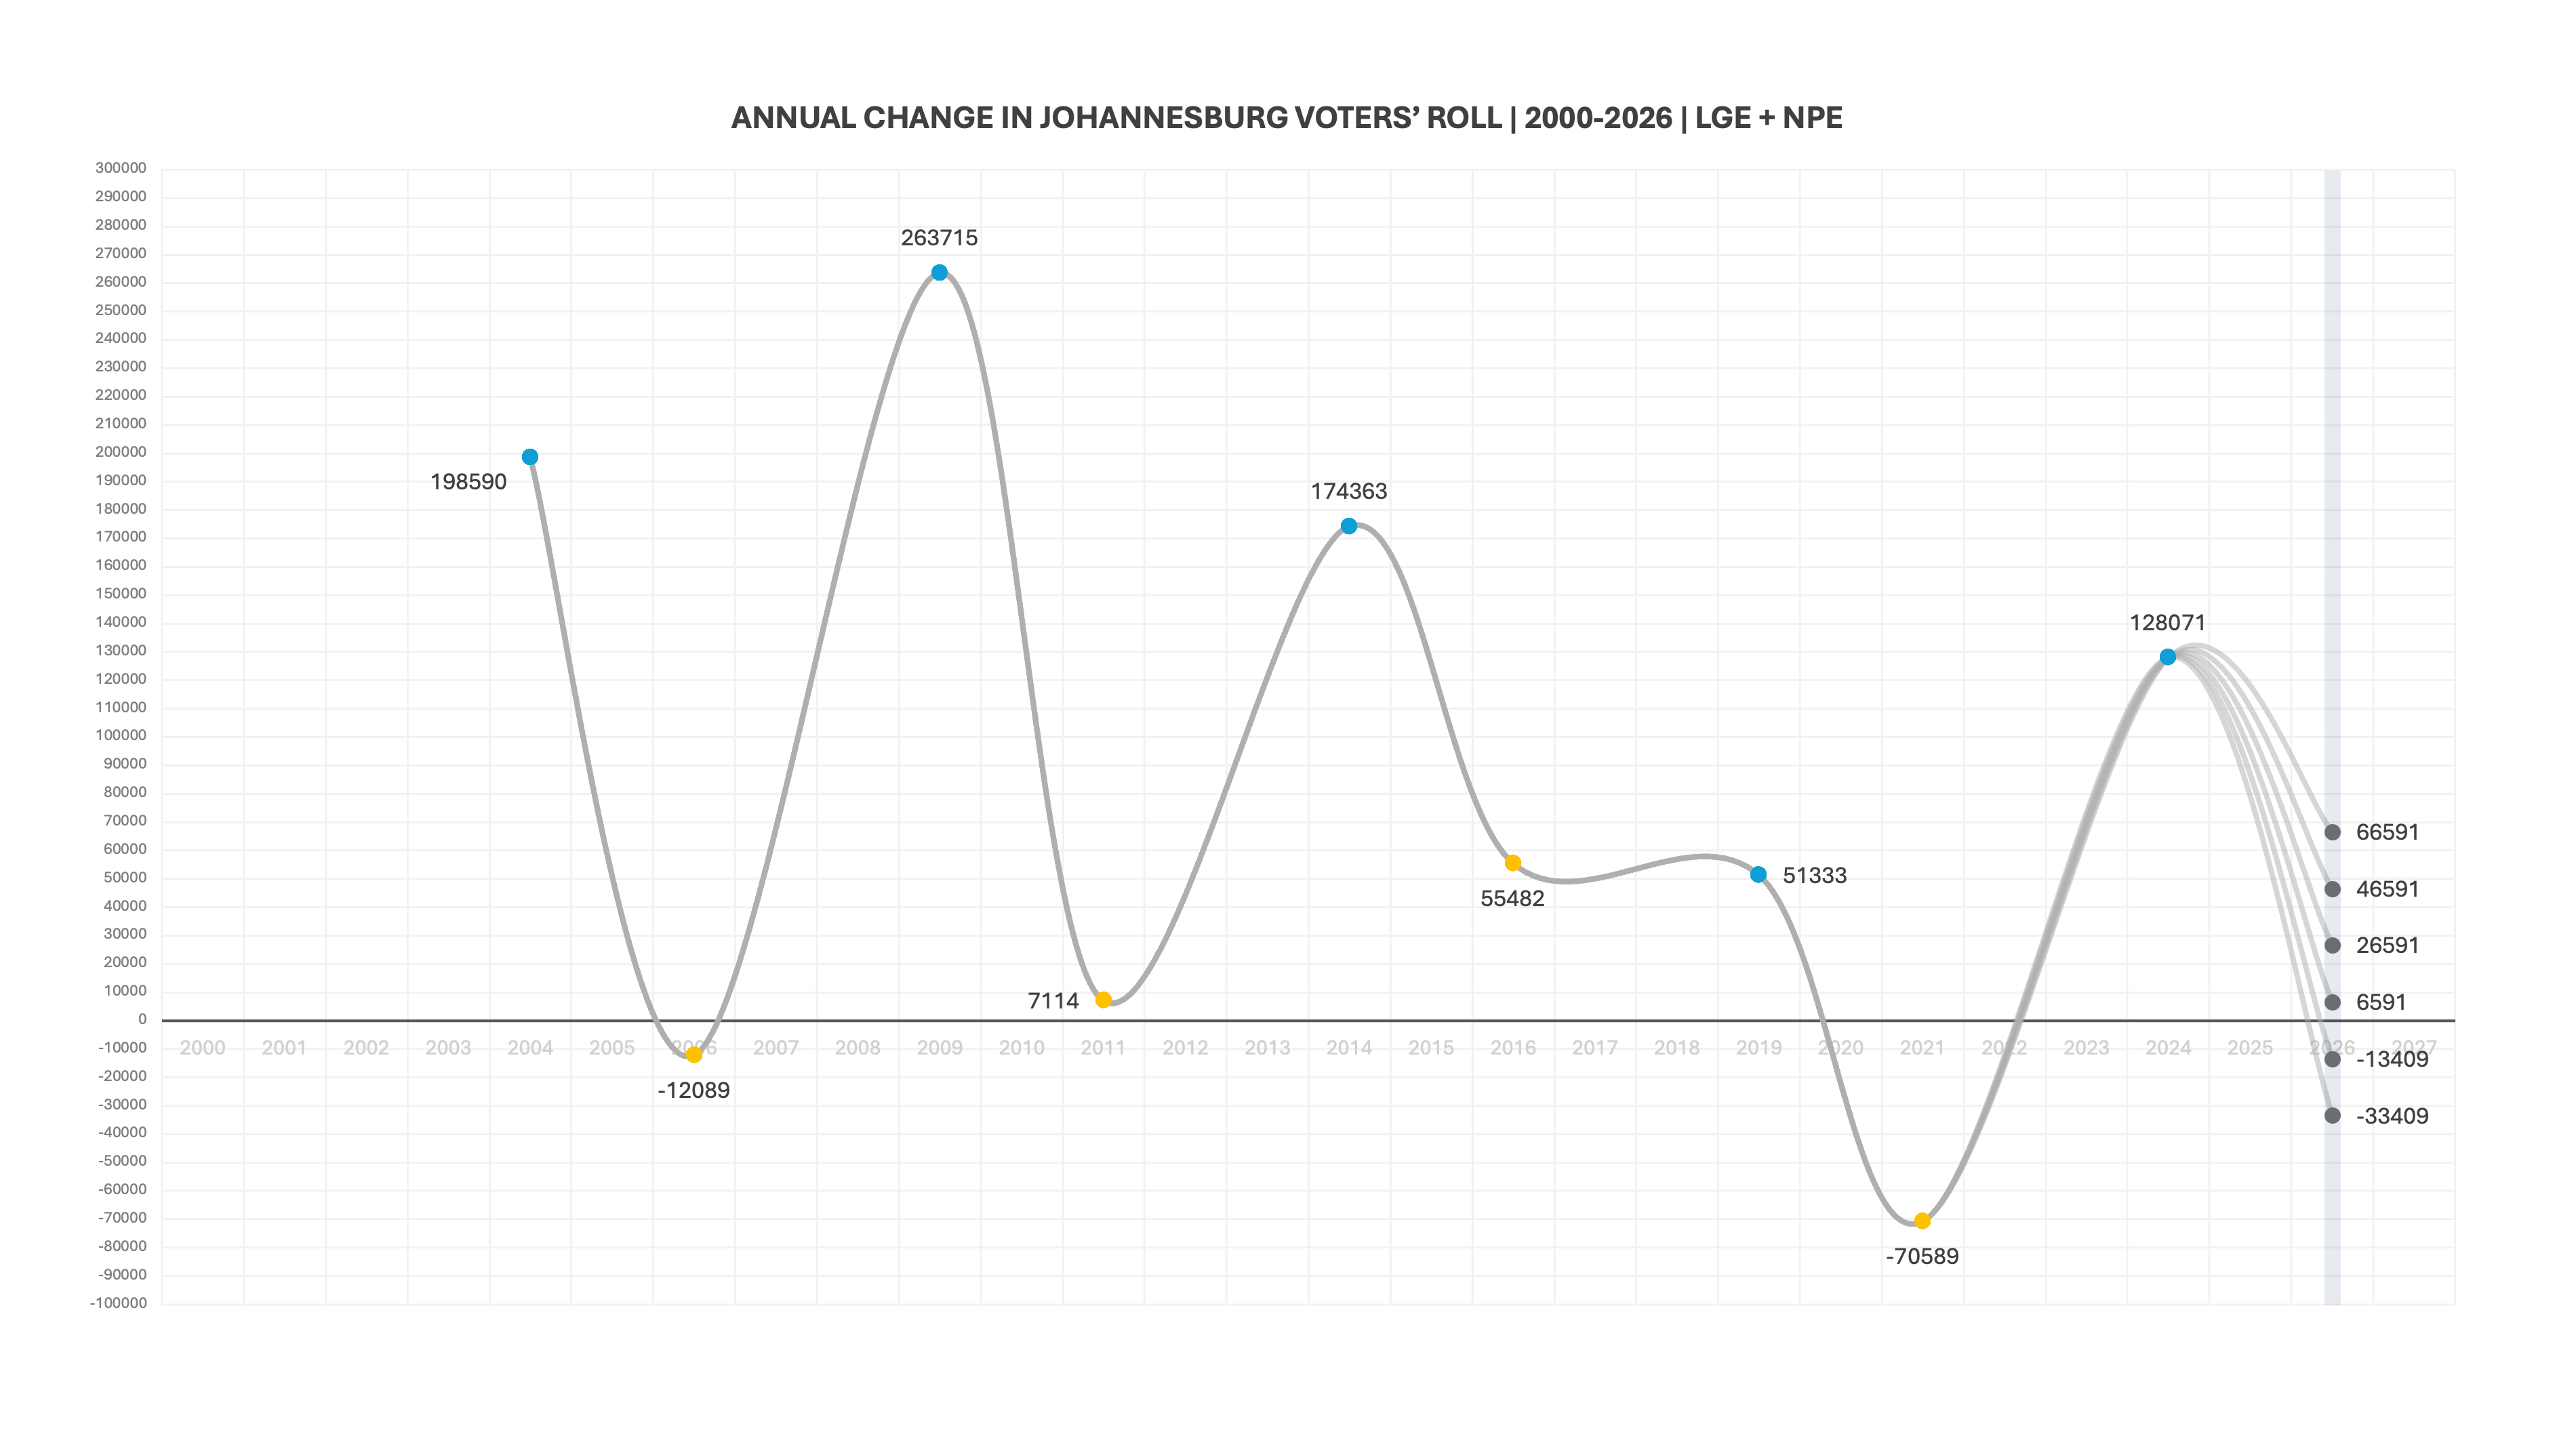
Just to explain what those scenarios mean. In scenario 1 (or below), registration is a disaster, and the current figure holds. The voters roll grows by 0. In scenario 6 (or above), registration is wildly successful, and enthusiasm levels rise even above their 2016 peak. The voters roll grows by 100,000 new registrations. The rest scale from 1 to 6.
These six scenarios will form the basis of six turnout models we will build.
2. A plausible turnout scenario
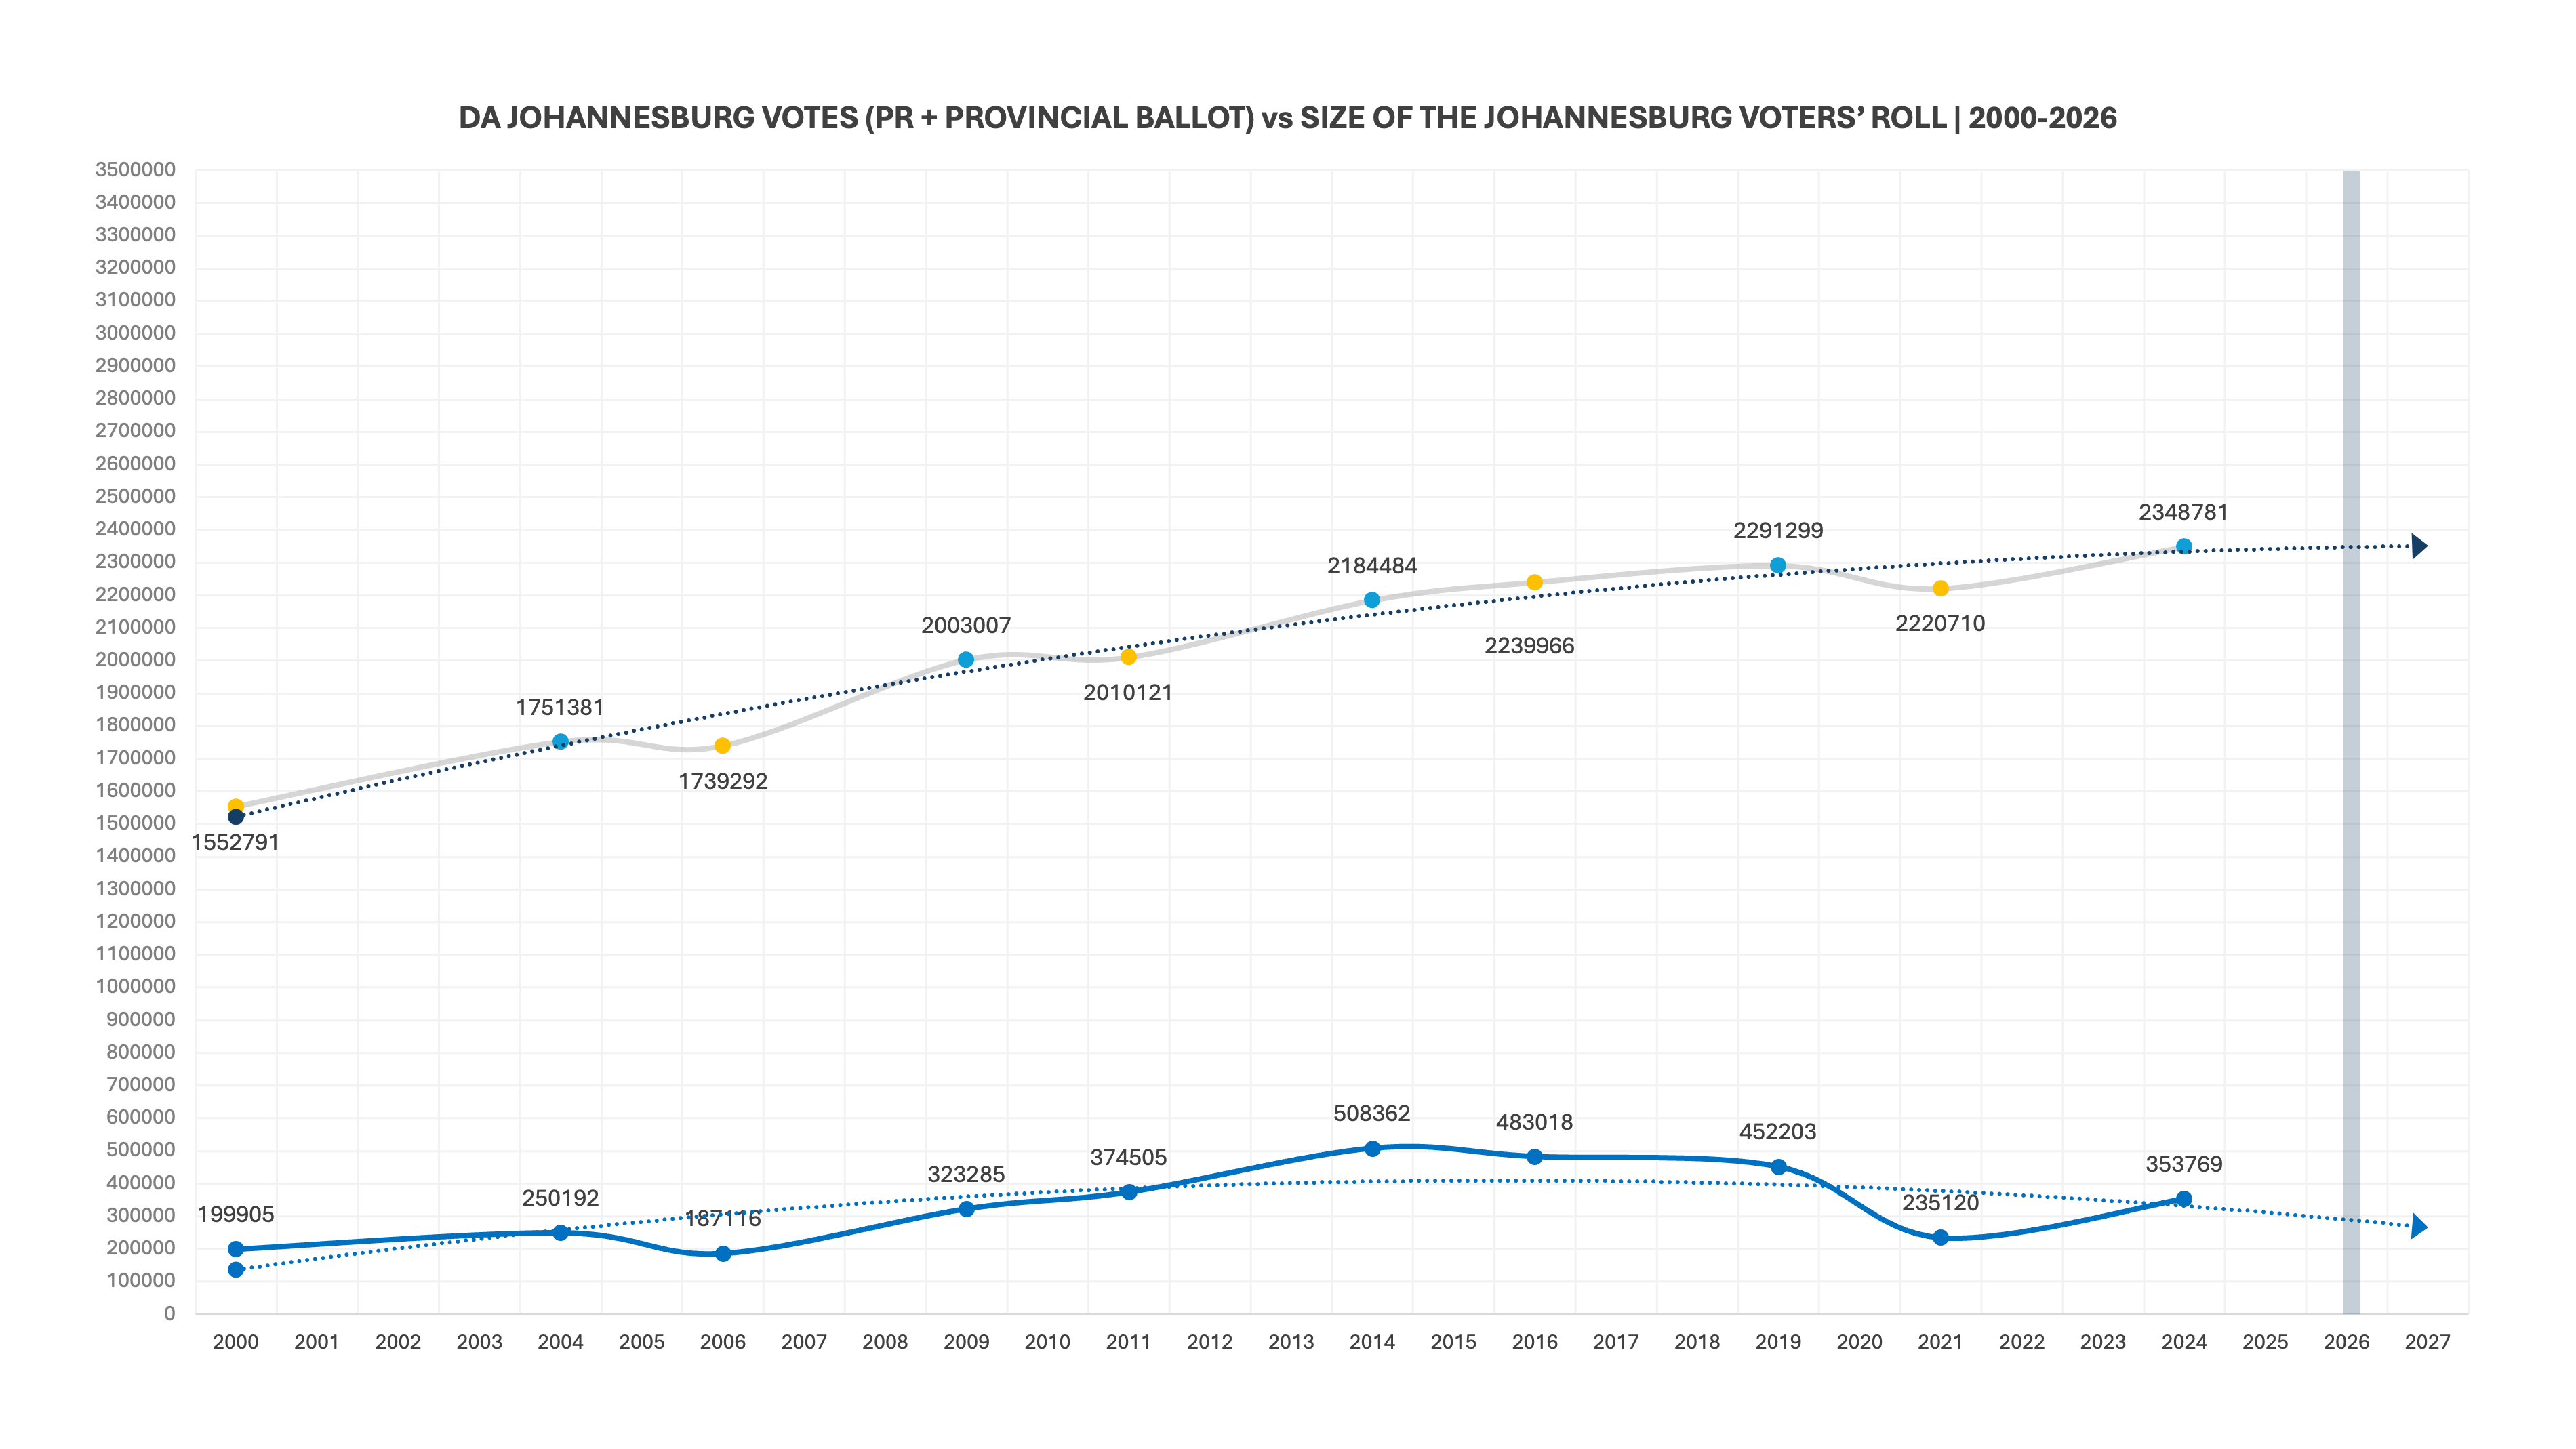
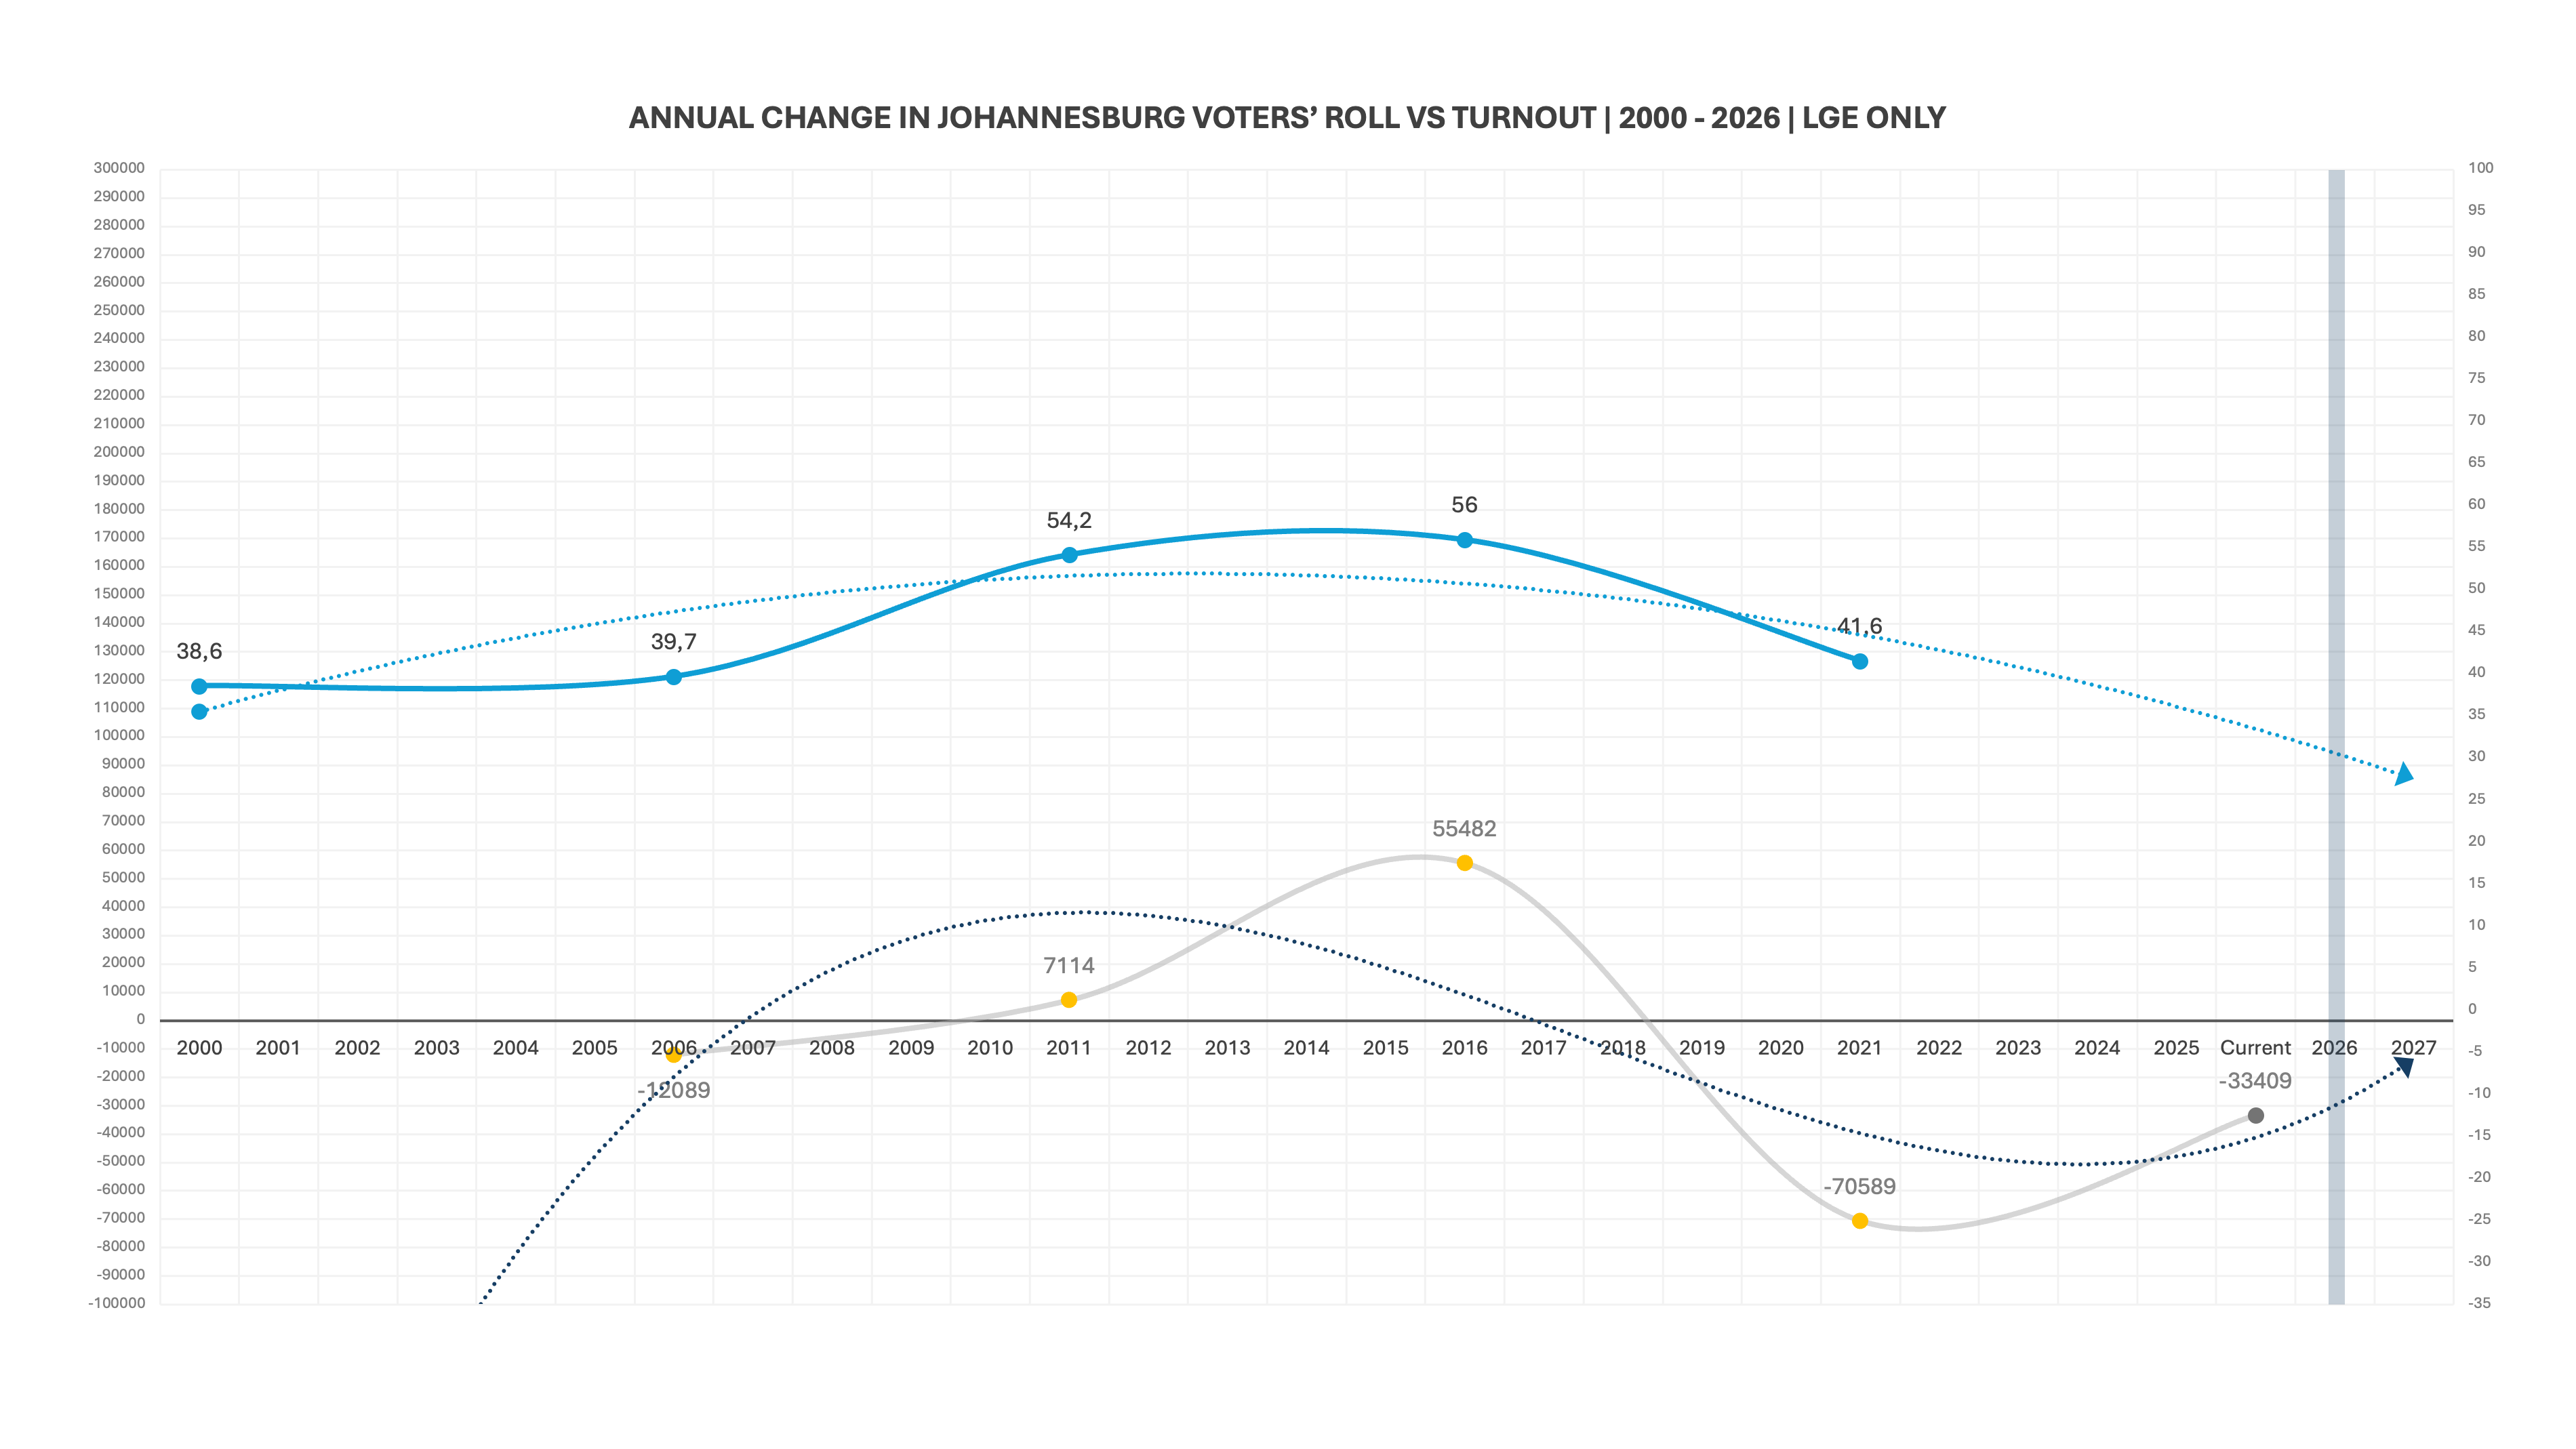
Here is Johannesburg’s turnout (on the PR and provincial ballot), over time and mapped against changes in the voters’ roll:
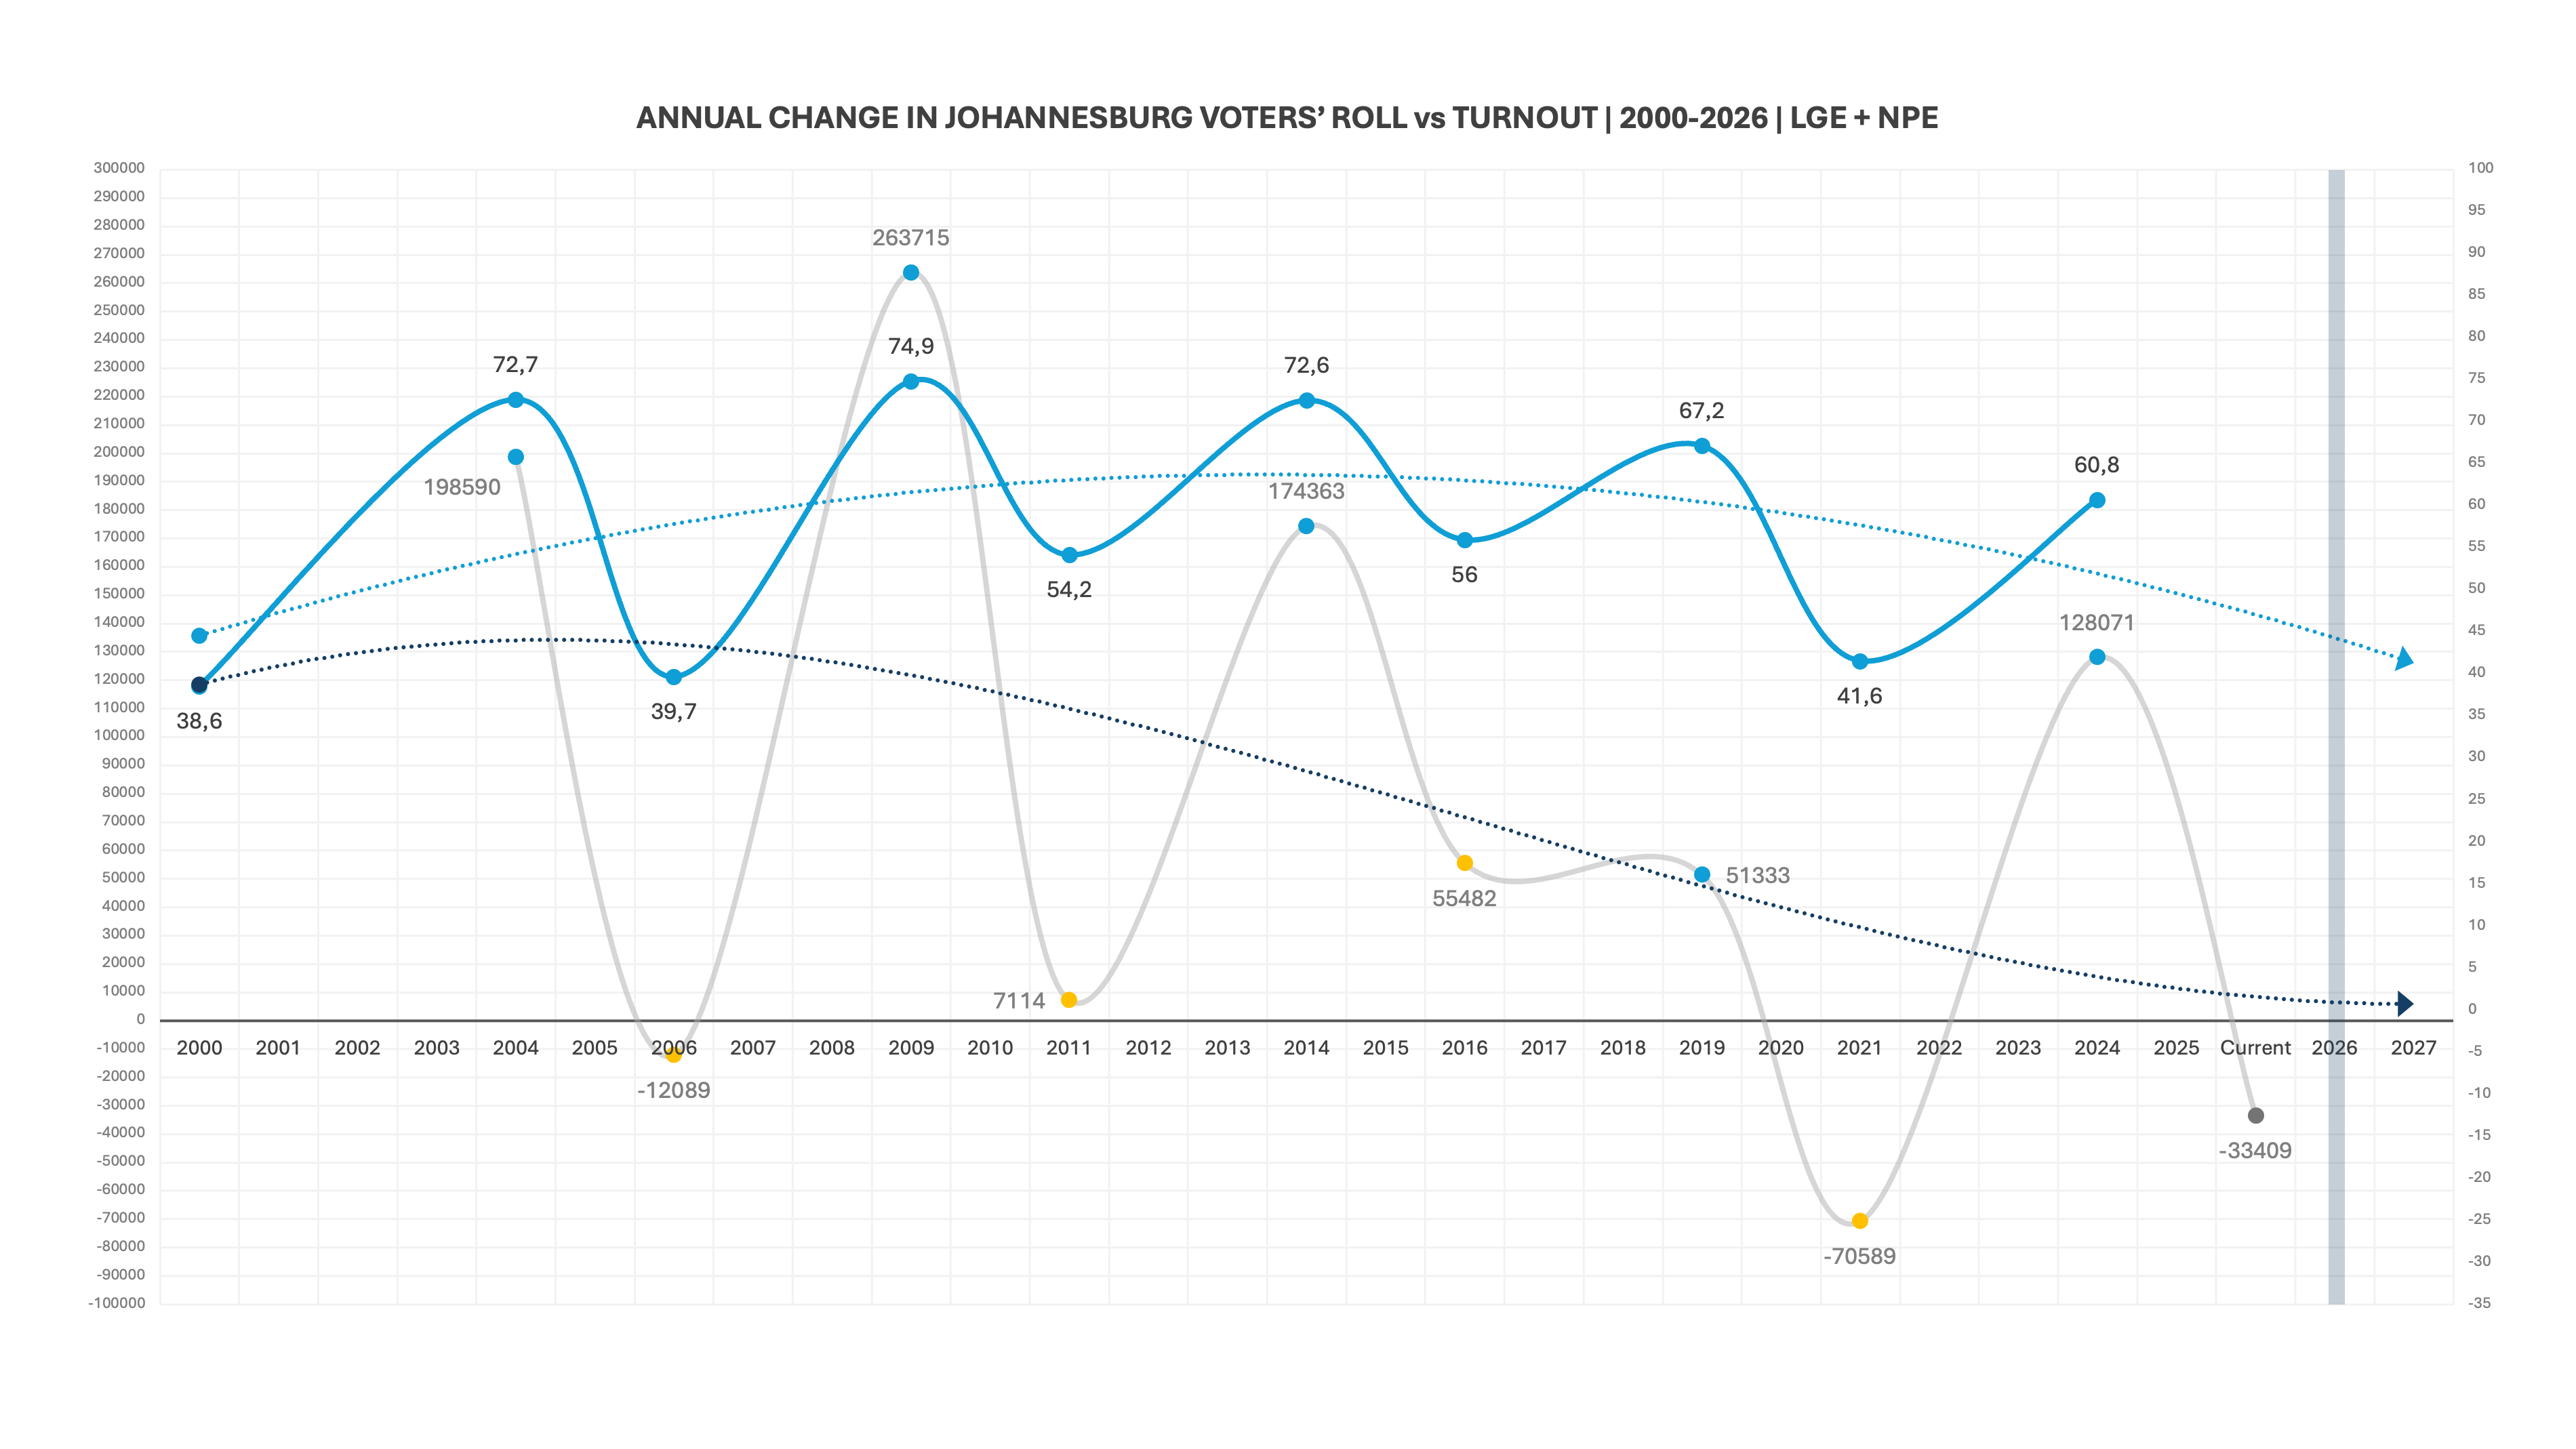
(In case you are interested, here is what that graph looks like with only LGEs results, and NPE results removed.)
Of all indicators, turnout is the most difficult to forecast. In the last local government election it dropped 14.4pts (from 56% in 2016 to 41.6% in 2021), which was staggeringly low, even taking into account Covid. Up until that point, like the voters’ roll, things were looking incredibly positive for LGEs: turnout was climbing (39.7%, 54.2% and 56%) and the roll was growing (-12,089, +7,114, +55,482). But from 2019 onwards, it all went horribly wrong.
The 2024 NPE saw some semblance of normality resume, and while the general trend is downward, this does give us sound reason to cater for an improvement in turnout, in 2026.
Turnout in the last, 2021 LGE was 41.6% in JHB. Let’s then be really comprehensive here, and cover everything from a potential turnout of 30% (in other words, catering for the possibility that turnout declines dramatically further, by around 11pts), to 50% (in other words, catering for the possibility that turnout improves dramatically, by around 9pts, and the trend is reversed). That spread would look like this:
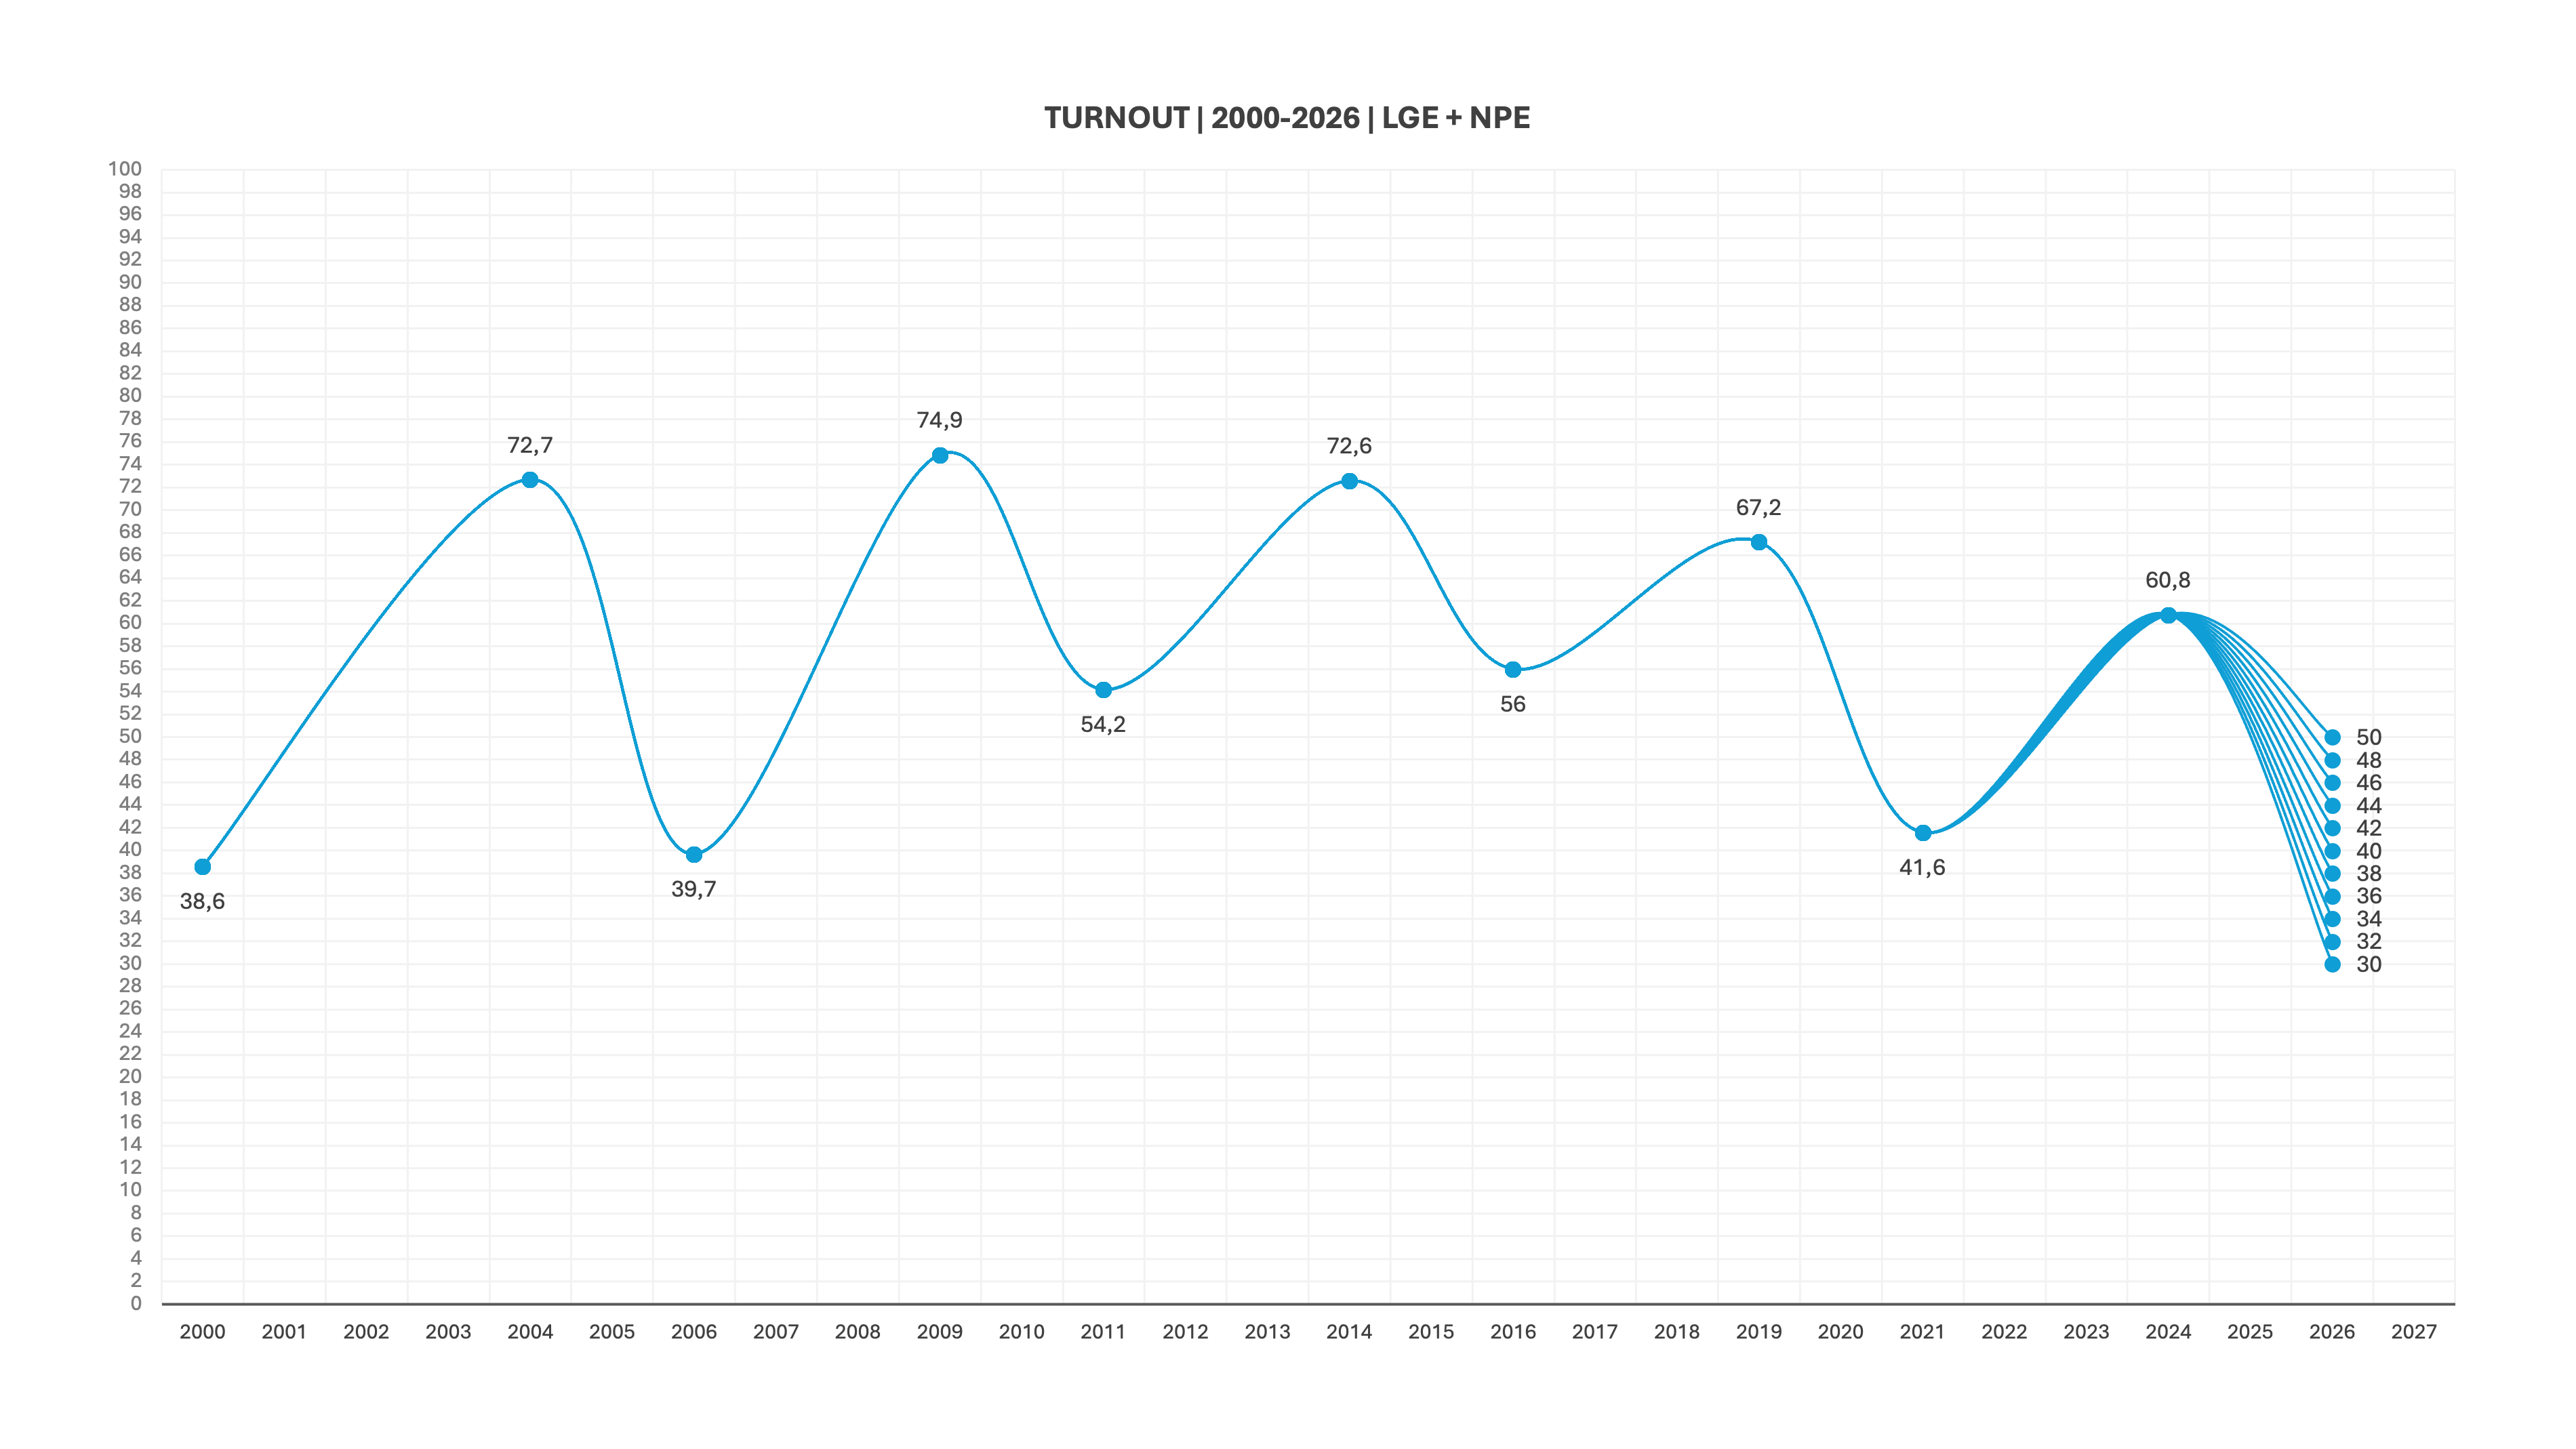
I have indicated that spread in 2pt gaps on the graph above (otherwise it gets too cluttered), but for our model, we will use 0.5pt gaps.
3. A plausible number of votes for the DA
Here is the total number of votes the DA has achieved in JHB since 2000 (using the PR and provincial ballot). Notice how closely the DA’s performance mirrors the voters’ roll trend-line.
As with the voters’ roll, the DA will be encouraged by the 2024 uptick. And, as with the voters roll, viewing the change in the DA’s vote share over time, is more insightful:
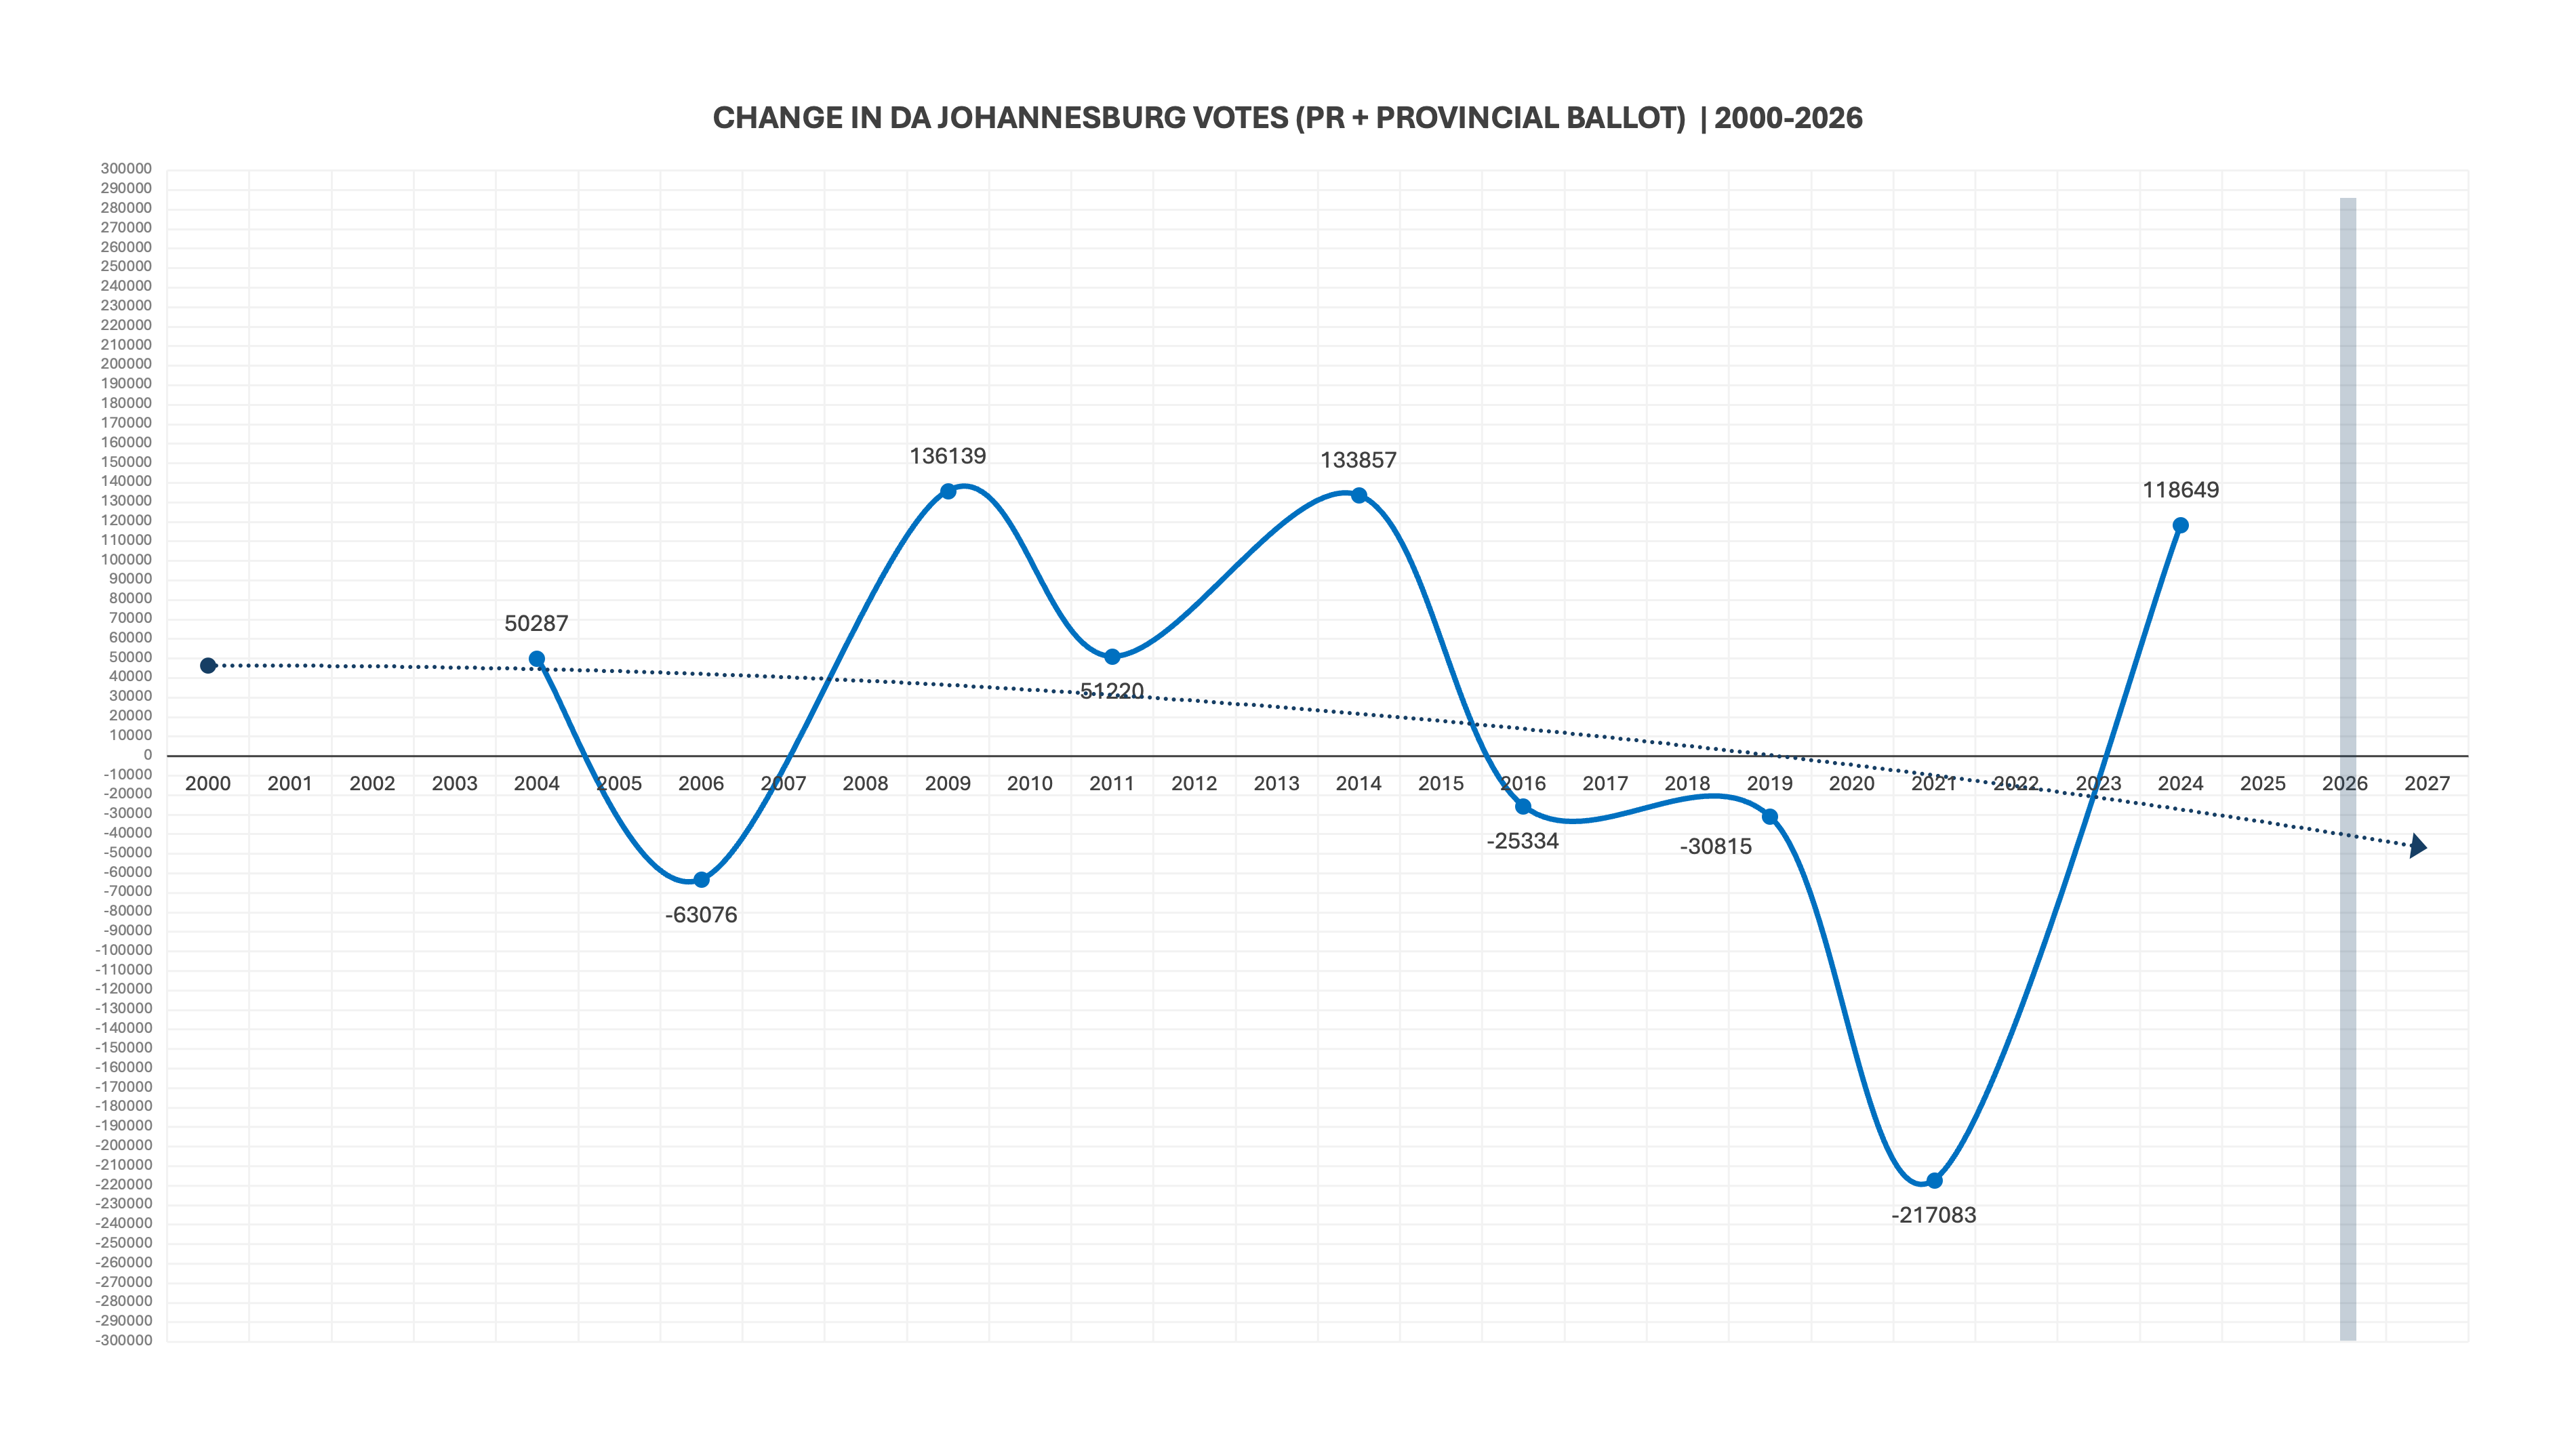
The first thing worth noticing here is that in every LGE, the DA has secured fewer votes than in the preceding NPE. Even 2016, which was a triumph for the party, saw it record fewer votes than in 2014. Putting aside the Covid infected 2021 election, once again 2024 suggests a return to a more normal pattern. Together with the depth of the 2021 decline it not all negative, it allows us to assume there is a substantive pool of voters who might return. If the DA does exceptional well at drawing them back in, perhaps it may even, for the first time, exceed its previous NPE result (which was very poor).
So, let us again cover all eventualities, and give the DA a potential vote range from 200,000 to 600,000. If we plot those possibilities, at increments of 50,000 votes, we get the following:
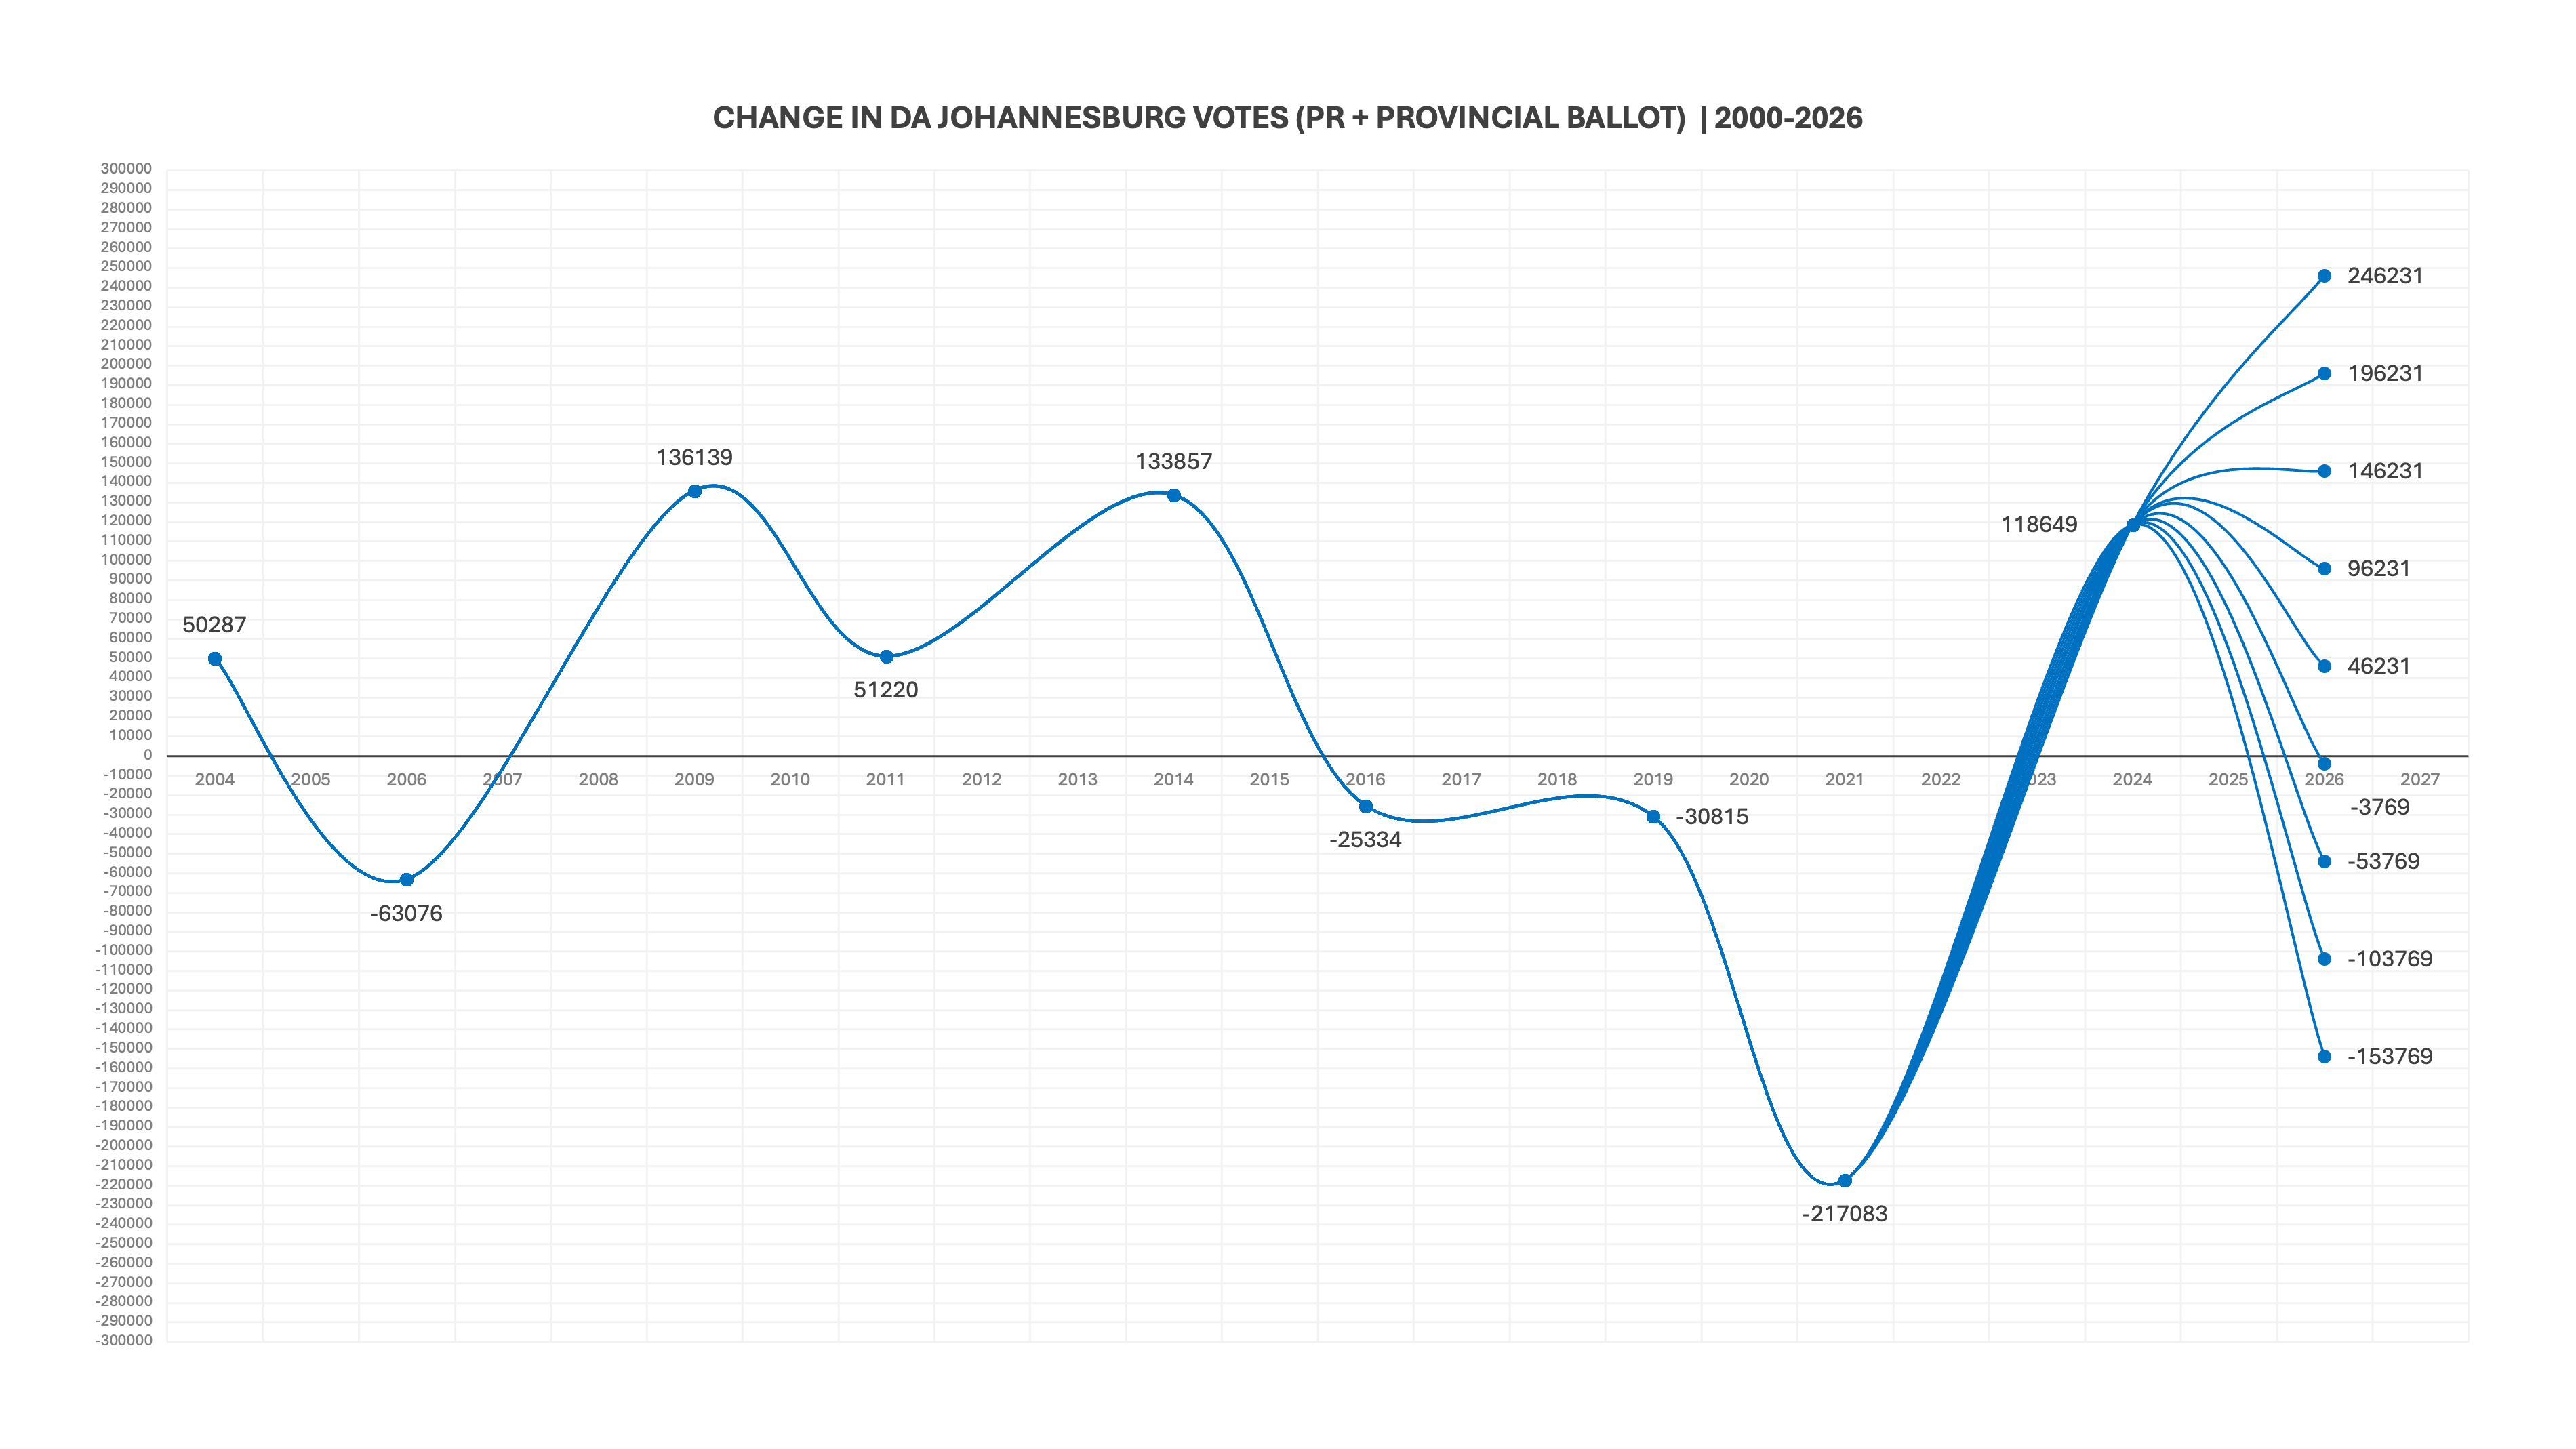
That is a very generous spread, that covers the outside chance of a DA decline as well as the outside chance of the DA making an impact that rivals the likes of MK’s KZN arrival in 2024.
As with turnout, the actual increments we will use in our models will be smaller: 5,000 votes per step, which will give us far more accuracy.
We now have everything we need: A credible set of registration numbers, turnout levels and DA votes. Somewhere in there, barring a complete outlier event, is the DA’s 2026 election result. Let us generate the six models and see what they look like.
The turnout models
Well, after all that build up, they look like Excel spread sheets. I am not going to load all six here, but I will load the baseline model, and explain how it works. Here it is:

Down the left hand side run the DA vote scenarios (200,000 at bottom; 600,000 at top, in increments of 5,000 votes). Along the very top run the turnout levels (50% on the left, down to 30% on the right, in increments of 0.5%). Below that line, also on the top, is the number of valid votes that would be cast for this model. This is the baseline model, so it uses at total registered pool of 2,315,372 (the current IEC total for JHB) to calculate the total valid votes for each turnout level.
So, the first thing we should do, is highlight where 50% sits on this model. It is highlighted below:
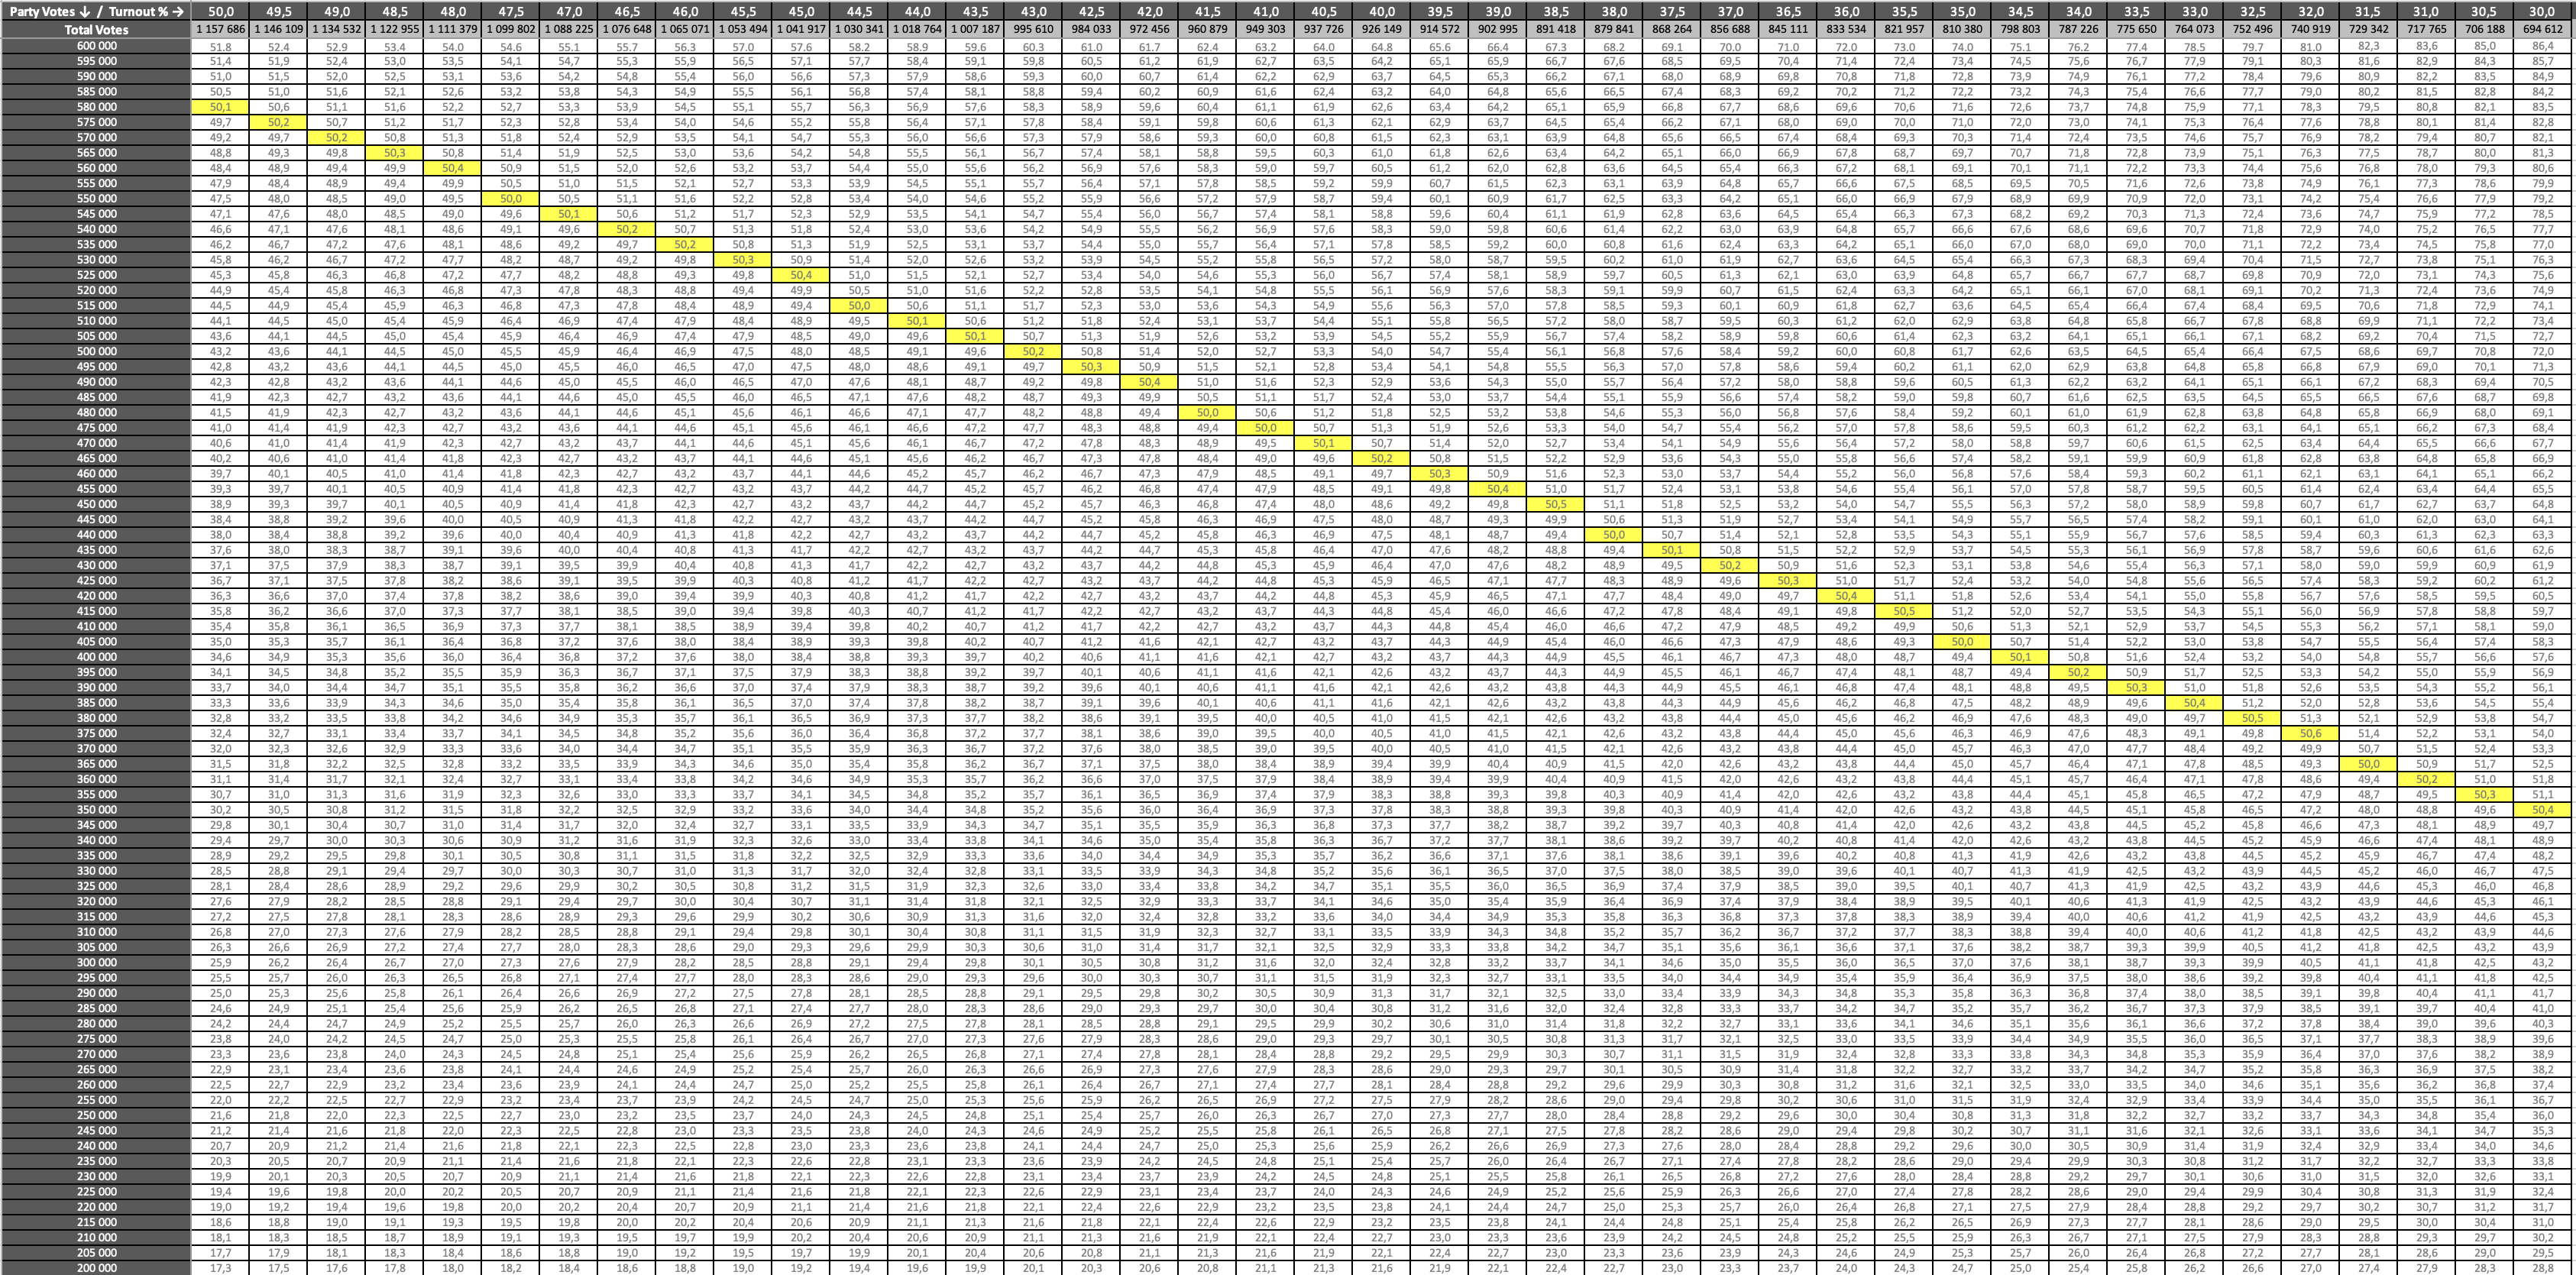
In every possible scenario below that yellow line, the DA gets below 50%, in every one above it, it gets 50%.
Let us now explore a scenario. As the model assumes poor registration, let its also assume turnout drops, to 38%. As a result of both these things, the DA achieves less than its 2024 result, and ends up with 300,000 votes on the day. What percentage will it get? Let us highlight those options and see:
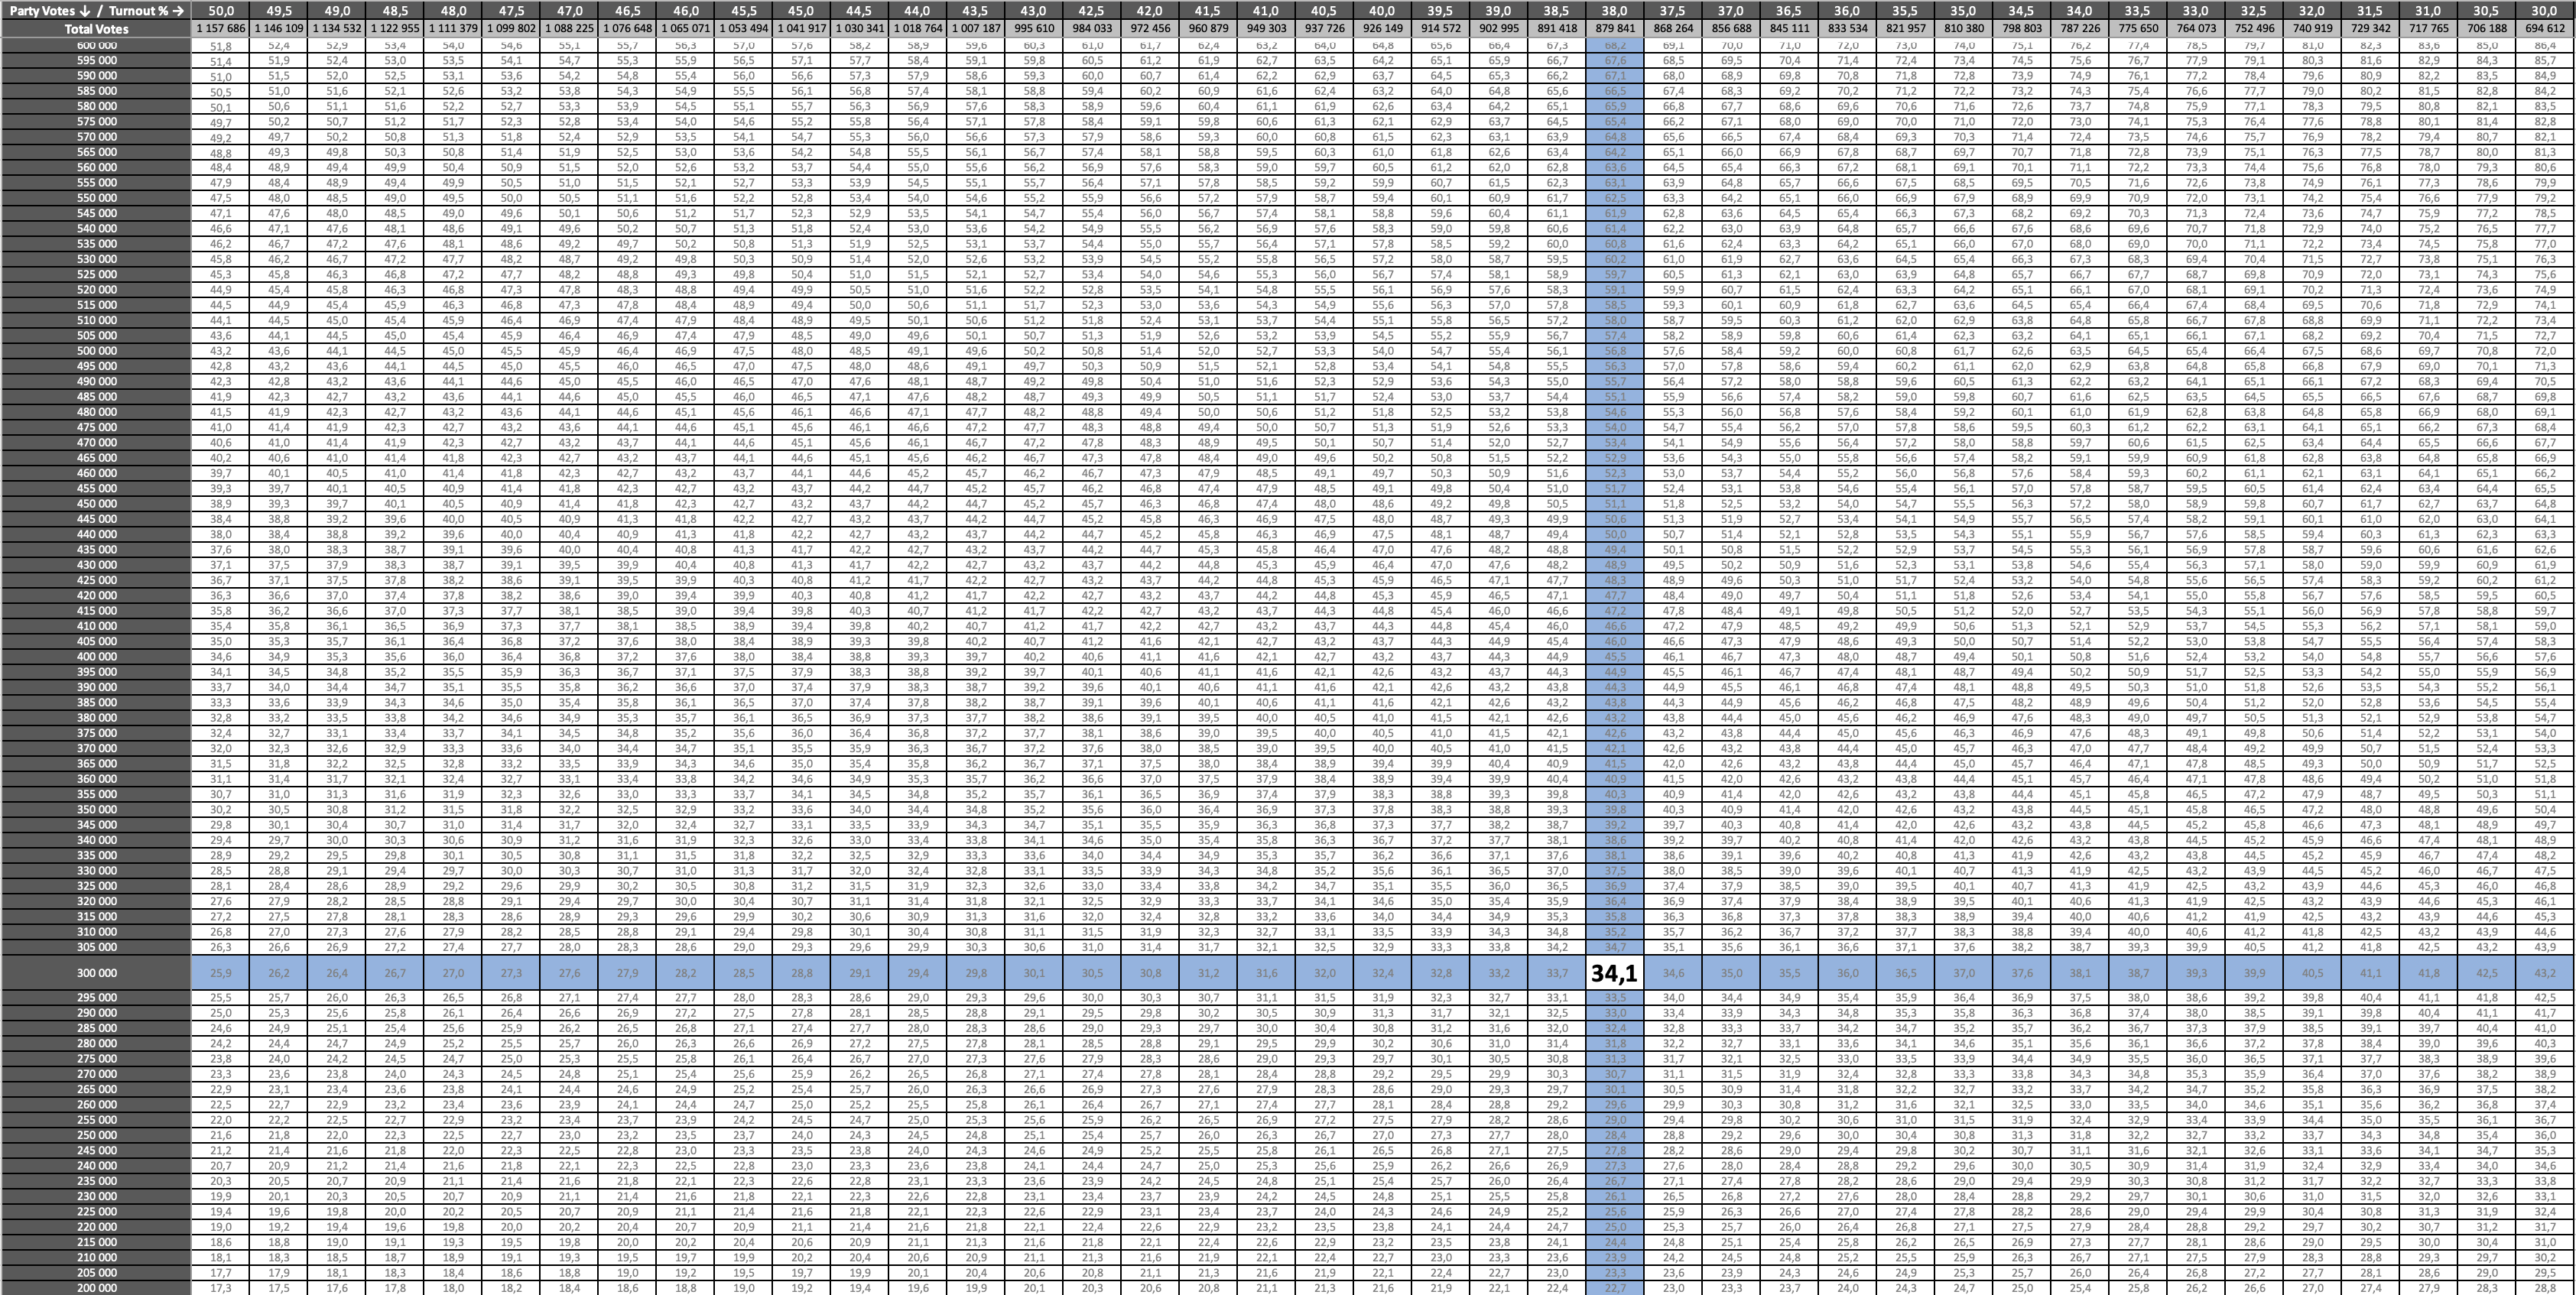
Hey presto: in that scenario, the DA would get 34.1%.
Just remember though, this is just one model – where registration is unmoved. There are five others, where it increases in increments of 20,000.
These models are fun to play around with, and if anyone wants to do that, here is a link to the relevant Excel document, containing all six models, and you can generate your own scenarios, for each model.
To avoid a stream of dense data-filled pictures in Part II, I am only going to talk about the outputs per scenario but you now know where they all come from.
When we have the final number of registered voters, after the two registration weekends are called later in the year, we will be able to refine this model considerably.
Part II will look at how these models help us generate and understand an answer to Zille’s question.
This essay is the 12th in an on-going series on Election 2026/7, for all other editions of this series, please click here: Election 2026/7
Discover more from inside politics
Subscribe to get the latest posts sent to your email.

You must be logged in to post a comment.