
Election 2024 [12]: How voter registration is declining
by The Editor

Thread: “How voter registration is declining” This thread looks at long term voter registration trends, and compares them to the potential registration pool, to see what the key indicators say about the ever-decreasing enthusiasm for South African elections.
How voter registration is declining
By: Gareth van Onselen
Follow @GvanOnselen
26 February 2024
This essay is the 12th in an on-going series on Election 2024, for all other editions of this series, please click here: Election 2024
The big picture: The graph below maps the total number of registered voters for each national and local government election since 1999 (1999 was the first time the IEC established a Common Voters Roll, and required registration to be on it, so the numbers for 1994 and 1995 are of no real value for our purposes).

The Voters’ Roll has grown from 18,172,751 registered voters in 1999 to 27,757,328 registered voters in 2024 (the 2024 roll has not been certified yet, but this was the final number when the registration window closed and will not change in any substantive way). Over 25 years and 11 elections, that is growth of 9,584,577 registered voters, or 52,7%.
Those numbers, however, mask a profound and growing problem. To reveal what is hidden requires some depth. And depth requires some additional statistics, to make proper sense of it all.
Registered Voters are one data set, and relatively easy to come by, via the IEC. But they need to be seen in their proper context: as a percentage of all potential voters (that is, all adults 18 years or older). This is our second data set: The Voting Age Population (VAP). VAP is a standard democratic indicator the world over, but it is extremely difficult to find in South Africa, in any consistent way.
The IEC makes reference to it occasionally and on an ad hoc basis (usually only by percentage). StatsSA has its mid-year population estimates but they break by age brackets, and the standard bracket of 15-19 makes it very hard to determine the 18+ population specifically.
On request, however, StatsSA provided the VAP, properly filtered for 18+, for the years 1999 to 2022. The 2023 and 2024 estimates are not available yet, but the VAP has grown annually by 1,6%, 1,7%, 1,6%, 1,1% and 1,2% up to 2022. So if we use a conservative 1,2% growth rate, we can fairly accurately estimate the 2023 and 2024 numbers. Just bear in mind, these are population estimates (although incredibly sophisticated ones), but that is as good as we will ever get.
The graph below compares the registered voting population to the VAP.

There is a gap developing between the two. Because the numbers are so big, it appears relatively small, but if we plot the difference between the two lines in absolute numbers, we get the graph below.
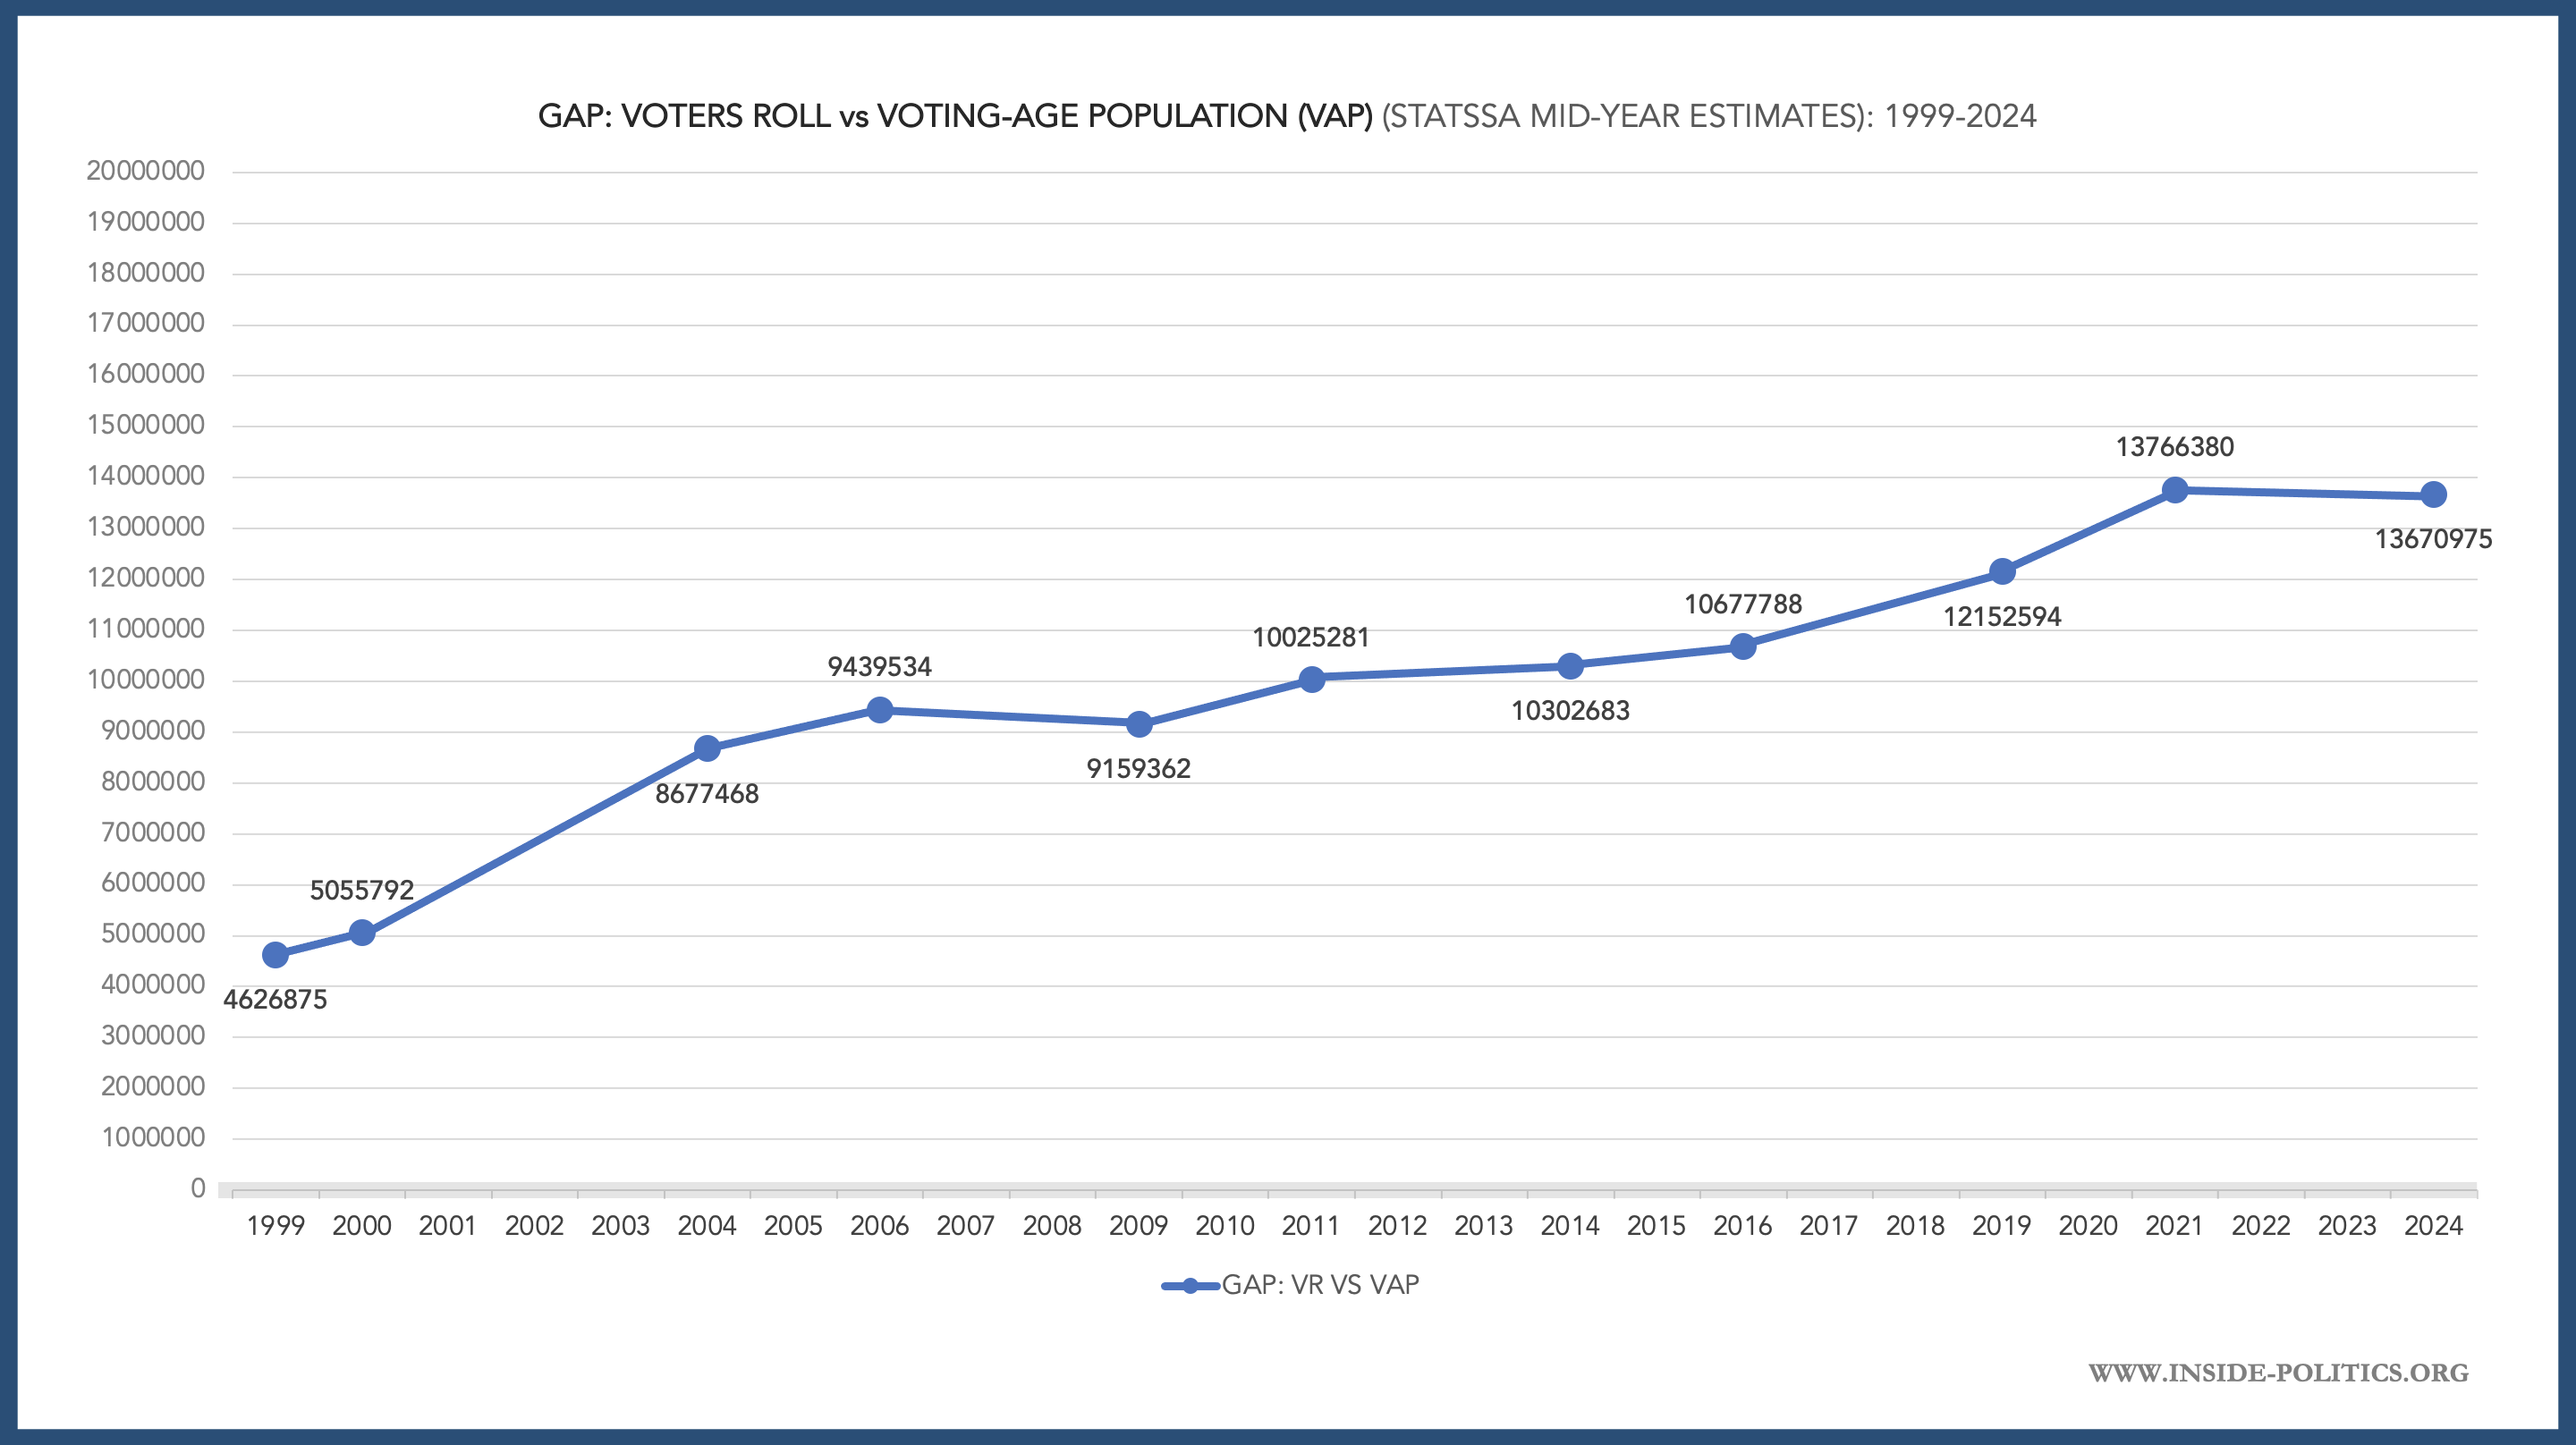
In 1999 the gap was 4,626,875. By 2024, it has grown to 13,670,975. Put another way, in 1999 all registered voters, accounted for 79,7% of the VAP. By 2021, that percentage had dropped to 14,1pts to 65,6%.
If one wanted to be really polemical about it, you could say South Africa’s registered voting population, compared to the total VAP, has not grown at all since 1999. The registered voting population grew by 9,584,577 from 1999 to 2014 but the gap between it and the VAP grew by 9,044,100 over the same period. So really we have made no real progress in 25 years.
On closer inspection, the gap really started to accelerate from around 2014. There has been something of a recovery in 2024, the line has straightened. But even that needs to be seen in its proper context.
Let’s use the national registration weekends to illustrate, the IEC’s primary way of registering new voters. Typically there are two such weekends before each election. The graph below combines the number of new registrations in each of those weekends, and for each election.
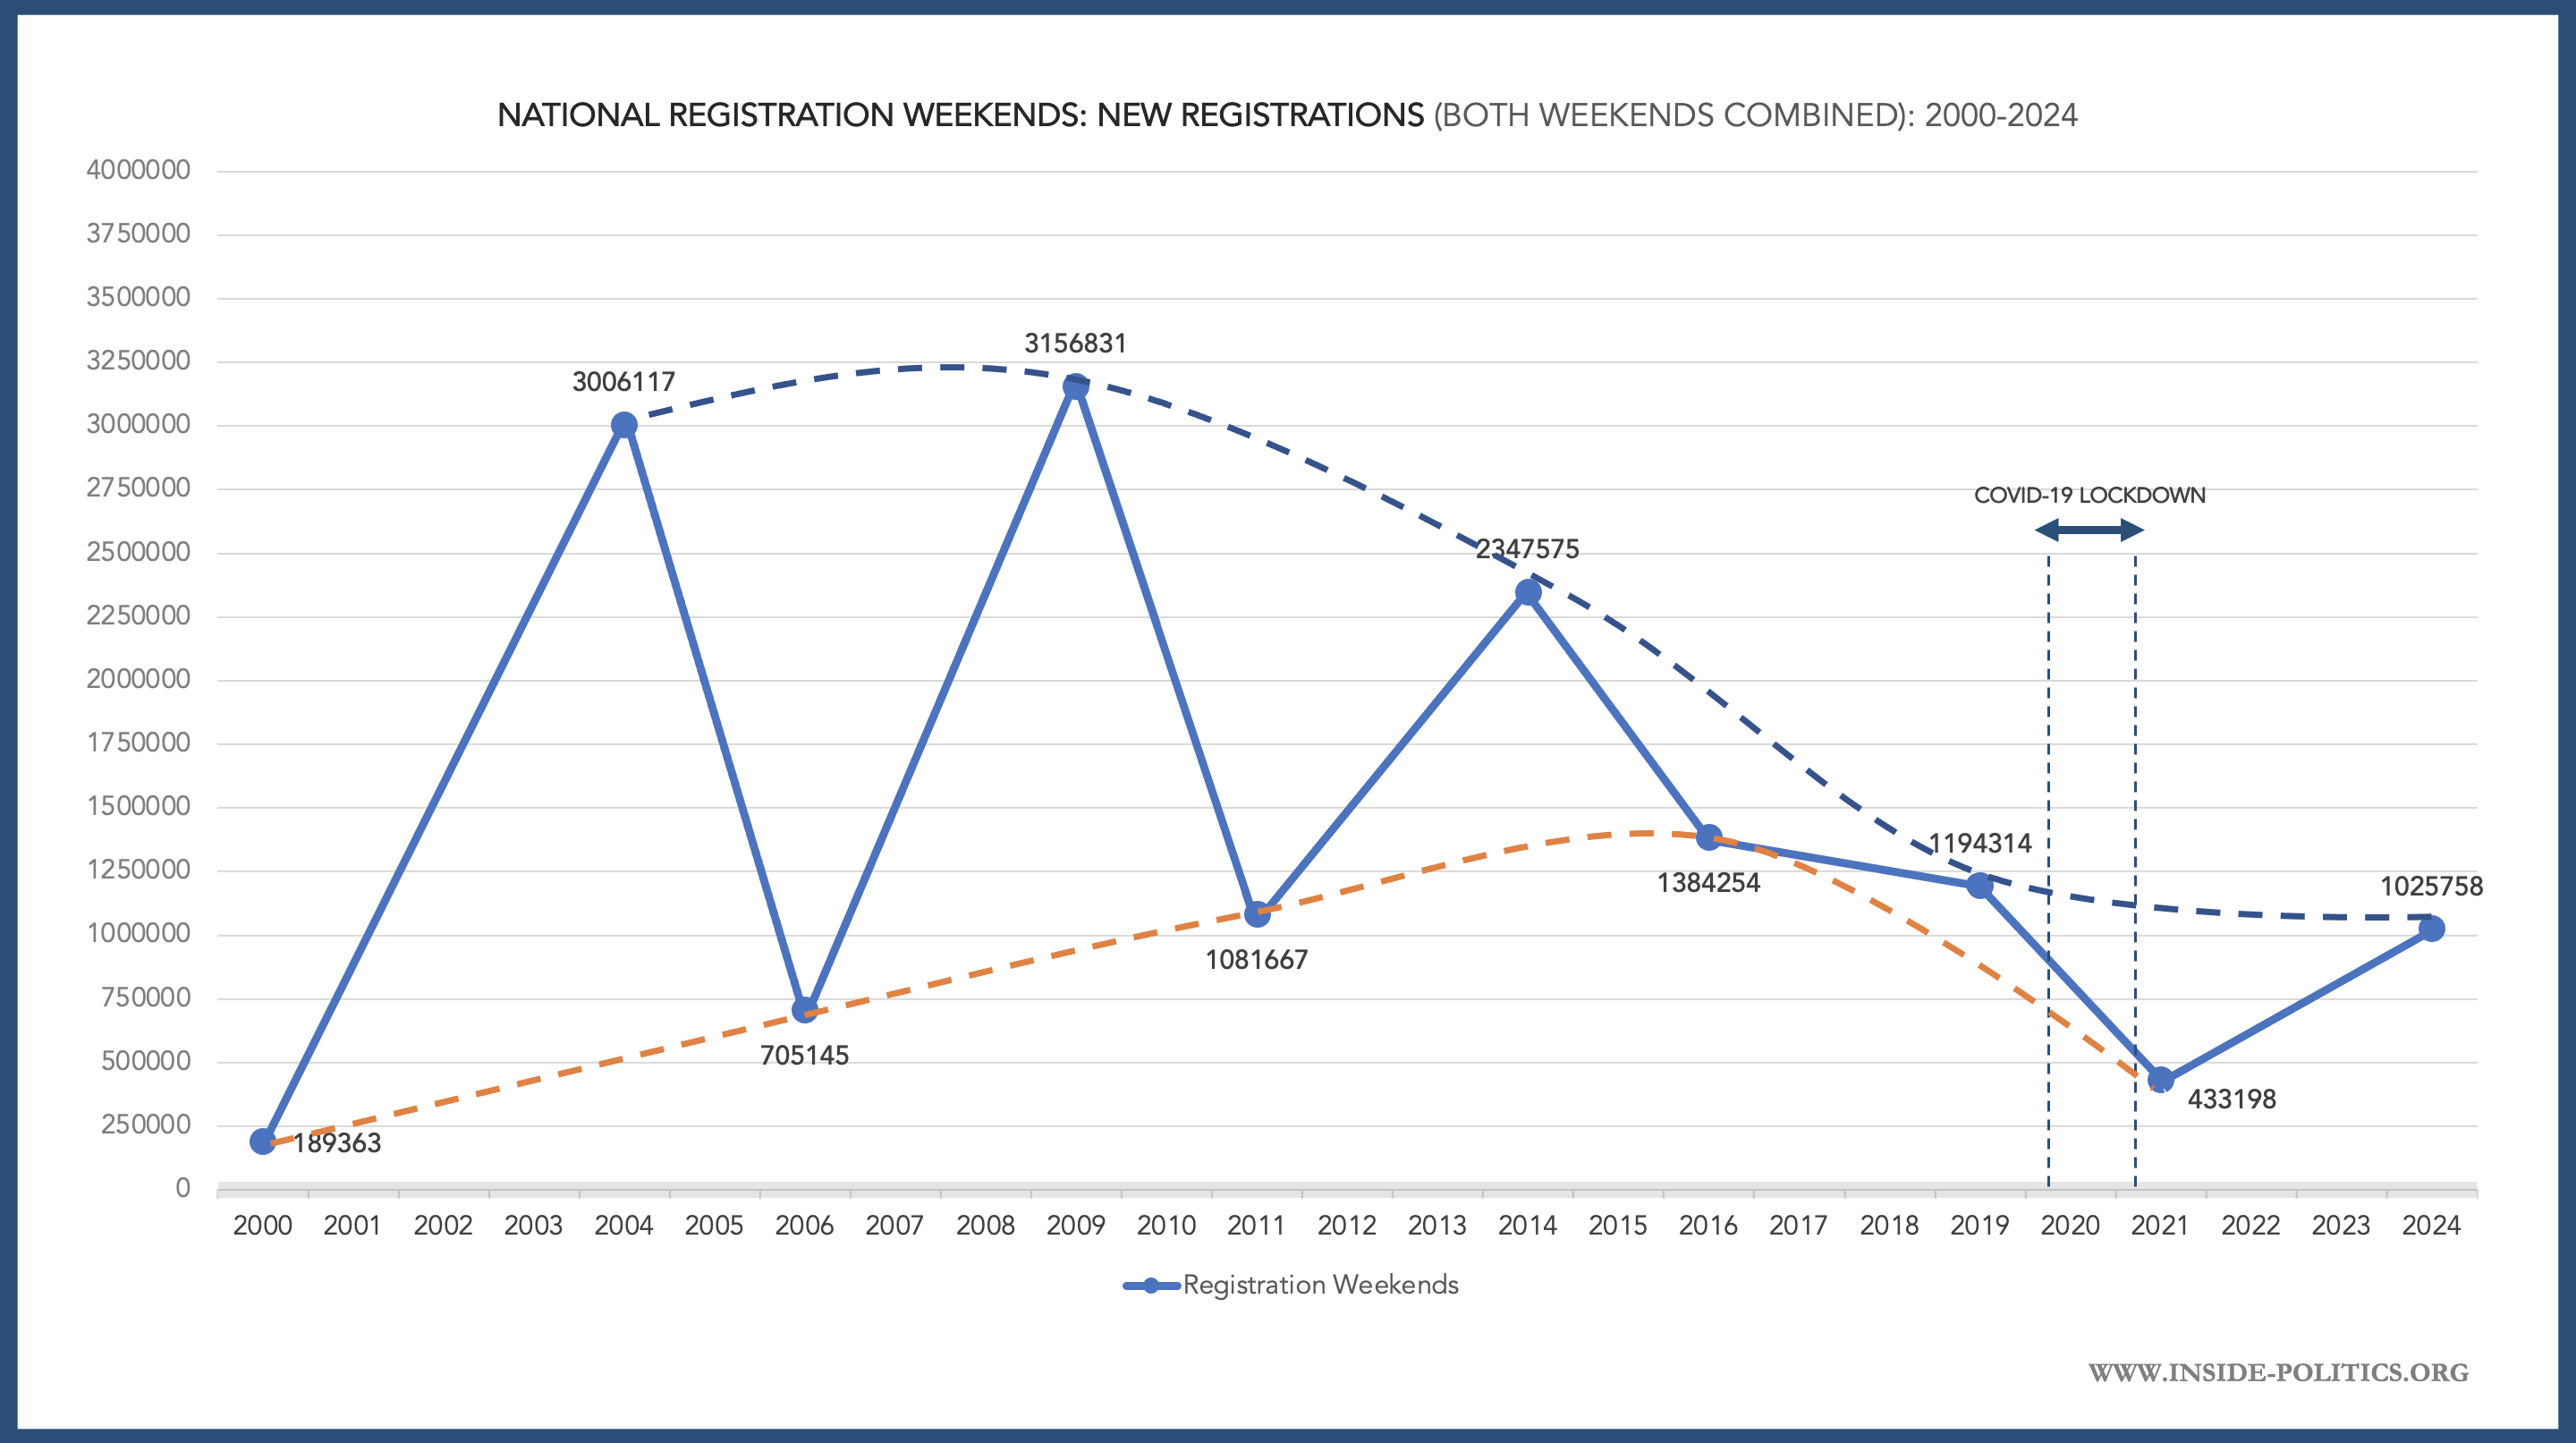
You can see the big spikes for national elections, when more South Africans care or are motivated enough to register. And you see the decline from 2016 and the dismal 2021 showing. The number of new registrations in 2024 looks impressive by comparison to 2021 but given 2021 was a Covid anomaly, the dotted blue line linking national elections is really how you should view that 2024 number – the graph is still headed down.
You can see what an outlier situation 2021 was too, by looking at the orange dotted line, which links local government elections – it was headed in the right and completely opposite direction until 2021. New local government registrations were steadily improving until Covid.
Covid-19 really hurt voter registration. The graph below shows the total growth in the Voters’ Roll for each election since 1999. Again, it grows dramatically in national elections, and to a small degree in the local government elections. In turn, since 2016, there has been a marked decline in new registrations. But, it was in 2021 that the floor really dropped away completely. In 2021, for the first time ever, the Voters Roll actually shrank (by 552,070 voters).

How did this happen, given there were still 433,198 new registrations in 2021? Well, two things determine the size of the Voters Roll:
- It needs to be cleaned up annually. People who have died are removed from the roll for example; the IEC uses the population register, maintained by the Department of Home Affairs, to do this. One can also de-register, but hardly anyone does that.
- New voters need to be added. This is either through IEC activity (registration weekends for example), via political parties – who have registration drives – or directly via the public.
In 2021, the growth in new registrations was nullified by decreases in the VAP. The delayed election meant only one registration weekend was possible, and the legacy of the lockdown drove down participation. The result, a net decline in the Voters’ Roll and extremely low turnout.
Not enough is made of this. But it is essential to understanding the 2021 election, and the 2024 election to come. 2024 registrations look successful on paper, but really we effectively lost a full and proper election cycle to Covid, and are now trying to make up lost ground. All we have done since then, is relatively stabilise the situation but, in the big picture, all key national election indicators are headed down.
Perhaps the best way of illustrating this is turnout itself. The graph below plots turnout among all registered voters, against turnout among the VAP. The dotted lines link the national elections, and project them forward to 2024 (the lines begin to straighten because of the relatively successful 2024 registration period, but remain projections not predictions).

2021 was the first time in 15 years and 5 elections that turnout among registered voters dropped below 50%. But as a percentage of the VAP it has now been below 50% for three successive elections (41,3% in 2016, 45,4% in 2019 and a dire 30,2% in 2021). That VAP figure for 2021 is a catastrophe. It means just 1/3 of eligible voters in South Africa voted or registered to vote in 2021. So far as the legitimacy of democratic elections go – the ultimate expression of the “voice of the people” – a 30% participation rate is calamitous, and unless turned around, will soon cause profound problems of its own.
Before concluding, it is worth saying something about the 2019 election – the last national election. It too is something of an anomaly, and it was before Covid. The 1,194,314 new voters registered during registration weekends that election was down fundamentally from the three national elections before (3,006,117 in 2004, 3,156,831 in 2009 and 2,347,575 in 2014). In turn, overall growth of the Voters’ Roll plummeted for a national election in 2019, down to 423,296 – compared to 2,198,410 in 2004, 2,127,040 in 2009 and 1,735,104 in 2014.
The ANC for one, will be pinning much hope on the possibility that 2021 was a complete abnormality, and that turnout will return to past national patterns. But it cannot assume that without looking at 2019. The great age of “Ramaphoria”, it seems, was not so great after all. There was less hope, not more. Why that particular trend would change in 2024 is difficult to imagine, even if the 2024 registration numbers give the impression of a renewed enthusiasm. We will have to see where all these graphs end up on 29 May but you can be sure of one thing: none of them seem set to end in the ANC’s favour.
The key takeaways from the essay are:
- The Voters’ Roll has grown election on election for every year bar 2021 when it shrank, most likely as a result of Covid-19.
- However, it is not growing as fast as the Voting-Age Population (VAP), and the gap between registered voters and all potential voters is growing every election.
- The gap between the two has grown from 4,626,875 in 1999 to 13,670,975 in 2024.
- As a percentage of the VAP, the total of registered voters has shrunk from 79,7% in 1999 to 65,6% in 2021. It has stabilised somewhat in 2024, at 67%.
- A number of key indictors underpinning the Voters’ Roll reinforce this relative decline. The total number of new registrations secured at the IEC’s national registration weekends before each election is declining. And although 2024 was an improvement on 2021, it is still down from 2019.
- The same is true of the total growth in the Voters Roll. The 2024 growth was impressive – 1,5m new voters. However, 2021 and Covid saw the Voter’s Roll shrink by 500k, so really it is only growth of 1m and with the exception of 2019, way below typical national election growth high points (of around 2m).
- 2021 was a total outlier, driven largely by Covid. It has fundamentally and negatively impacted on the Voters’ Roll, and increased the gap between registered voters and the VAP. It also completely reversed the promising trend in local government election registration which, up to that point, was growing election on election.
- As consequence of all this, South Africa now faces a double-edged problem. On the one hand, turnout among registered voters is declining. On the other, turnout as a percentage of the VAP dropped to a staggering 30% in 2021, meaning 2/3 eligible voters in South Africa either didn’t vote or aren’t registered to vote.
- 2019 – the immediate point of comparison for the 2024 election – is somewhat lost in all this. But it is really where the decline started in earnest. New registrations fell dramatically, as did growth in the Voters Roll, atypical for a national election.
- In the big picture: 2019 first demonstrated a substantive decline in national voter enthusiasm, 2021 and Covid then dramatically exacerbated the problem. There are signs of recovery in 2024, but only enough to relatively stabilise the situation, as all key indicators suggest further long term decline.
- The result is that the legitimacy of South Africa’s democracy is becoming systematically weaker and weaker.
All numbers in this essay are drawn from the Independent Electoral Commission website: https://www.elections.org.za/pw/ and StatsSA.
This essay is the 12th in an on-going series on Election 2024, for all other editions of this series, please click here: Election 2024
Discover more from inside politics
Subscribe to get the latest posts sent to your email.

You must be logged in to post a comment.