
Election 2024 [13]: Busting the “disillusioned youth” myth
by The Editor

Thread: “Busting the ‘disillusioned youth’ myth” This thread seeks to challenge a common and popular narrative which suggests declining youth registration and voting patterns is best attributed to disillusionment, as opposed to apathy.
Busting the “disillusioned youth” myth
By: Gareth van Onselen
Follow @GvanOnselen
8 March 2024
This essay is the 13th in an on-going series on Election 2024, for all other editions of this series, please click here: Election 2024
PART I: The popular youth narrative
“The fault, dear Brutus, is not in our stars, but in ourselves.” William Shakespeare, Julius Caesar
There is a popular narrative among certain political commentators, primarily on social media, that the youth do not vote in large numbers because they are disillusioned, as opposed to apathetic. In other words, while the youth are intensly political, their opting-out should thus be blamed on political parties and their leaders, who have failed to capture the youth’s imagination. Finally, it is argued, the problem is therefore best explained and understood by critically interrogating political parties – opposition parties in particular – rather than the youth itself.
There are many examples of this kind of thinking, but it is epitomised in this video by social media commentator Dan Corder, titled: “Why Young South Africans Aren’t Voting: Will 2024 Be Different?” In it, Corder says the following:
“There are 15 million eligible South Africans between the ages of 18-30 who are eligible to vote in this year’s national election. That’s 5 million more people than voted for the African National Election in the last election… It’s not that young people are lazy or dumb or uninterested or apathetic. It is none of those things… There is a big difference between apathy and disillusionment. So, apathy is ‘we don’t care’, like, ‘we are not interested, we not bothered’. Disillusionment is, ‘we care deeply but we feel like, what’s the point?’ It’s a sense of hopelessness and resignation, like, ‘nothing that we do could actually cause change; this is our fate and there is nothing we can actually do about it.’ And the data suggests that that is the real problem. It’s not that young people don’t care or are apathetic, it is that young people are fundamentally disillusioned… And actually, there is plenty of data to show that young people are extremely politically engaged, extremely involved and spend a lot of time seeking to understand certain issues…”
A key part of this narrative is the suggestion that the youth are highly political in general terms, only they are not “party-political”. In other words, they partake, to a high degree, in informal politics (protests, community meetings, NGOs, etc) but, to a lower degree, in formal democratic politics (party membership, registration and voting). Therefore, the argument goes, they must be disillusioned about formal democracy.
Three reasons are typically put forward, as to why the youth are “politically engaged”, but not “party politically engaged”: 1. “youth issues” are not properly addressed or ignored; 2. The youth are not properly spoken to, in a manner that resonates with them, and in a language with which they can relate; and 3. the youth are not properly represented in political parties.
This narrative is everywhere. “SA youth not apathetic but no longer believe elections are best path to change”, says Tamsin Metelerkamp, writing for the Daily Maverick – a story based on nothing more than a few anecdotal interviews. “South Africa’s youth being labelled as apathetic could not be further from the truth”, says Enzokuhle Sabela, writing for the Mail & Guardian. Tessa Dooms, a Director at the Rivonia Circle, puts it like this:
“What we traditionally call voter apathy or youth political apathy, I think is a misguided view, and I think it is lazy. In a few sentences: one is that, young people in this country have shown over time that they are interested in politics. If we think just about what happens on campuses, with student politics, at T-VET level, where people are fighting for housing and they are fighting for tuition fees, when we think about universities, but even when you think about what happens at protests in communities and at community level – it is not old people who are the ones able to mobilise and it is not old people being mobilised, it is young people. It is young people who are engaged in community work and community efforts. So it is not apathy to what happens in South Africa or the plight of South Africa or even politics itself, it is a mistrust in the political system and the power of the vote. And it is a mistrust in political parties, and not believing political parties are going to believe in the things they promise. And I think what we are seeing a broad, really a turning away of the electorate from political parties and the system saying to them “that you need to bring more to the table if you want our vote, our vote is not guaranteed.“
There is a fundamental contradiction inherent to this narrative: Political parties have failed, they must be criticised in vitriolic terms, and held publicly responsible (as “useless”, “without talent”, “untrustworthy”, “talk down to young leaders”). The same time, youth registration is declining, but the youth must not ever be held to account, criticised publicly, or in any way held responsible for their choices. Instead, they must be pandered to and blame shifted (“misunderstood”, “ignored”, “not represented”). And this is an absolute, fundamentalist attitude. There is never, in any of these takes, an attempt to introduce even the smallest, mildest, criticism – that perhaps responsibility runs both ways, and “the youth” have some serious questions to answer. As we shall see, they most certainly do.
1. The logical problems with the disillusionment narrative
Let us start with the self-evident.
First, “the youth” comprises human beings and, like everyone else, the youth are thus perfectly capable of apathy. It’s part of human behaviour, and anyone can be subject to it. To write that off completely is just silly. It is a factor, to one degree or another.
This is perhaps the most demonstrably obvious point. Youth apathy is a common phenomenon the world over, well-documented and evidenced. It is by no means particular to South Africa. In many democracies, formal participation grows with age. The reasons are complex but maturity and a sense of responsibility are undoubtably among them. Until people are older and realise they are impacted upon by politics, they tend to participate less. It is also nothing new but a long-standing problem.
Second, “the youth” are not a homogenous group. While South African commentary is hugely susceptible to group think (“all black” South Africans” or “all women” think the same way), it is not true or a helpful way of understanding reality. The same applies to “the youth”. There might well be generalisable patterns of behaviour, but without the proper caveats, one risks the age-old problem of analysing behaviour as nothing more than a universally shared response to biology. In truth, there are a great many, varying cultural and socio-economic forces at play, that impact different youth cohorts in different ways.
The most obvious of these differences is the fact that approximately 52% (11m) of the 22m South Africans between 18-39 are registered to vote. Around 48% are not. If nothing else, that fundamental break necessitates that the latter be understood differently from the former.
It is also true that voters identify in different ways. Some identify as “young”, and that is their primary political identity. Others, regardless of age, identify primarily as “unemployed” a “student”, ideologically, or along racial or gender lines, or any one or more of a hundred single or overlapping political identities. This idea, that there is a magic formula for all “young people”, simply because they are young, is both myopic and wrong. Political identities are far more complex that any one uniform demographic category.
In turn, there are a great many broad political constituencies that do not have a natural political home. “The middle class” is a good example. No political party has a class analysis, that puts the middle class first; no one even talks about the middle class as an interest group. “The elderly” have no party that could claim to be their champion. But these age cohorts do not drop out of politics as a result. They participate at a high rate, whatever the state of the nation or their level of despair, they take responsibility and make choices. “The youth”, for some reason, have the luxury of being exempt from this.
The third, flowing from the two points above, is that “the youth” are not victims but agents, as are all citizens. There is no obstacle preventing them from participating in democracy. Whatever the reasons, to opt-out is a choice. And like all choices, they are responsible for it. Treat the youth entirely like victims – held hostage by circumstance and without blame – and you both infantilise and remove from them personal responsibility, a key ingredient of any functioning democracy.
To this end, consider the following: Why is it, if the youth are so disillusioned yet intensely political, political parties so out of touch with them and their constituency so under-represented, the youth have not started a party of their own, on their own terms? How is it that they are so powerful in numbers, yet so politically ineffectual? How is it that the youth cohort, suffering world record unemployment levels, have not galvanised around that issue formally? The popular youth narrative asks none of these questions, because it conceptualises the youth as victims, without agency, and waiting, like some phantom, for a spell to release them from the fourth dimension they believe they are trapped in.
A fourth factor is disillusionment. This is no doubt a problem. South African national politics is in a catastrophic state, defined by chaos, corruption and incompetence. But that is a universal problem, affecting all voters, and not the youth in particular. If you want to make the case that it is particularly affecting the youth to a disproportionate degree, you need to demonstrate that. And there is no substantive evidence in support of that position, as we shall see (not that any hard data is ever offered in the other direction, the popular youth narrative is entirely rhetorical).
(There is a semantic point to make here. The difference between “apathy” and “disillusionment” is really a nothing distinction. Neither is an excuse for inaction – unless you are a hapless victim, which is why this narrative relies so heavily on shifting blame.)
Those who advocate this narrative commit all four of these fallacies: they refuse to acknowledge that apathy might be a factor, even to a small degree; treat the youth as homogenous, lay any and all blame at the door of others – reducing the youth to hapless victims or children devoid of agency; and suggest the youth are particularly affected by a particular kind of disillusionment, with no evidence in support of their position. And this outlook can be found everywhere.
It is difficult to understand why this narrative is so prominent, seeing how intellectually vacuous it is. One explanation is that those who propagate it, typically young themselves, have projected their own circumstance onto the youth. They do not like the political options available to them, and so assume the world is to blame. And so their primary contribution to the fight, is to lambaste political parties – opposition parties in particular – as entirely responsible, and ensure not an ounce of criticism is ever meted out to the youth, excusing if not ignoring completely the way in which the youth actually behaves, and sacrificing nuance and insight at the altar of group think in doing so.
And to understand the youth vote, you do need nuance. There are a great many forces at play, that far outweigh disillusionment alone. Logic is powerful in refuting this narrative, but many of these fallacies or myths can be further debunked by hard data.
PART II: The Data
Equipped with the 1999-2024 voters roll (that is, including the certified IEC 2024 registration numbers) and the official StatsSA mid-year population estimates (dating back to 2002, and up to 2022), we can take a deep dive into the voting behaviour of the youth constituency.
1. Defining the problem
Typically, the IEC has three reporting bands that cover the youth: 18-19, 20-29 and 30-39.
The final cohort (30-39) is probably a bit broad (the National Youth Commission Act defines “the youth” as those from ages 15-34 years) but the IEC is rigid in its reporting, so we will use those bands too.
In addition, and for the sake of comparison, we will also use the 40-49 and 50-59 bands.
Let us start, then, by working out how many people we are talking about, and illustrating the problem. The graph below maps the total registered voters (18-39) against the total population. (18-39), for each election since 1999.
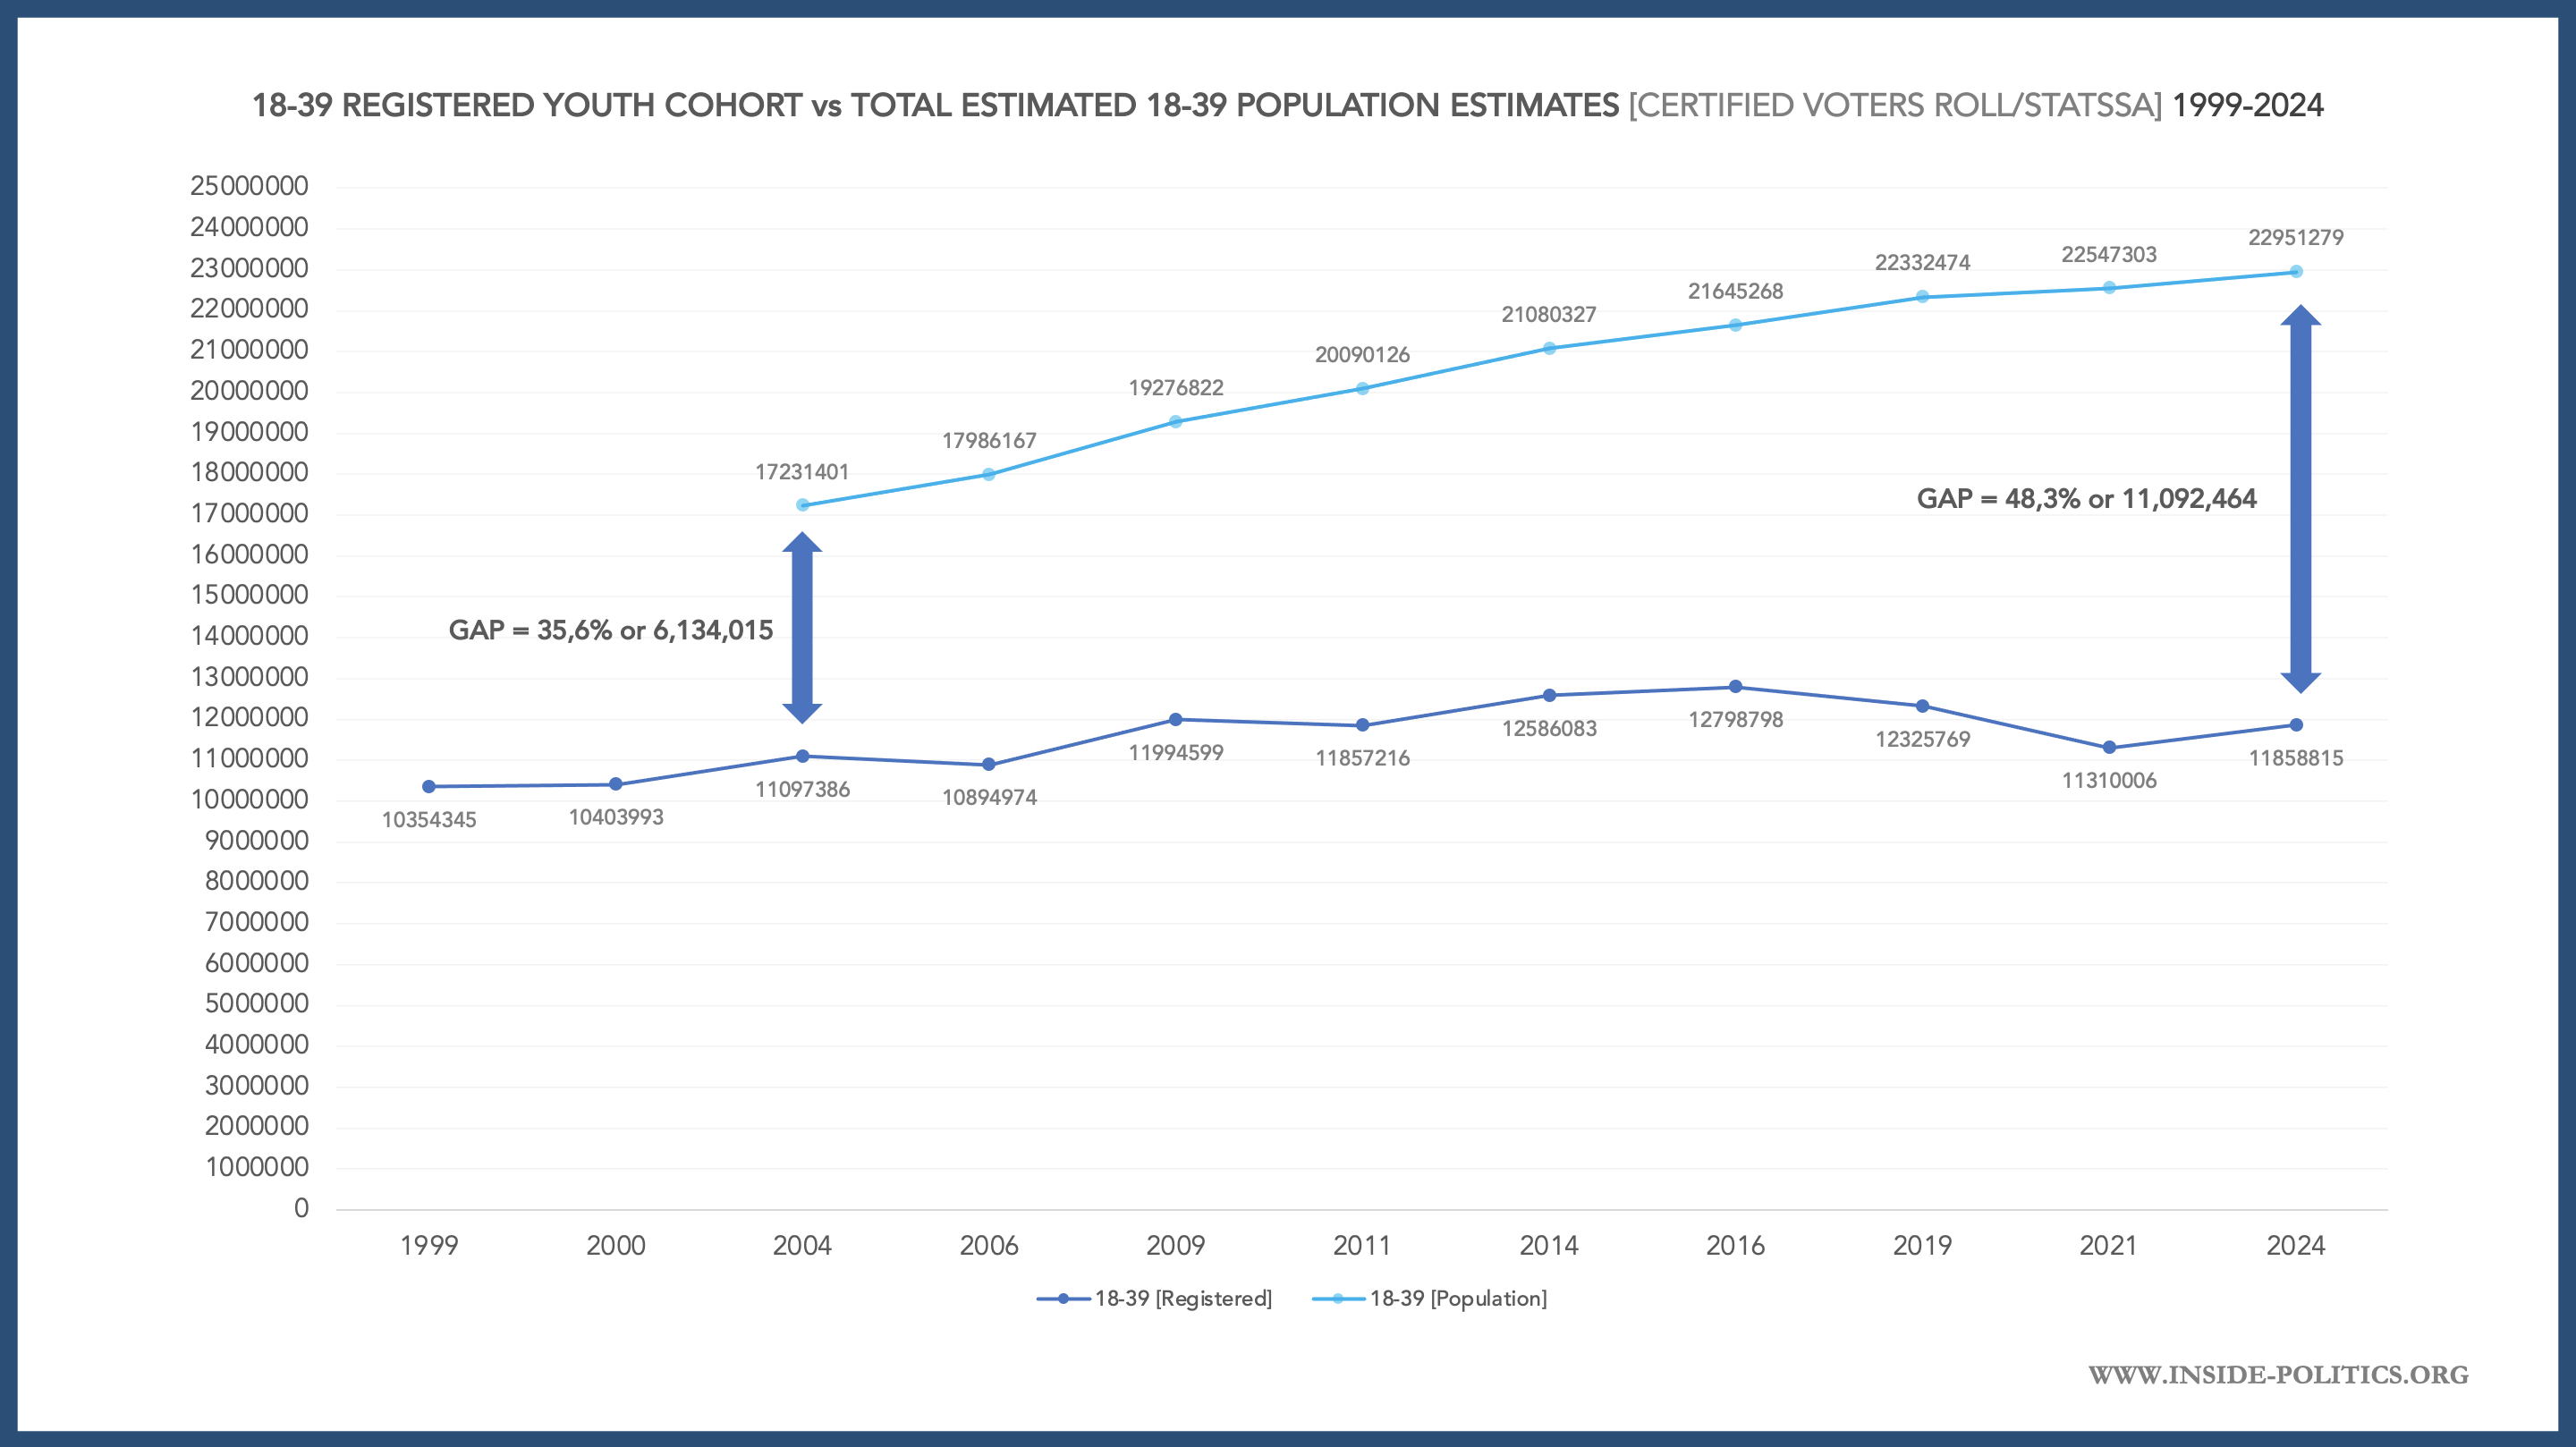
As of 2024, there are 11,858,815 registered voters from the ages 18 up to and including 39 years of age, and the total Voting Age Population (VAP) for the 18-39 cohort is 22,951,279.
In its media release on the certification of the voters roll, the IEC was very happy with the 2024 outcome. It said:
“The highlight of the certified roll is the increase in the rate of representation by persons in the age cohort 18–39 years. This age band accounts for 42% or 11,7 million voters on the voters’ roll. In fact, the increase in this age category from the 2021 Local Government Elections (LGE 2021) is over 200%, which vindicates the continued focus by the Electoral Commission and other stakeholders to invert the under-representation of this category of voters.”
That short-term assessment belies a long-term trend in the other direction. Yes, the 18-39 cohort did grow in 2024 (up 548,809 voters from 2021, I suspect the 200% in the IEC statement refers to the 18-19 cohort) but 2021 was a Covid-driven aberration, and local government elections are worse for registration generally. Compared to the last national election (2019) the 18-39 cohort is down 466,954 registered voters. And compared to 2016 (its high point at 12,798,798 voters) it is down 939,938 voters – almost a million.
In turn, a significant gap has grown between the two lines. In 2004, 64% of the 18-39 VAP was registered, a gap of 6,134,015 (or 36% of) unregistered young voters. This year, 52% of the 18-39 VAP is registered, and the gap is 11,092,464 (or 48% of) unregistered young voters.
By way of comparison, the graph below sets out the total registered voting population for the combined 40-59 cohorts, against the total combined 40-59 VAP.

As you can see, it looks fundamentally different, and much healthier. Not only is the gap between the two lines much closer, but it also remains relatively consistent. 78% of all 40–59-year-olds were registered in 2004 (a gap of 22% or 1,846,052 unregistered 40-59-year-olds) and that gap has marginally shrunk 20 years later (to 16% or 2,041,289 unregistered 40-59-year olds). Now 84% of 40-59-year-olds are registered.
So, unlike “the youth”, the percentage of registered “middle-aged” voters is growing or participating in democracy at an increasing rate. If we put those two data sets together, as per the graph below, the difference becomes even more stark.
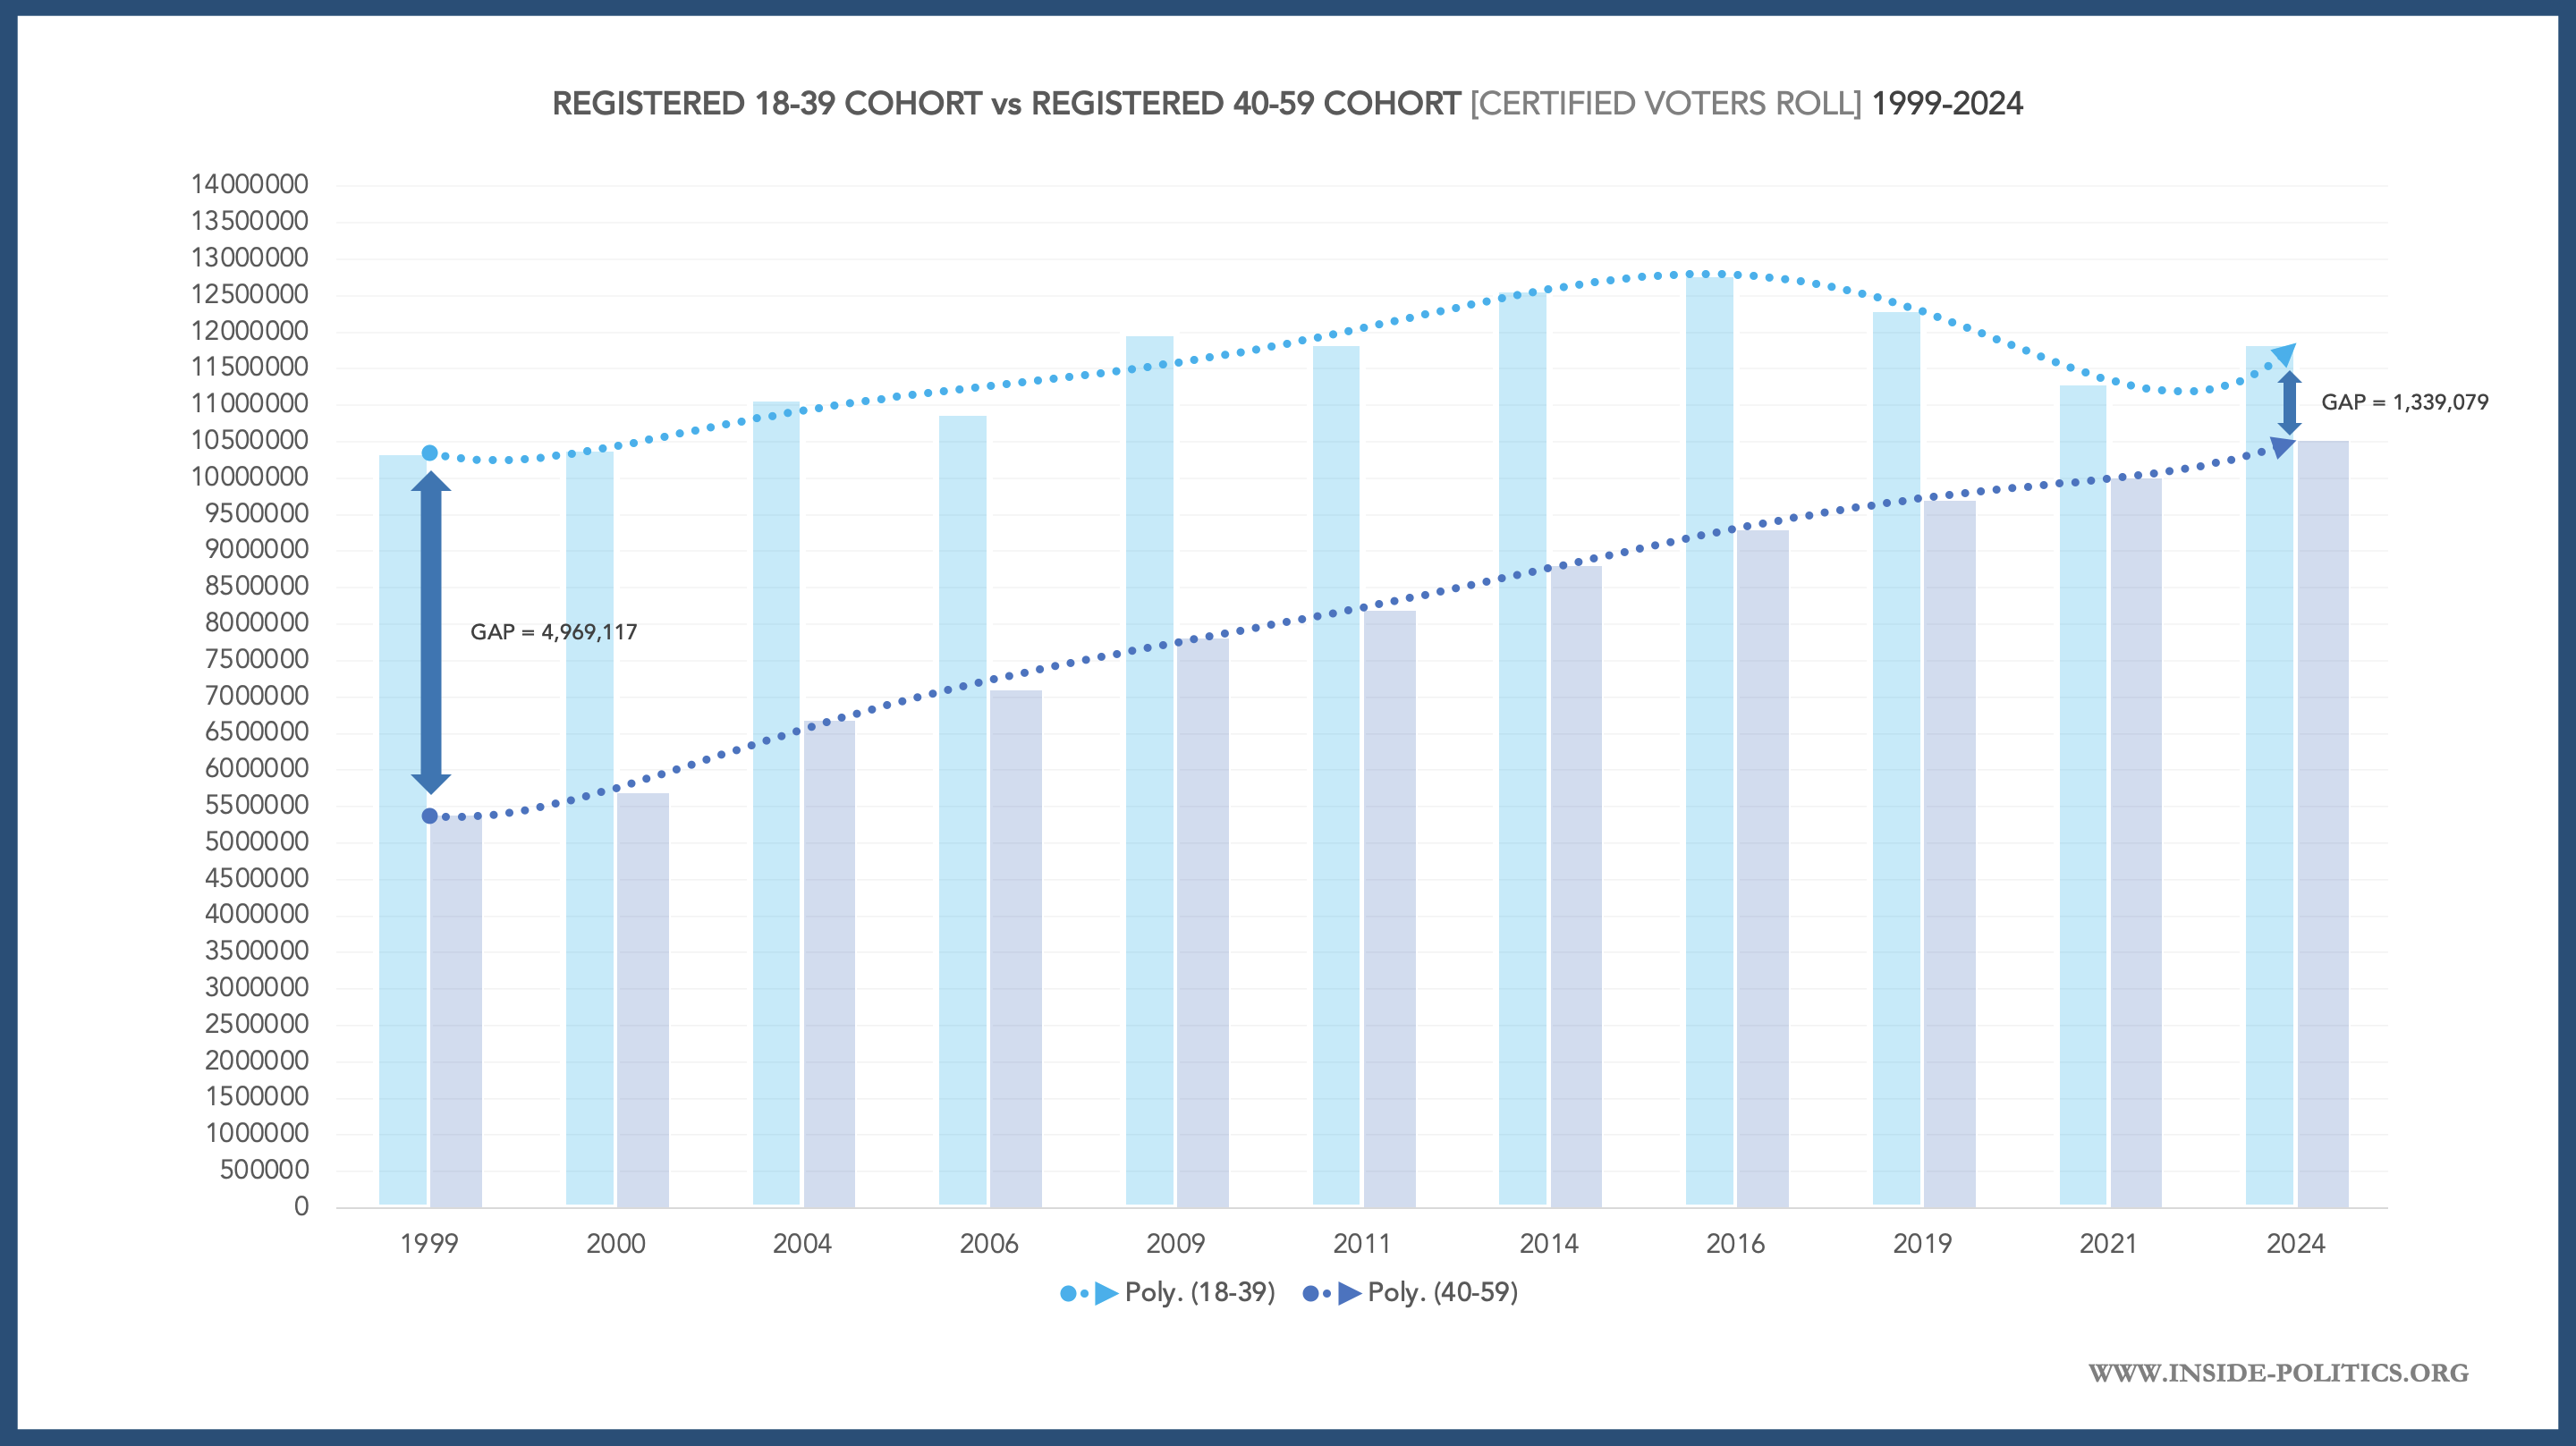
As the combined “youth” cohort has shrunk, and the combined “middle-aged” cohort has grown, so their respective registration trend-lines have almost come to meet in 2024. And, logically, this delivers one other important insight: the 18-39 cohort is now worth far less of the total registered population than it was in 1999, while the the 40-59 cohort is worth much more.
It is the effective doubling of the gap in youth registrations that drives much of the popular youth narrative, such as it is. But while there is definitely a decline, to properly understand it, it is now necessary to go into detail.
2. The youth as a heterogeneous group
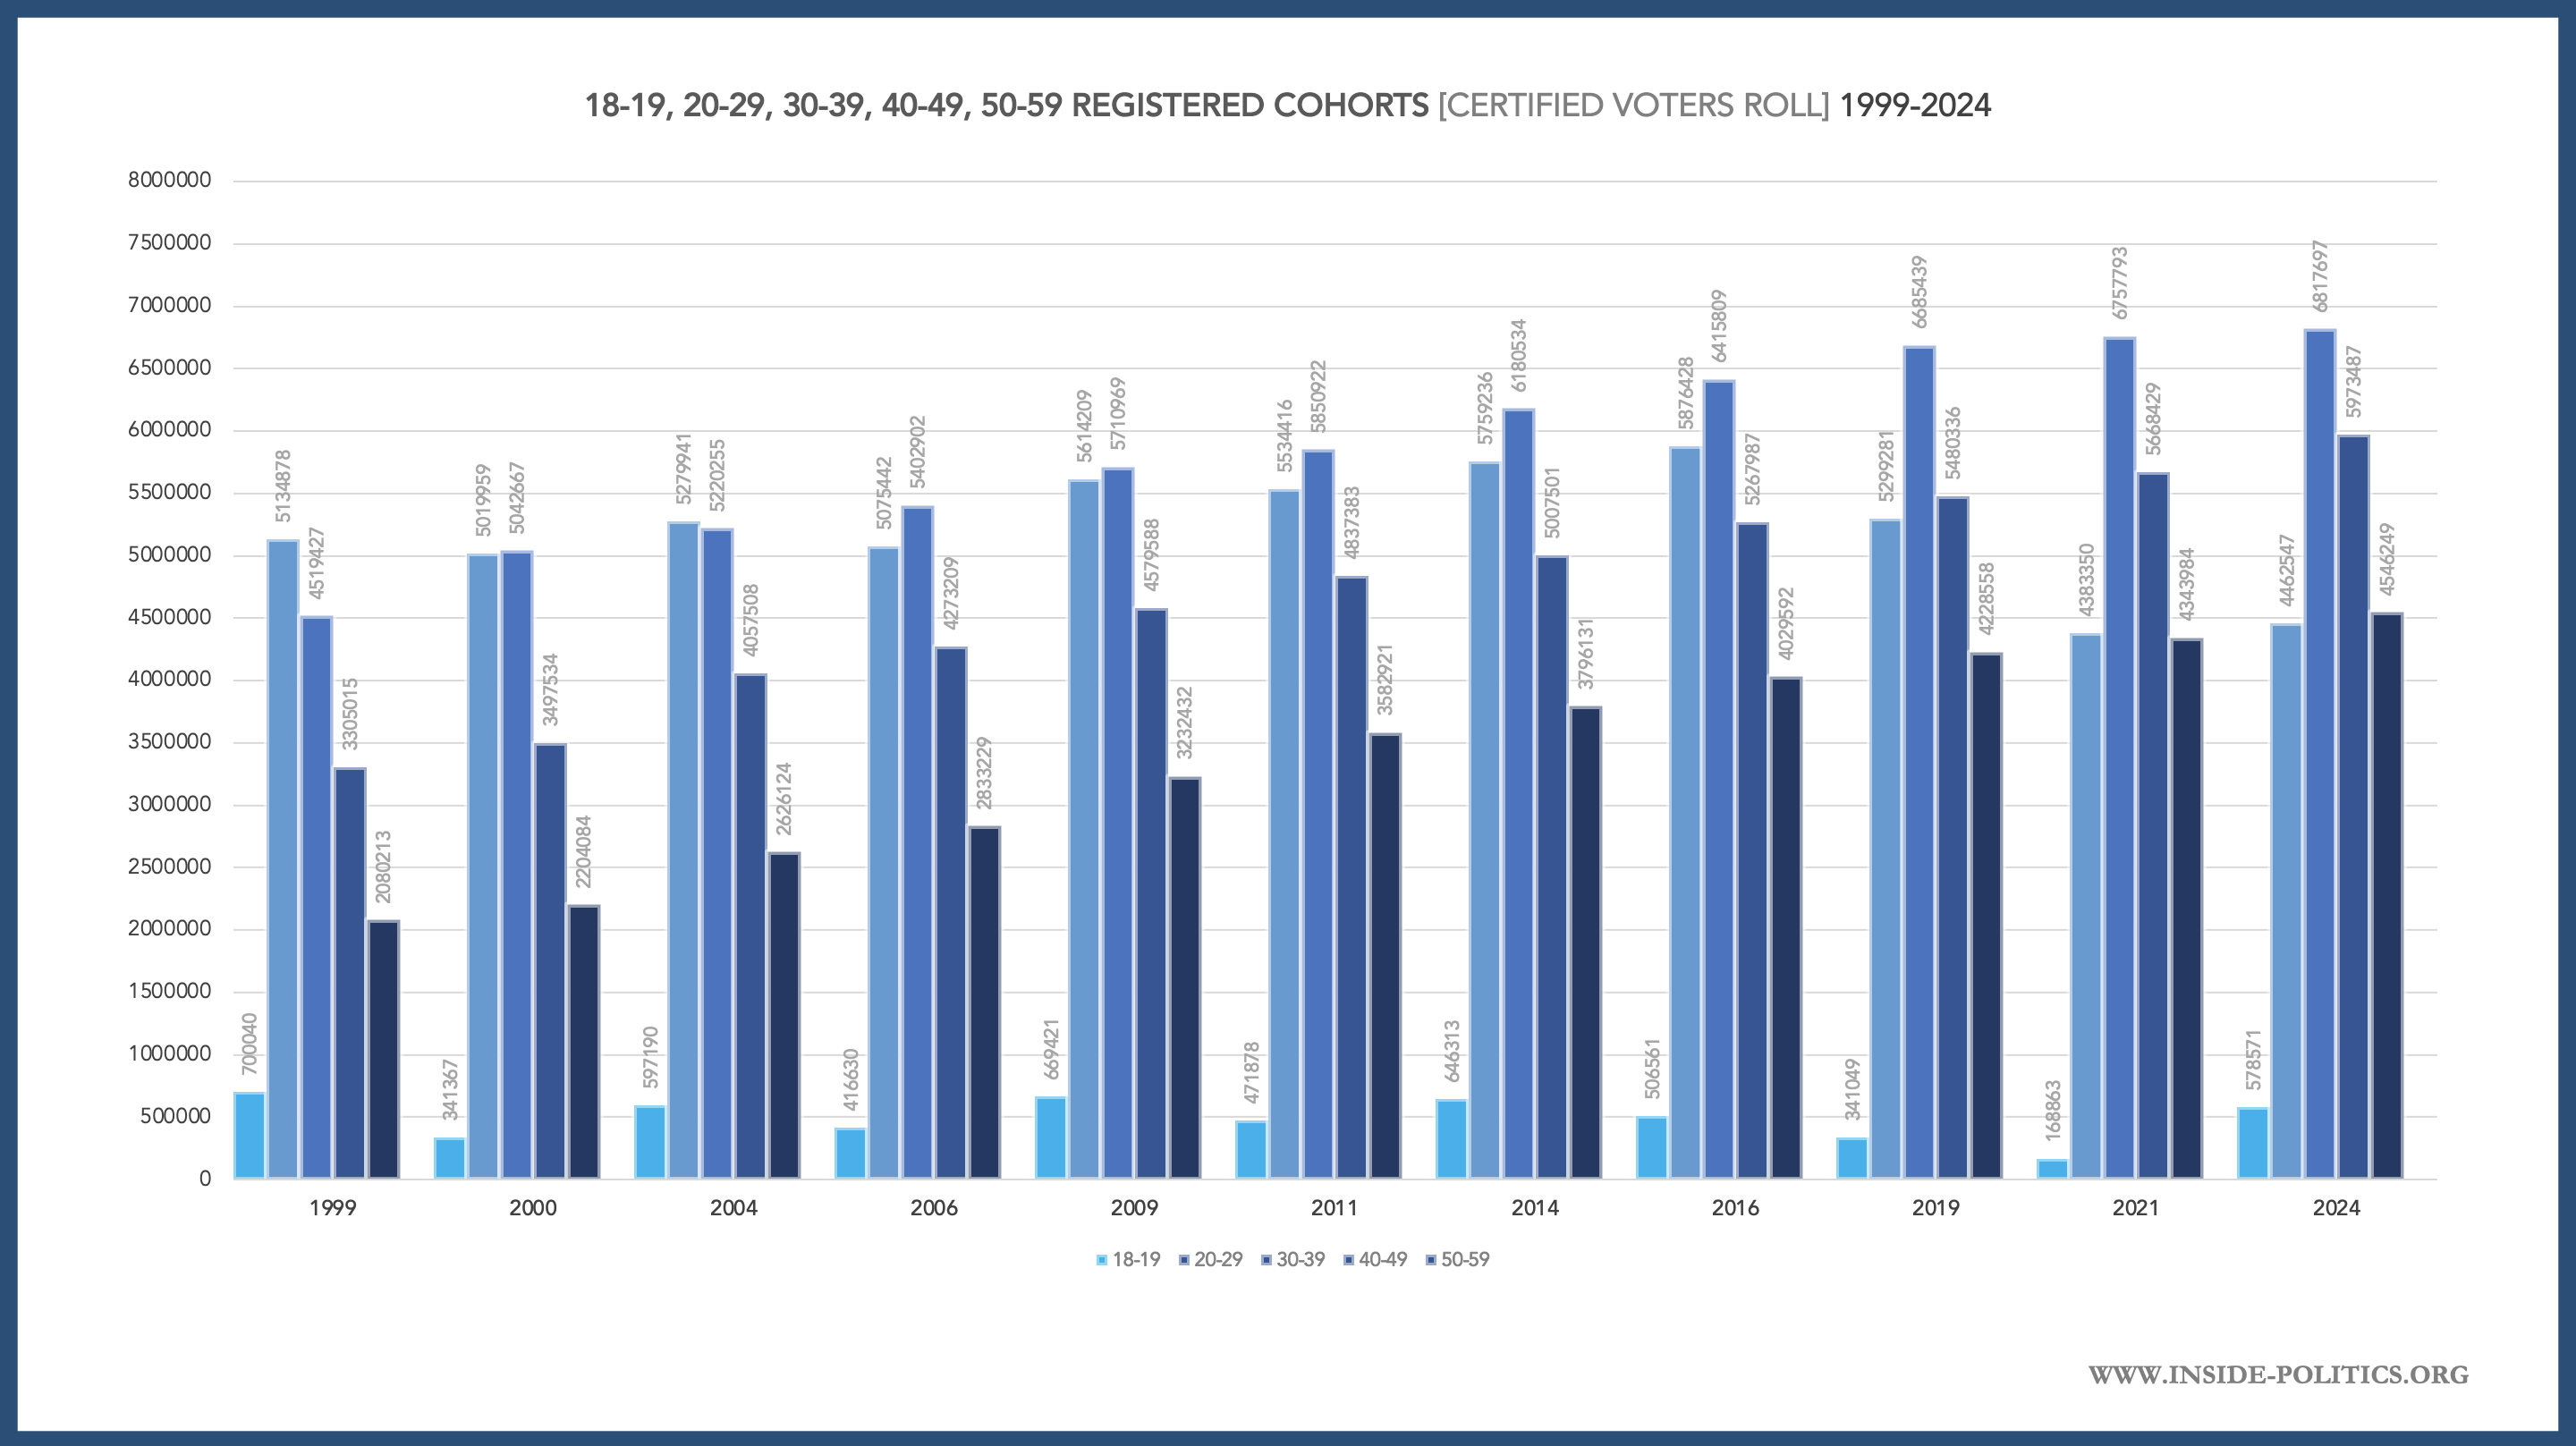
The graph below shows how the 11,8m registered 18-39 year olds breaks by age: In 2024 the smallest cohort (18-19) comprises 578,571 voters; the second largest cohort (20-29) comprises 4,462,547 voters and the largest cohort (30-39) comprises 6,817,697 voters. We can see how those cohorts have fared over time.
(For comparison, the 40-49 cohort comprises 5,973,487 registered voters and the 50-59 cohort, 4,546,249 registered voters, in 2024. Together: 10,5m).
The graph below shows the relevant trend-lines for each cohort.
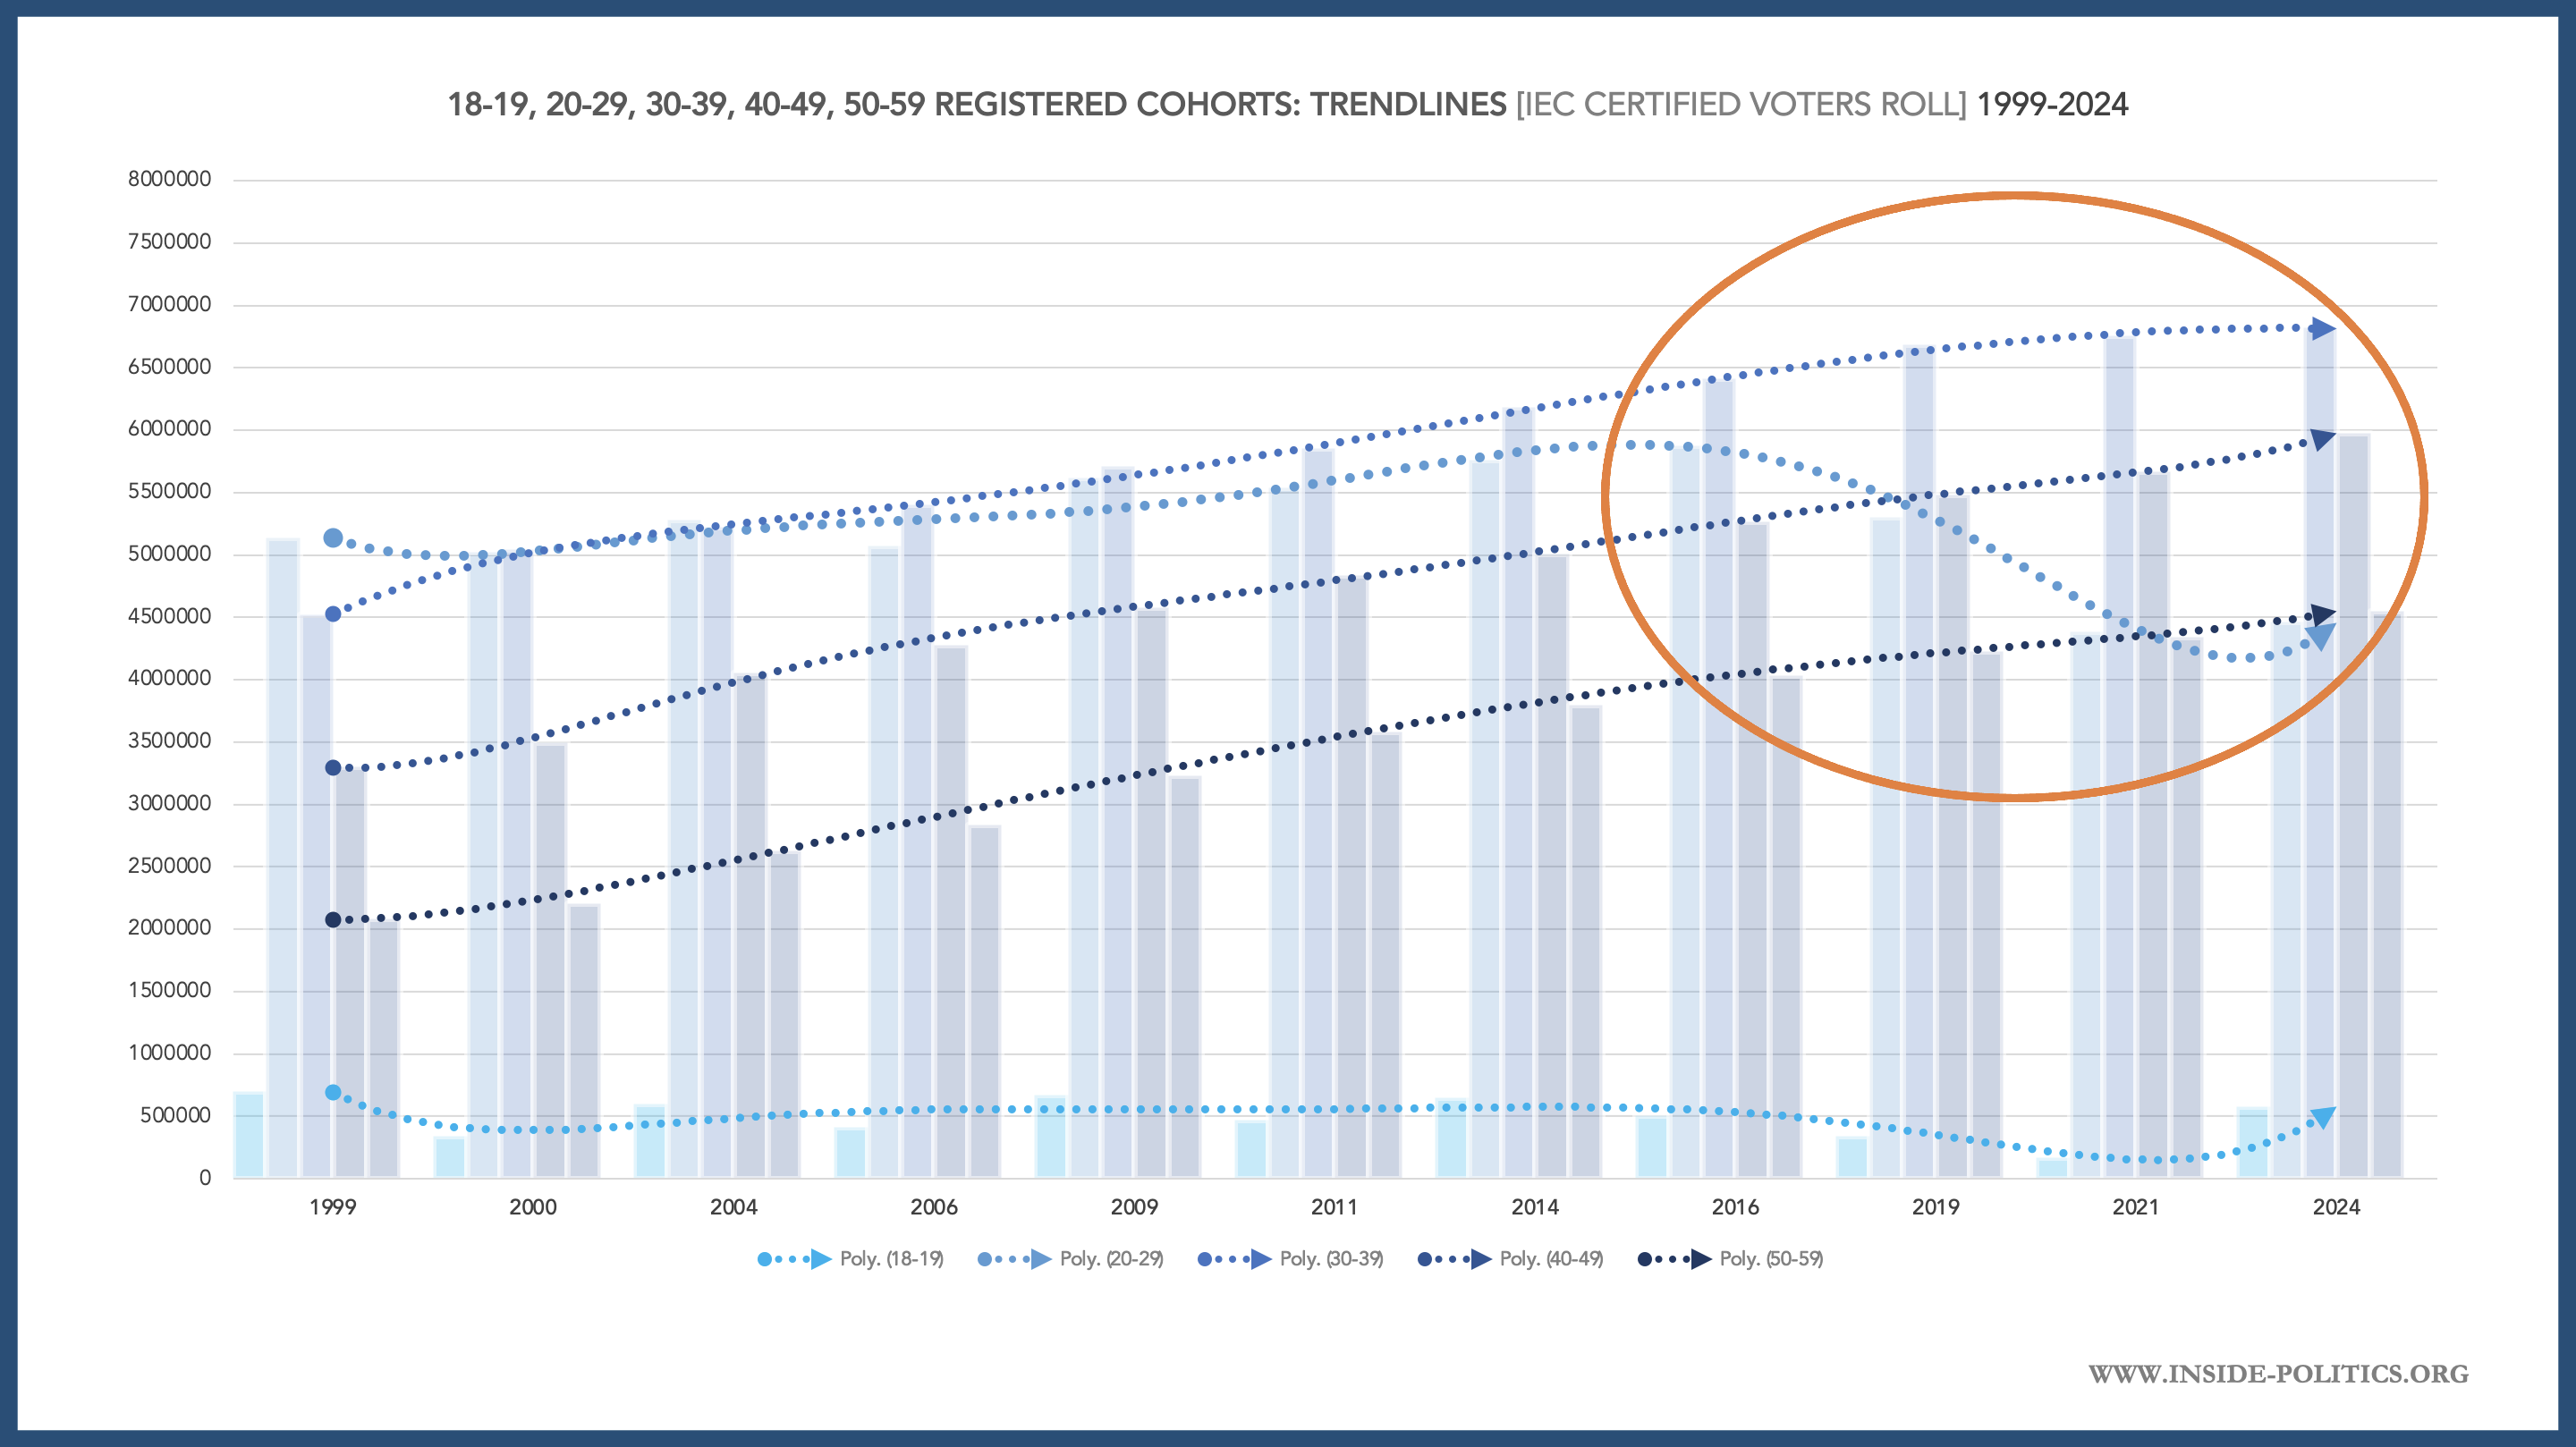
Disaggregate “the youth”, as above, and it is clear one particular cohort – 20-29 – is driving the decline in registrations. The other youth cohorts (18-19 and 30-39) are stable and growing respectively. And the older cohorts (40-49 and 50-59) are models of steady, systematic growth.
Here it is briefly worth saying something about the 18-19 cohort. A lot of fuss is made of this cohort, primarily because of the “first time voter” tag that goes with it. But it really is miniscule. It comprises just 2% of the total registered voter pool in 2024, and has never been worth more than 4%. In turn, the total 18-19 population comprises around 3% of SA’ total population in 2024, and has never comprised more than 4,5%.
Because it is so small, it is very volatile. 2021 saw a huge reduction in 18-19-year old registrations, but that was largely because of Covid, which affected all cohorts, only the effect was exaggerated when it came to 18-19-year-olds, because of the pool size. It has also bounced back in 2024 (growth of 246%, which is illustrative of its volatility).
Finally, people are only ever in this bracket for two years. Some people miss it completely (because of the two year gap between national and local elections) – and can only vote for the first time when they are 20 or 21. So it is often misleading. In general terms, it is not great for substantive insight.
3. Why the 20-29 registered cohort is declining
There are many reasons the 20-29 cohort is declining, but population decline is one of the more important reasons. The graph below sets out the StatsSA mid-year population estimates for the each of the five cohorts, for each election over the past 20 years.
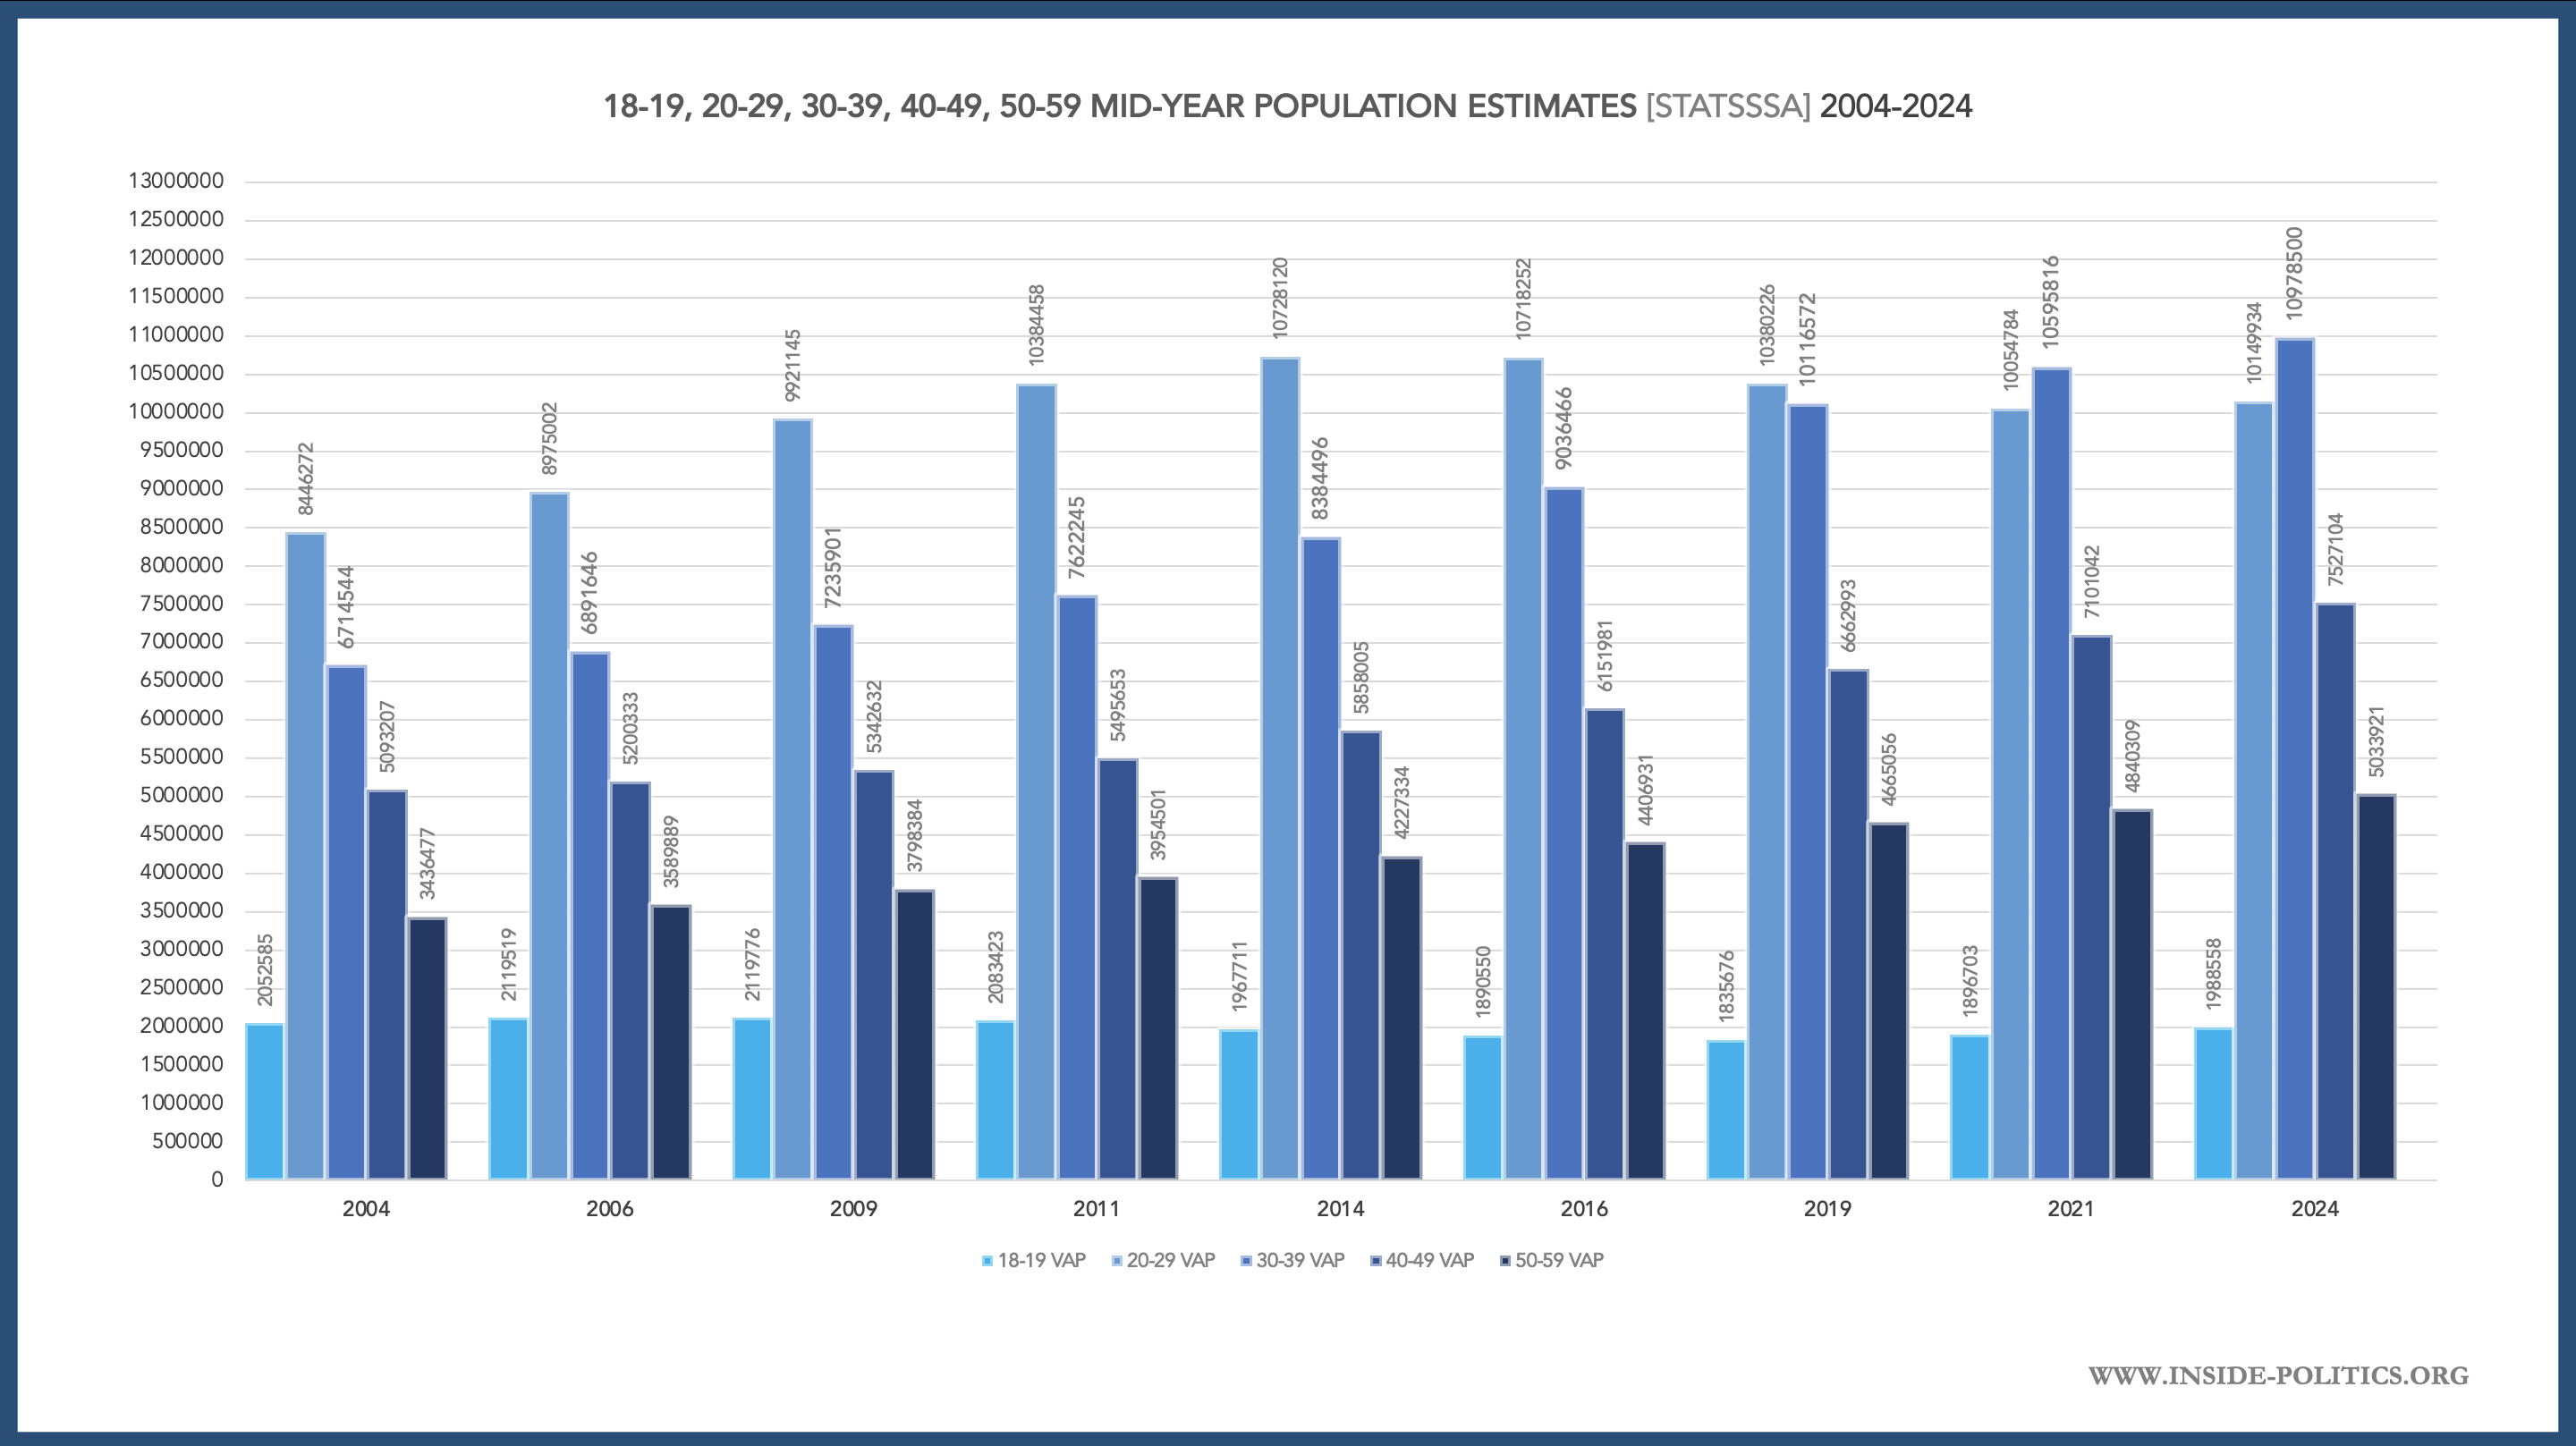
And, here is the same graph, but with the trend-lines for each cohort.
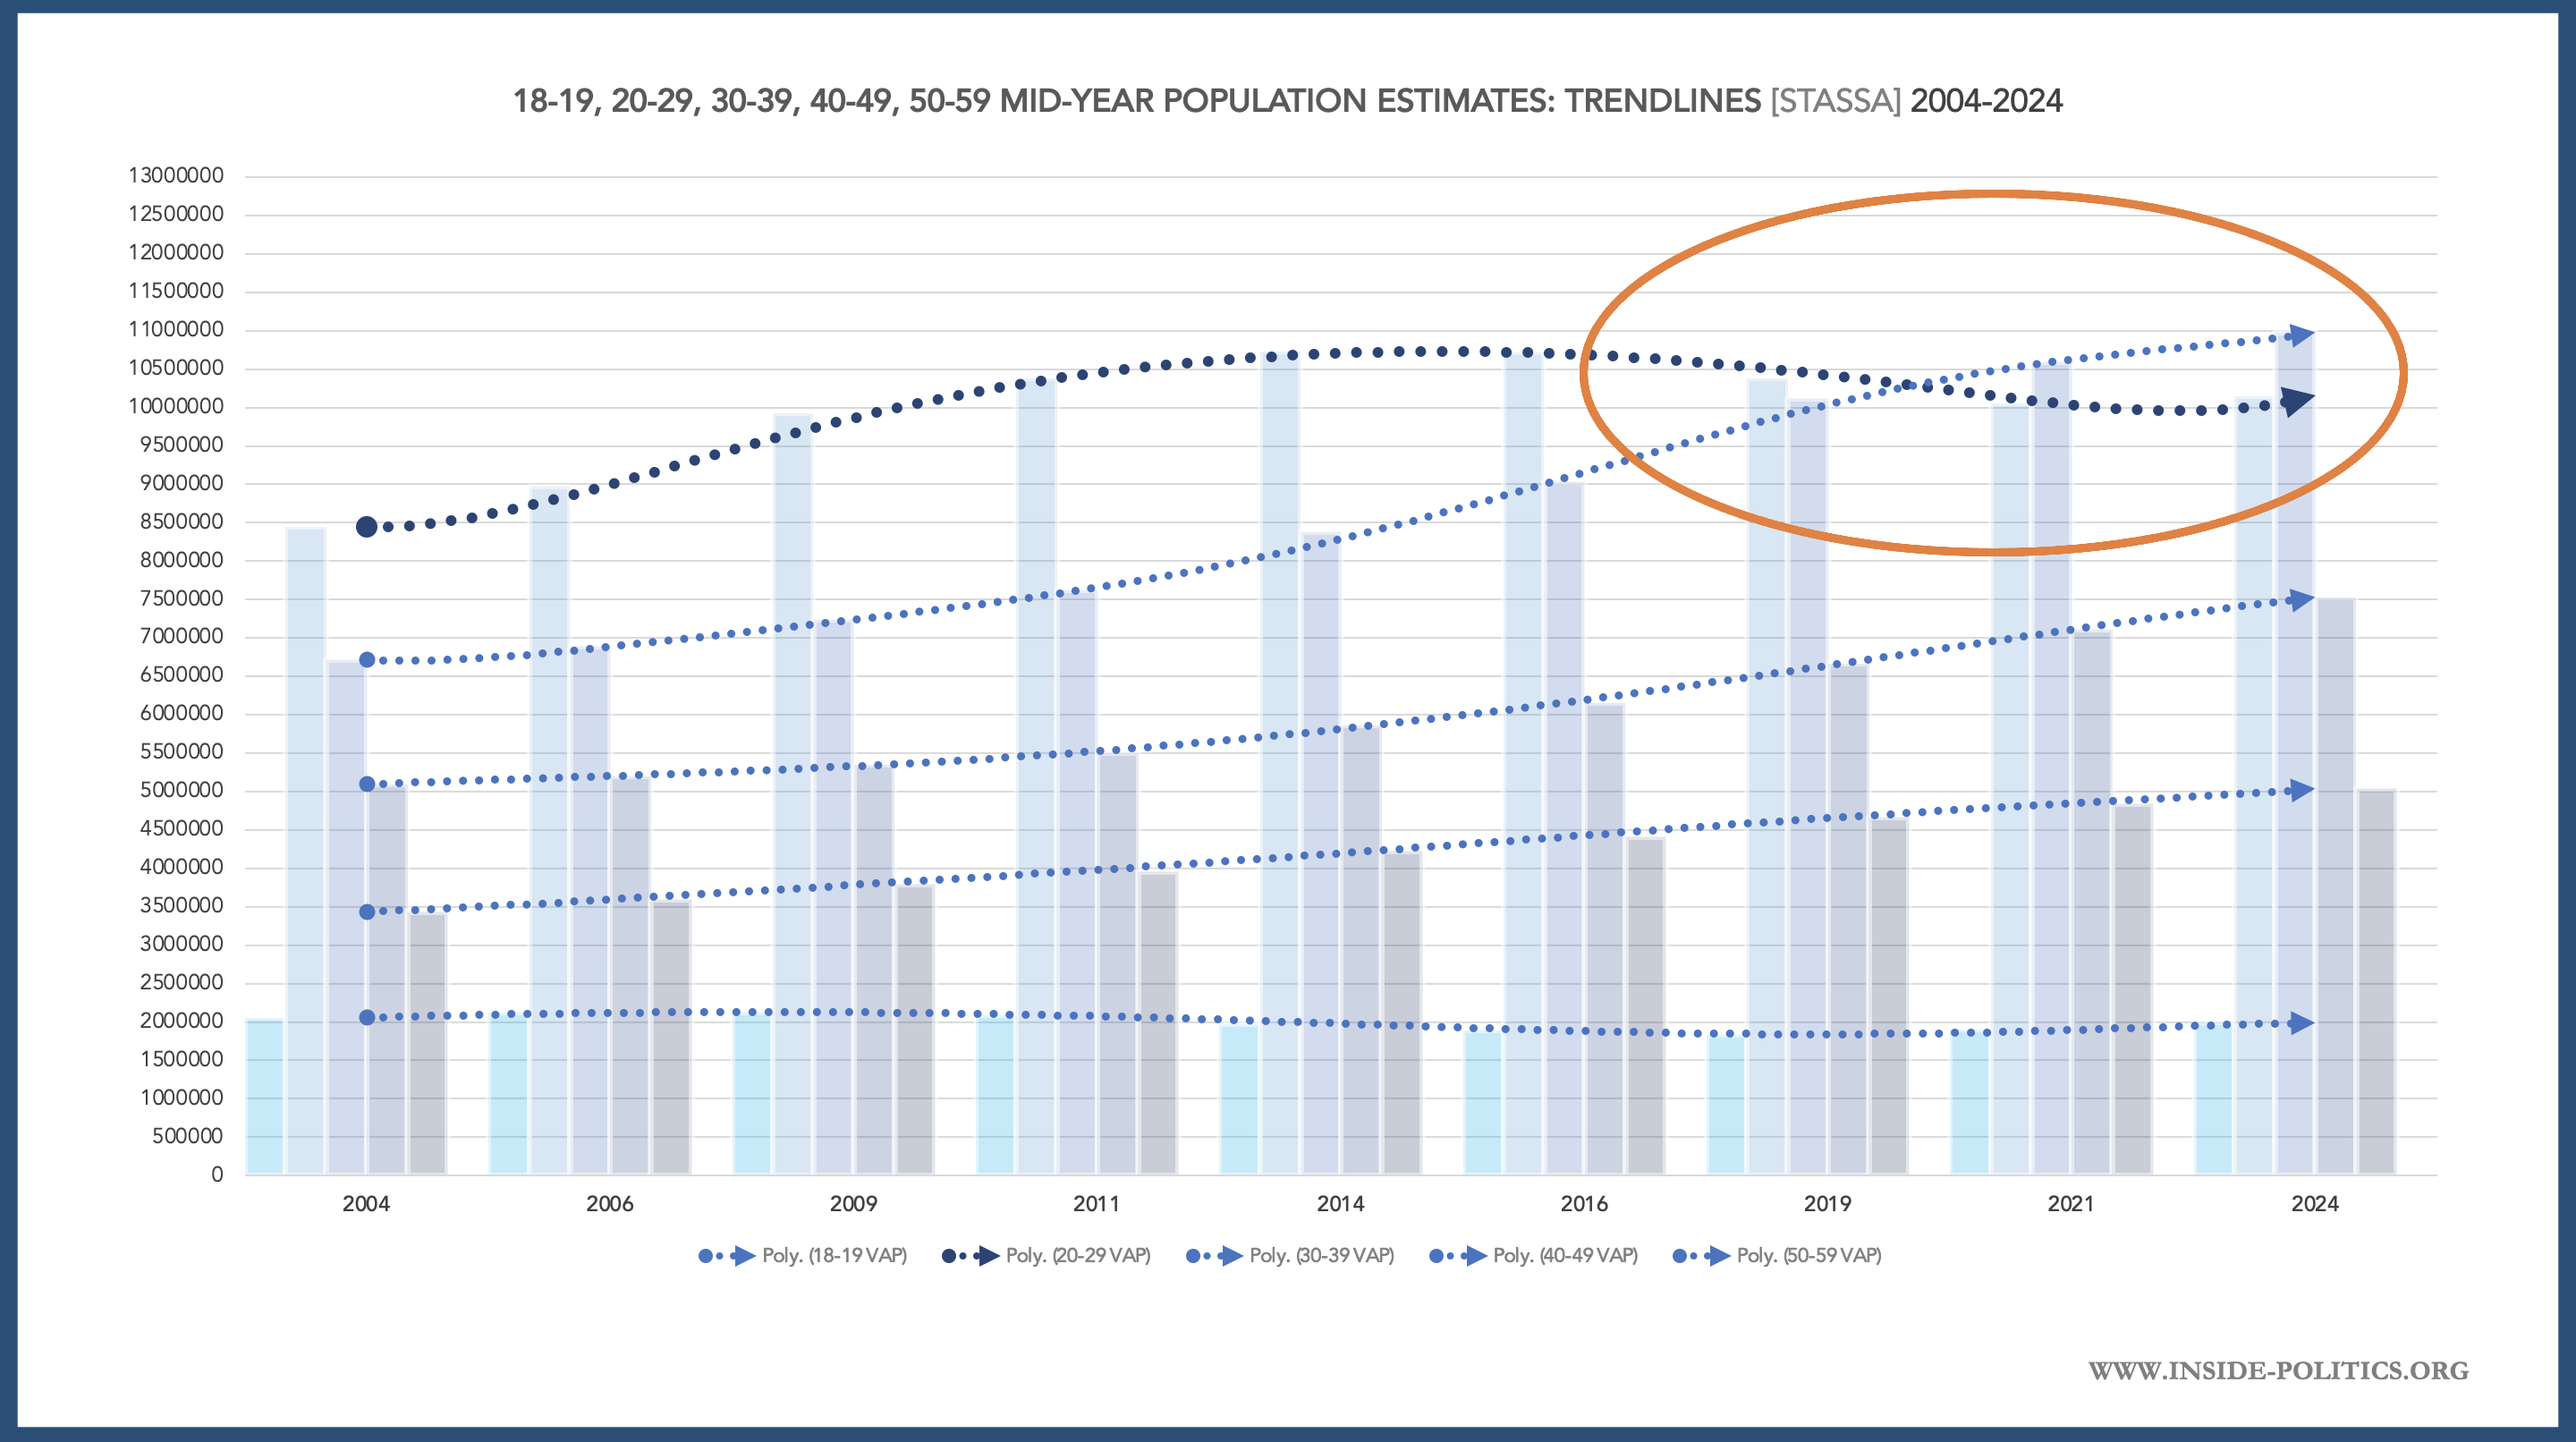
The total 18-19, 30-39, 40-49 and 50-59 population cohorts are all healthy and growing. The 20-29 cohort did actually see extraordinary growth from 2004 to 2014 but, since then, it has declined, although 2024 has seen a small uptick. There is a better way, however, to illustrate the relationship between the 20-29 general population and the 20-29 registered voting population.
If we map the increases and declines in the registered population and total population, for the 20-29 cohort, for each election, we get the graph below:
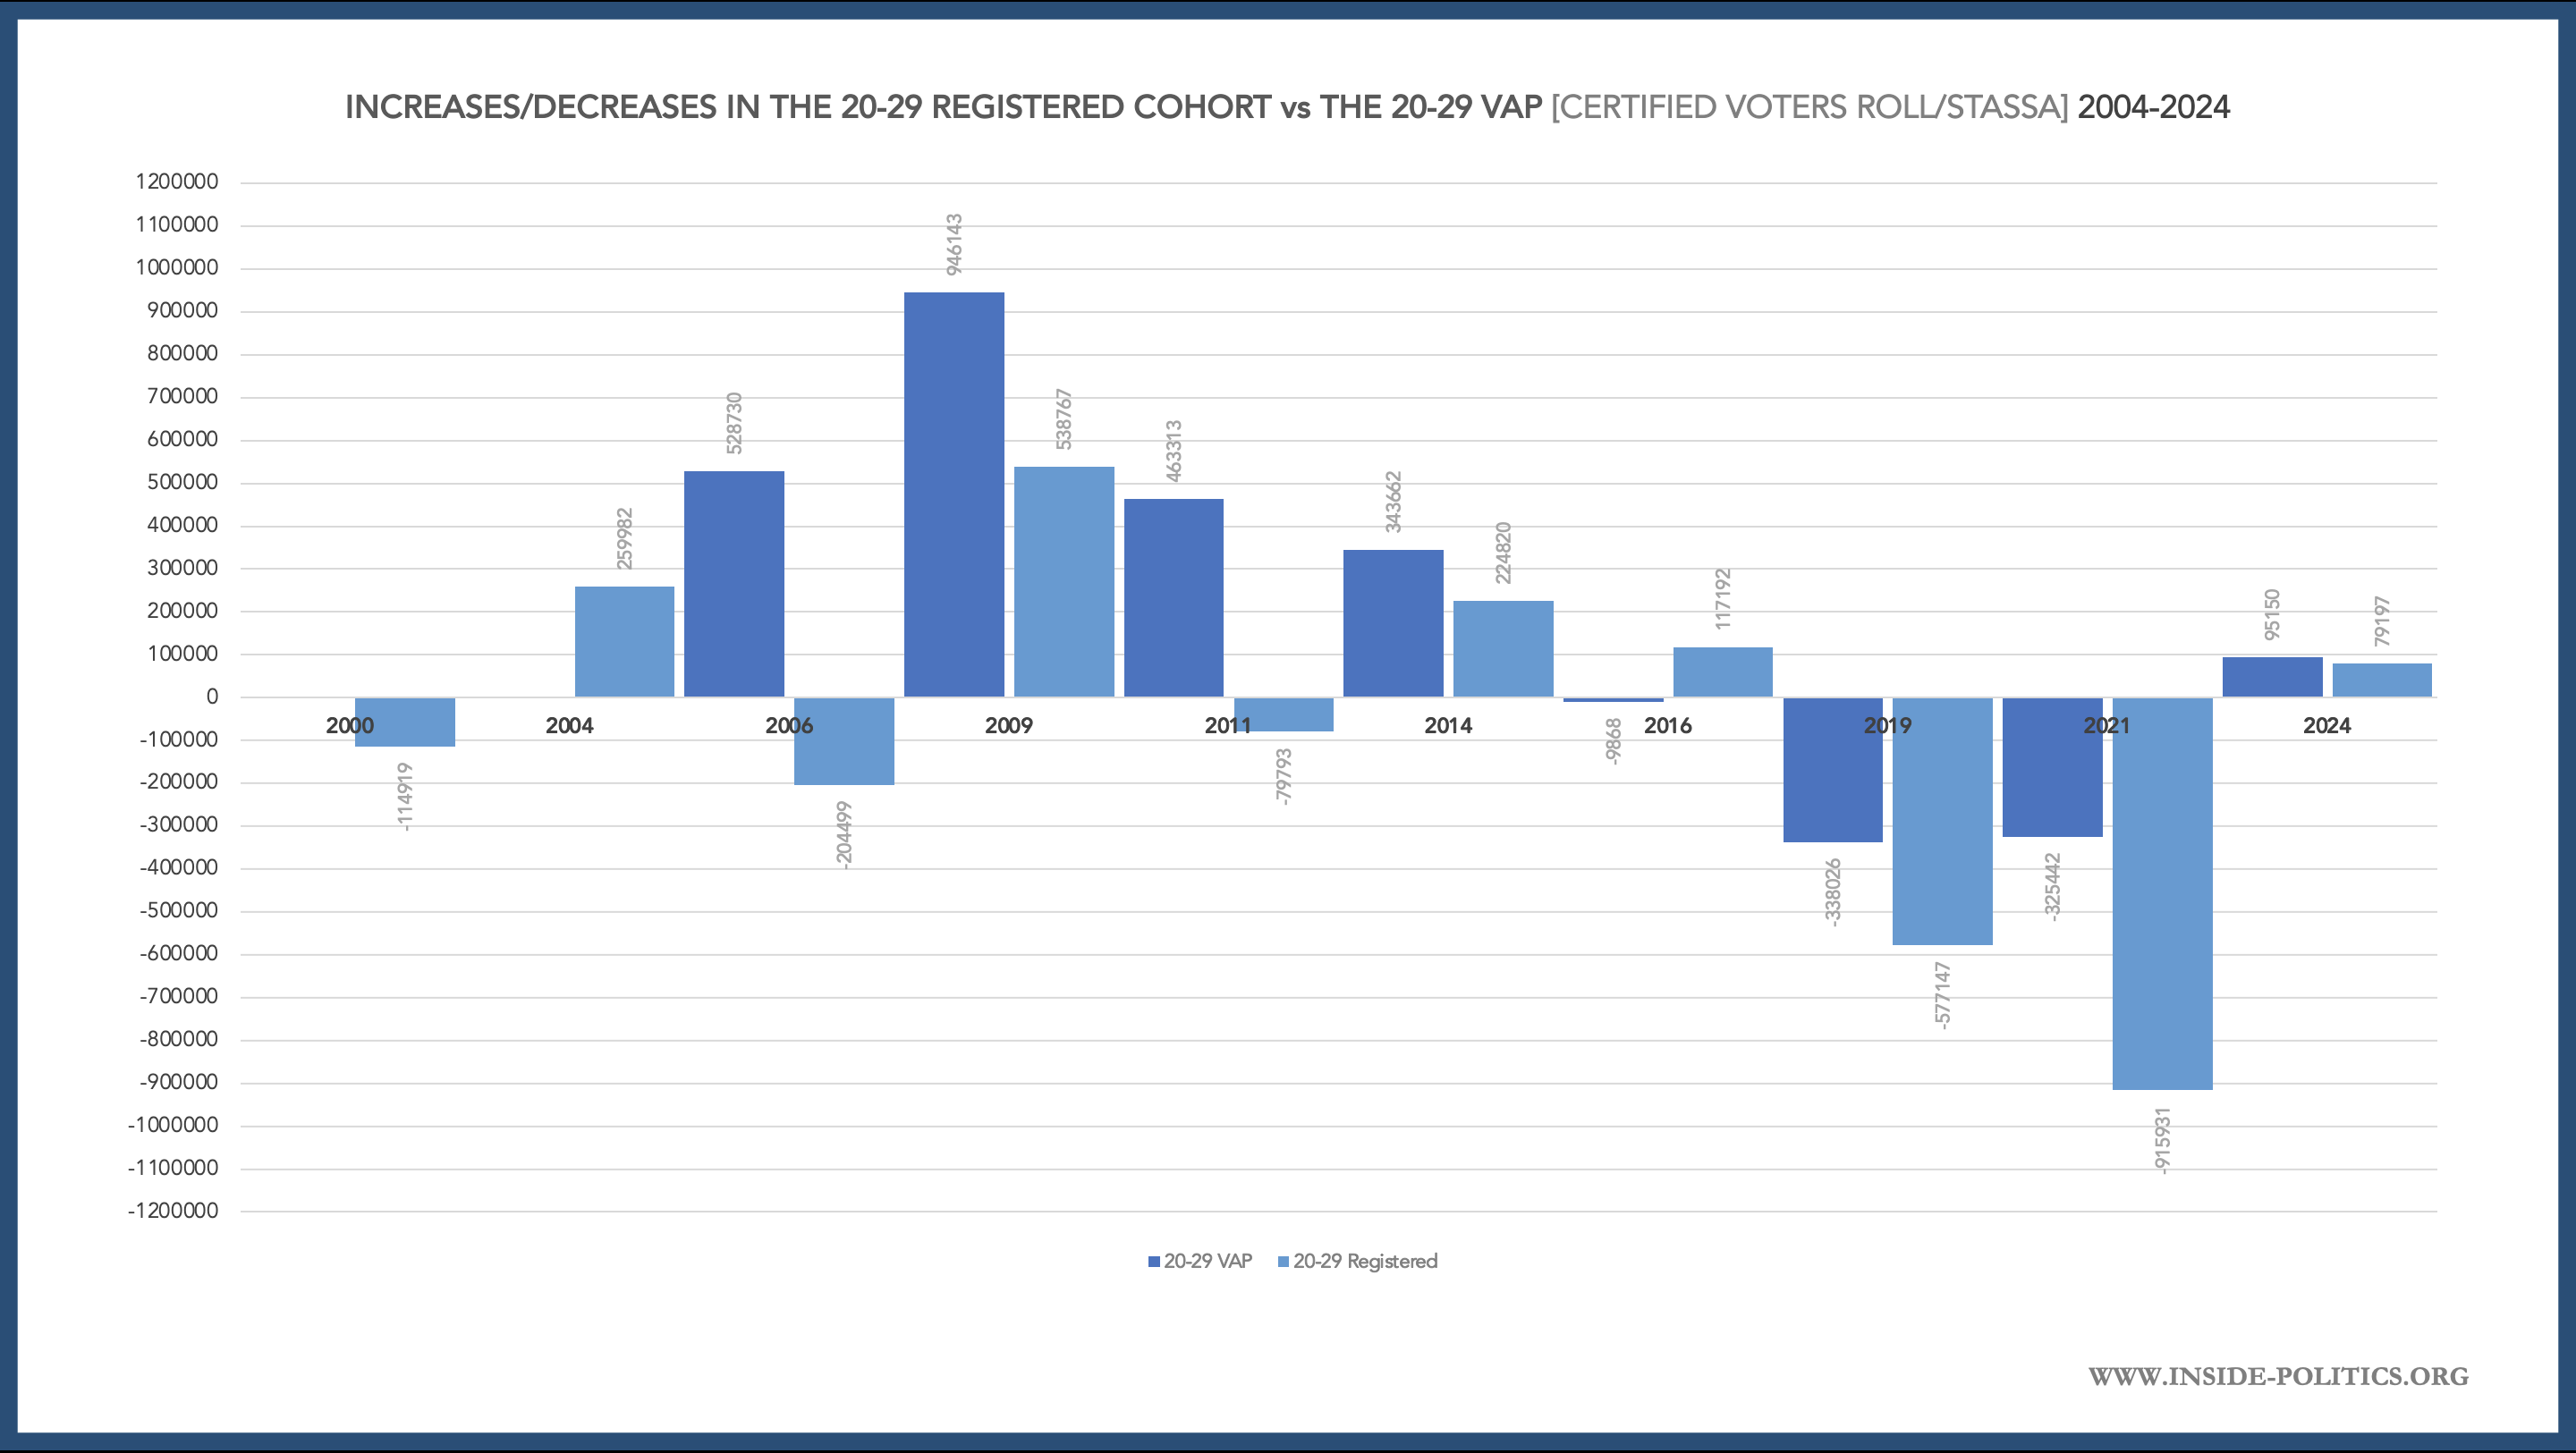
There is a clear correlation between the two (certainly in national elections, local elections always being bad for registration across all cohorts). Generally, when the general 20-29 population goes up, so does the registered 20-29 population, and vice versa. That pattern becomes clearer still when we include the relevant trend-lines, as below:
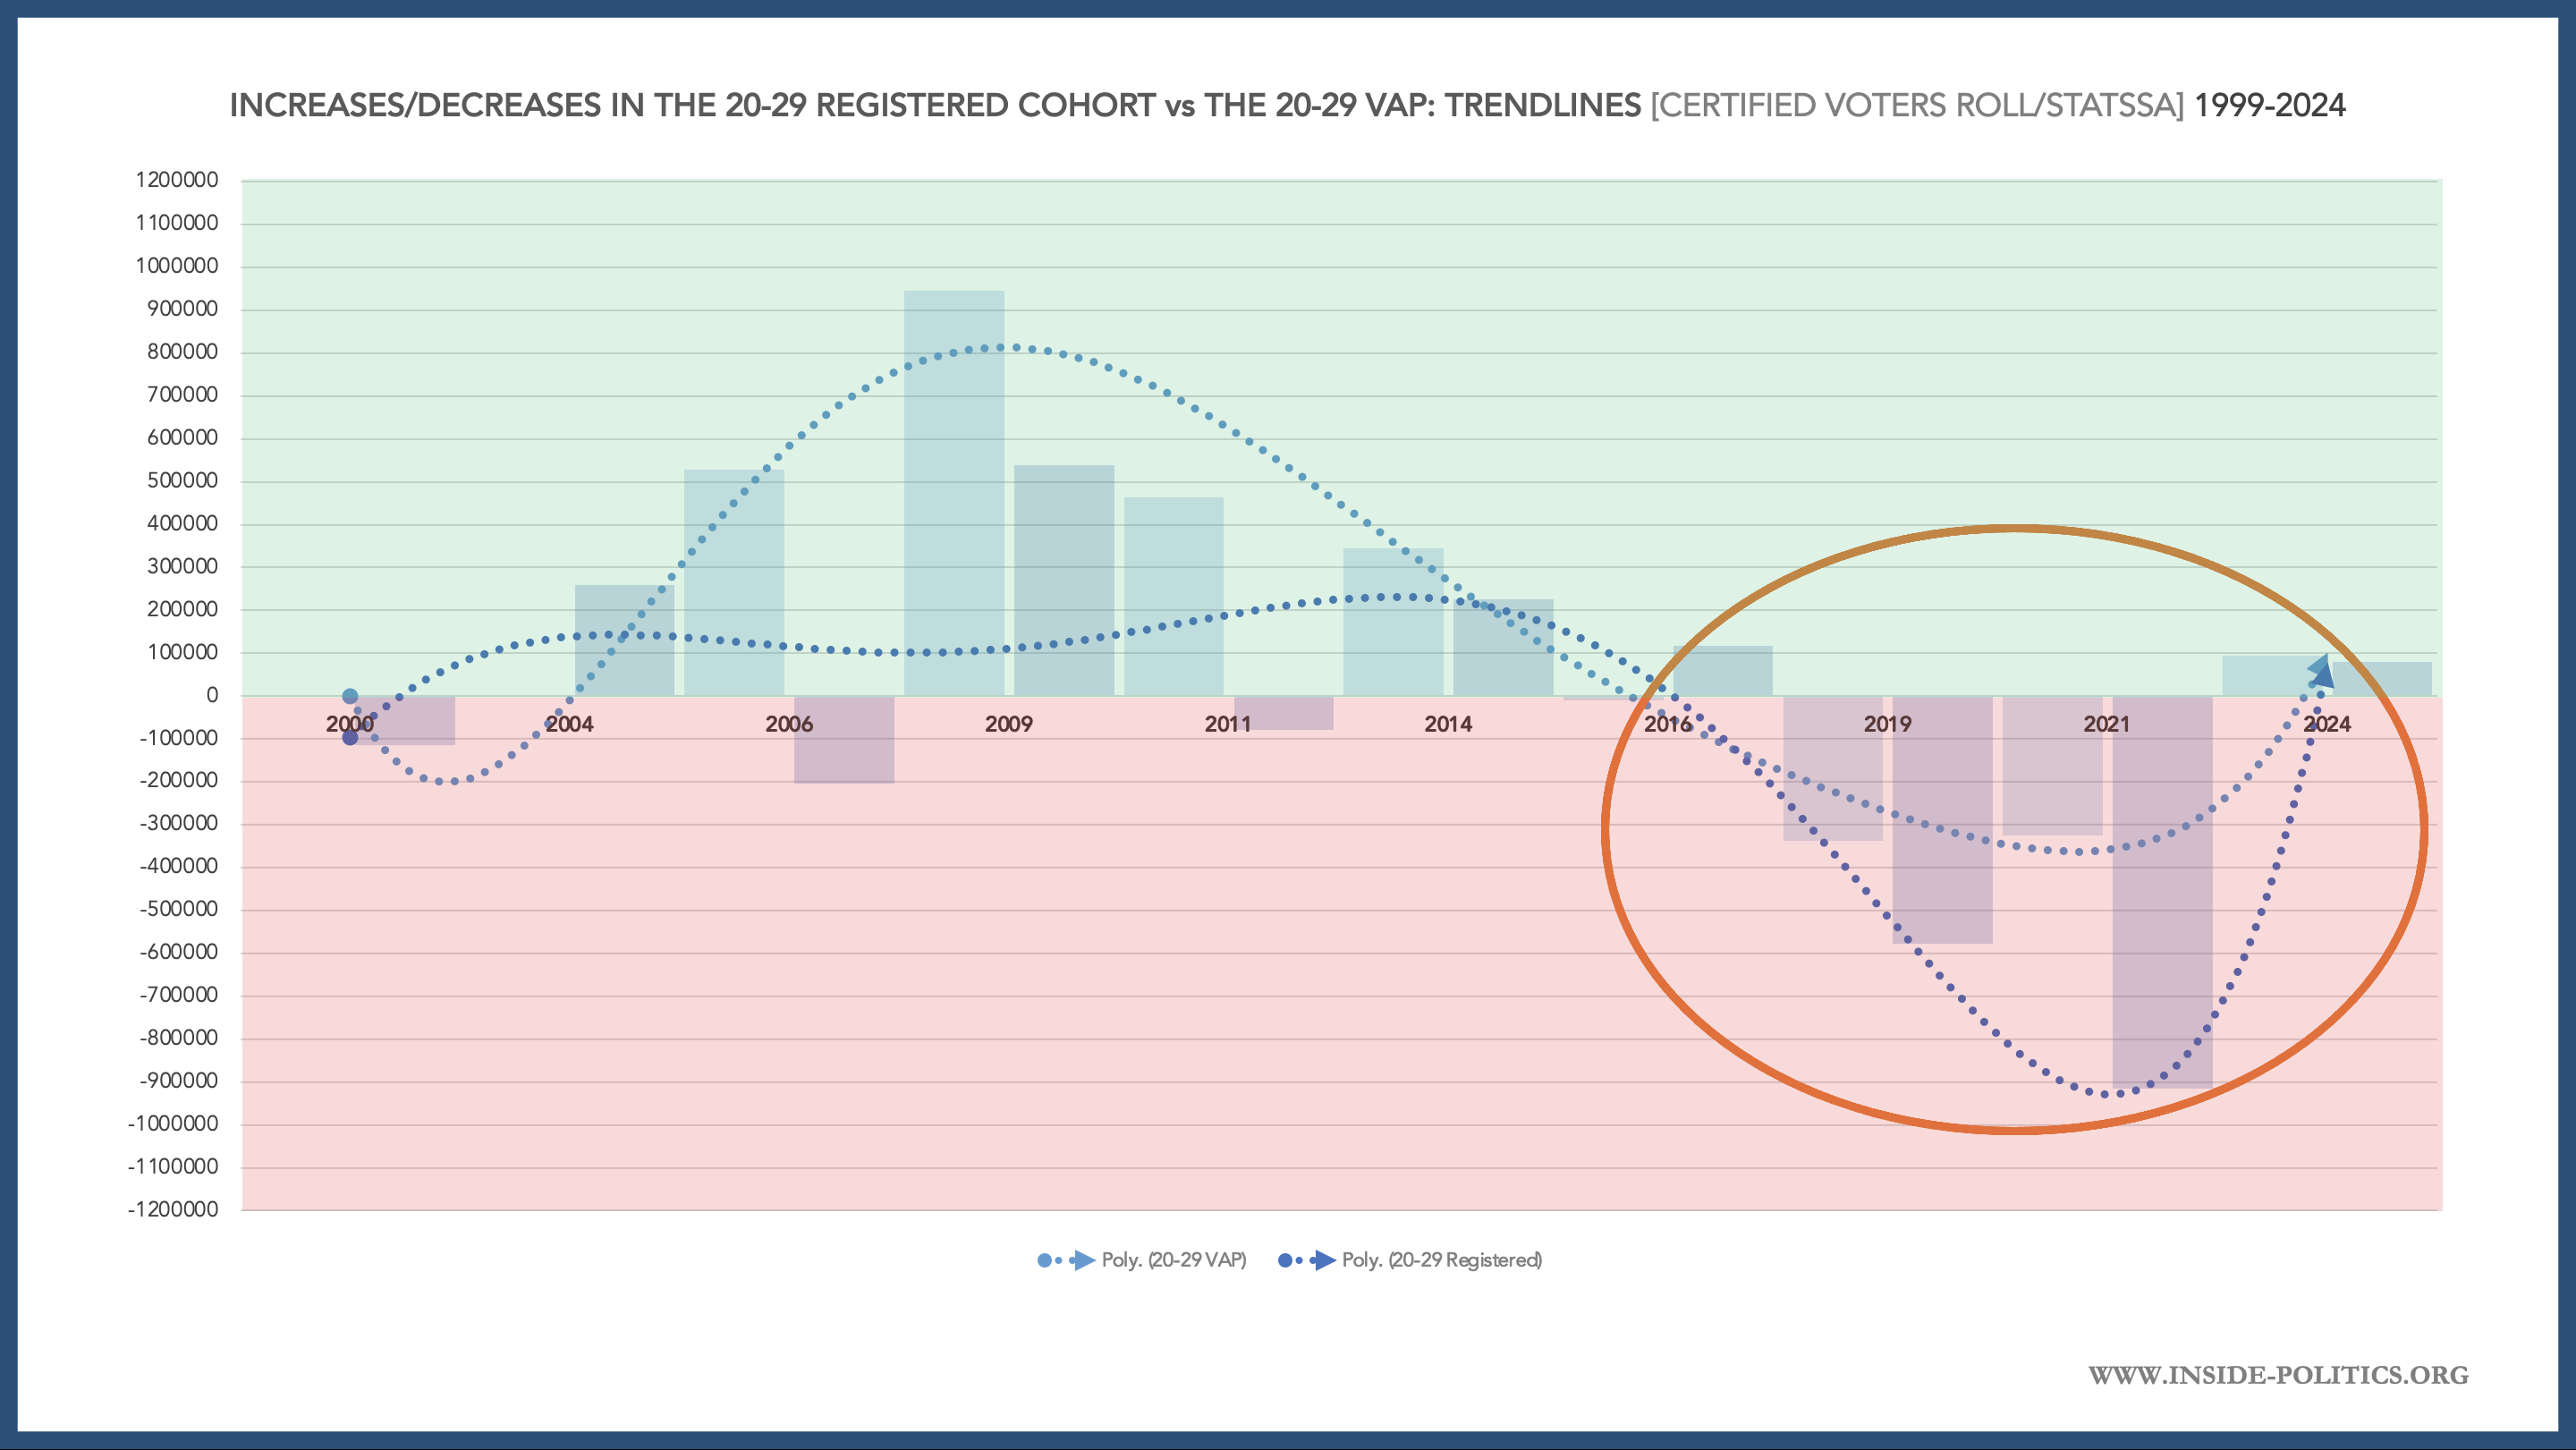
Between 2016 and 2021 the registered 20-29 cohort declined by 1,493,078. Between the same period, the total 20-29 VAP declined by 663,468.
It is true, the decline in the 20-29 general population does not fully match the steeper decline in 20-29 registrations (in other words, there are other reasons driving it besides) but it is obviously a factor.
So, a significant part of the 20-29 registration decline can be more or less attributed to a declining 20-29 population, at least in general terms. Yet, this is never mentioned in the popular narrative about youth participation, as a reason aside from disillusionment. That is hard to understand.
Another important variable is how each youth cohort fairs when compared to their respective total population cohort. Here are the three respective graphs:
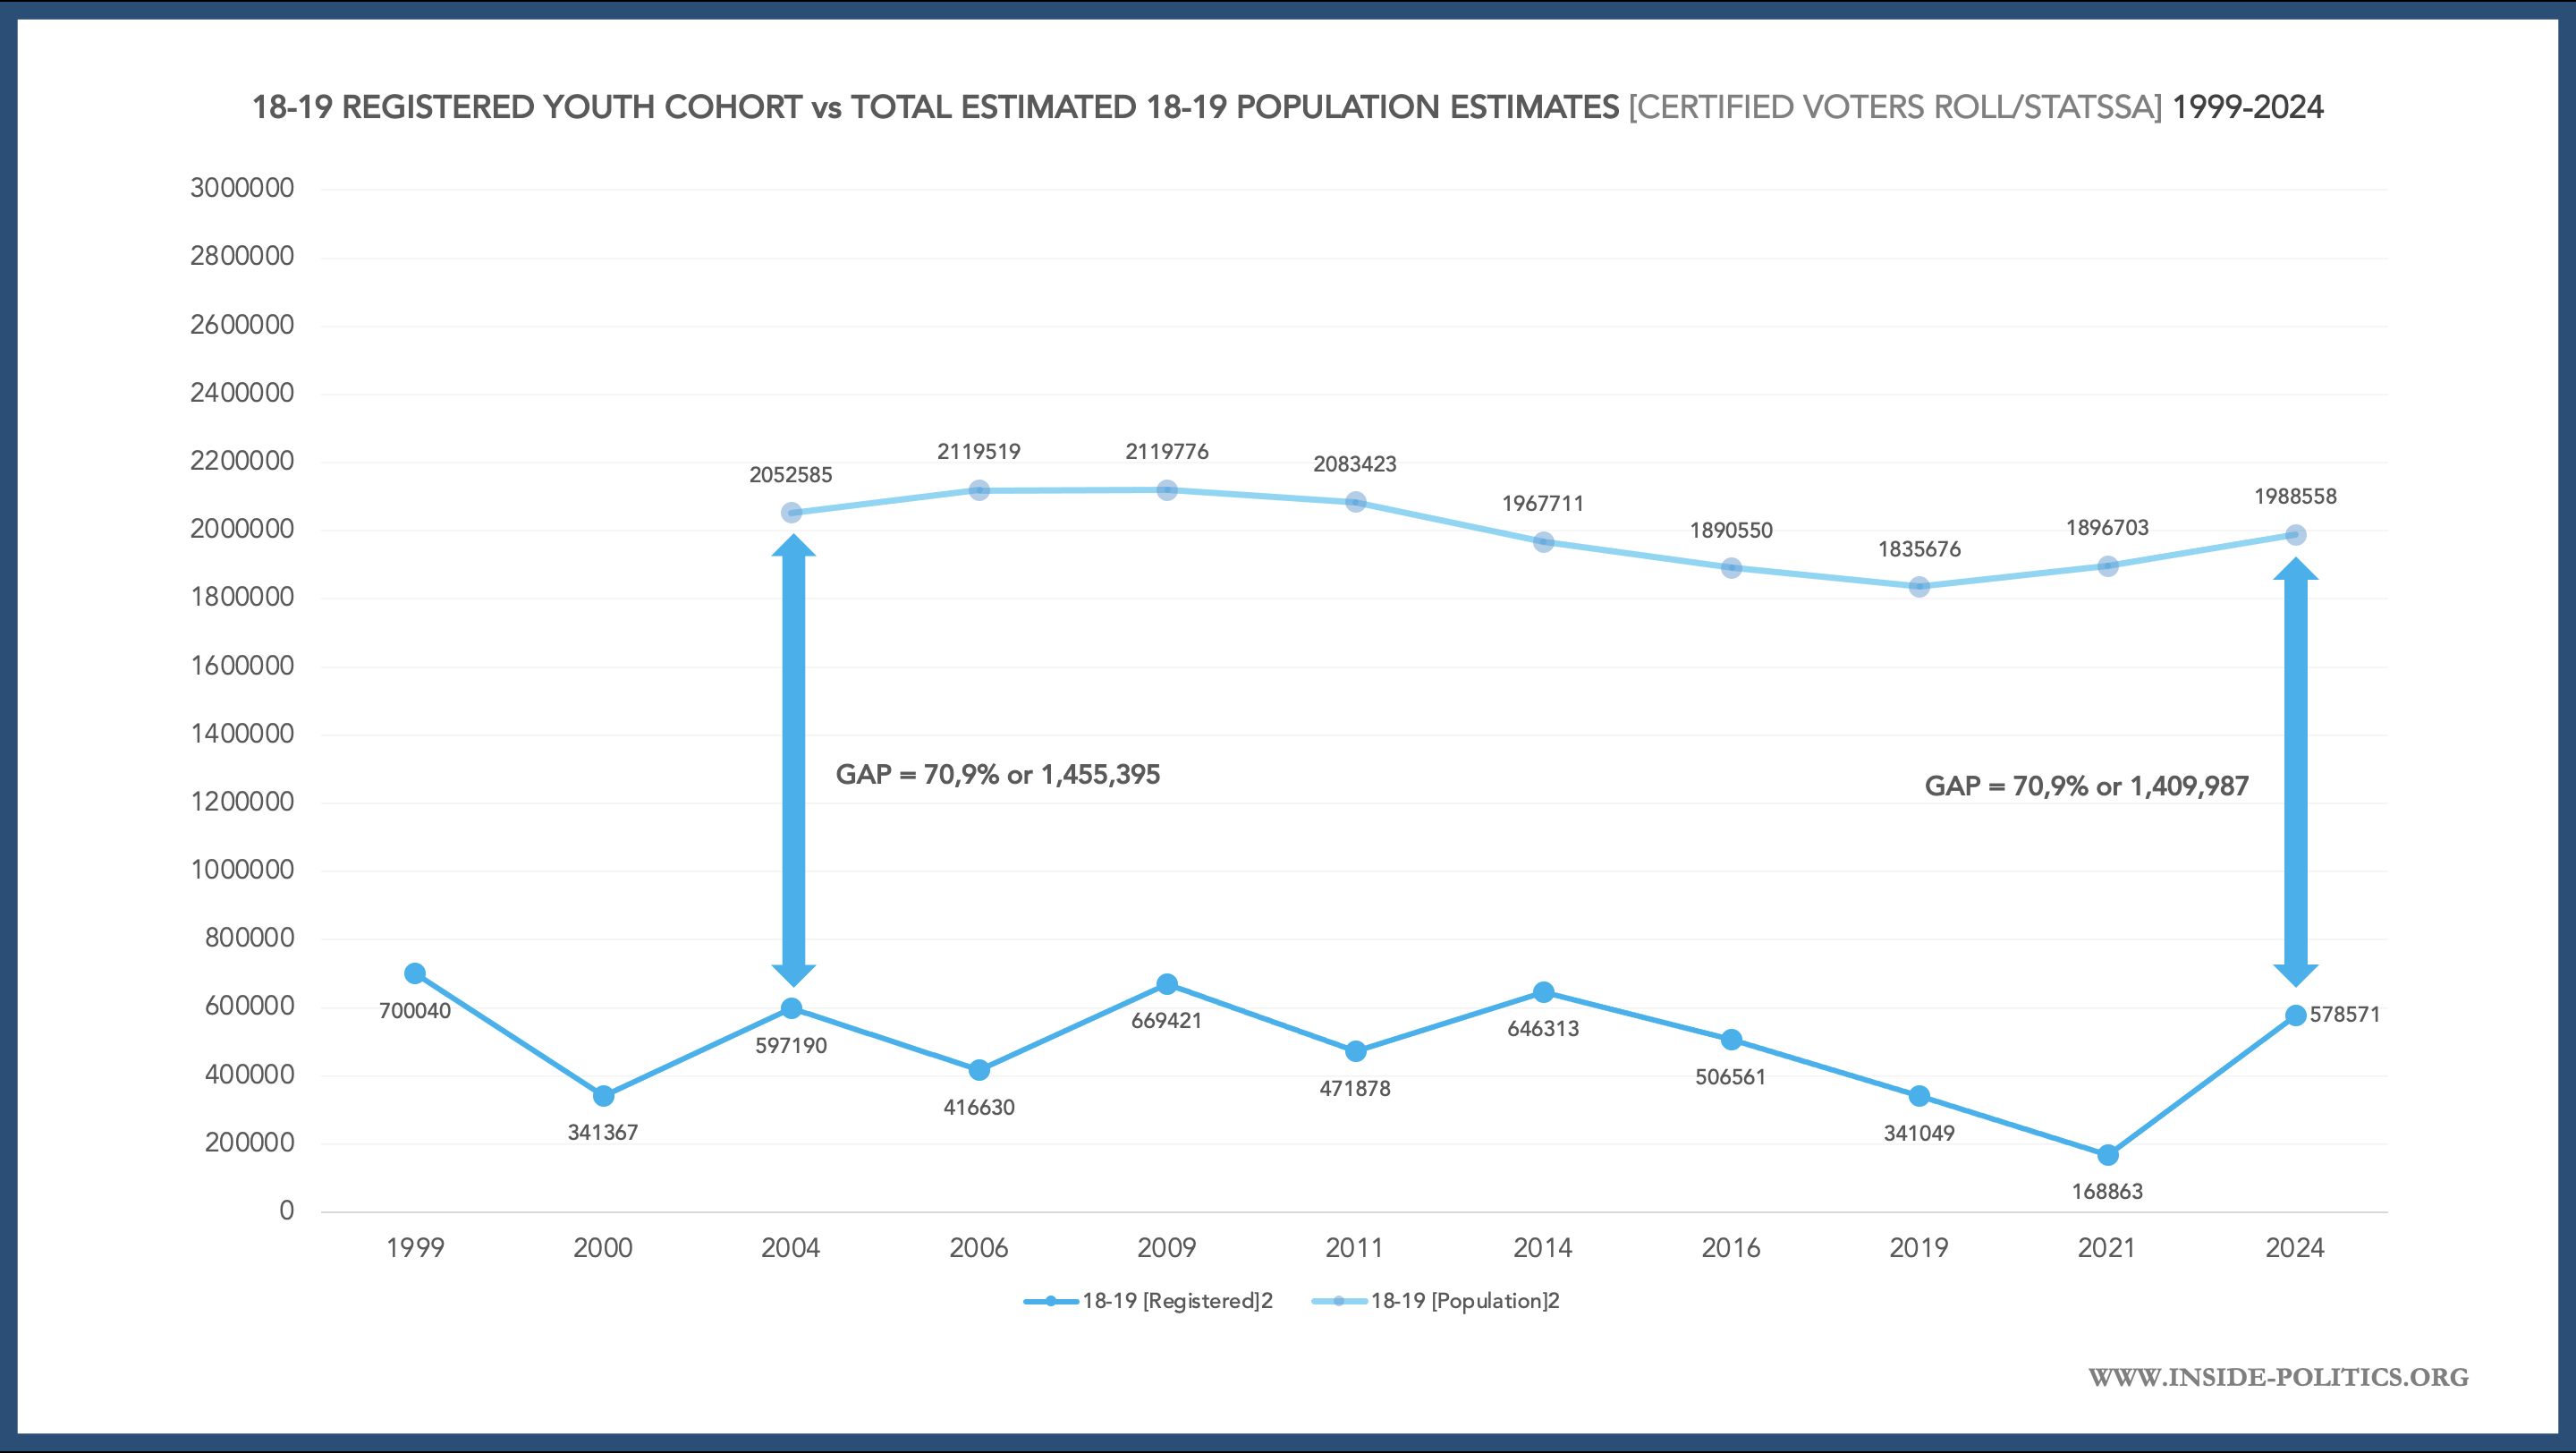
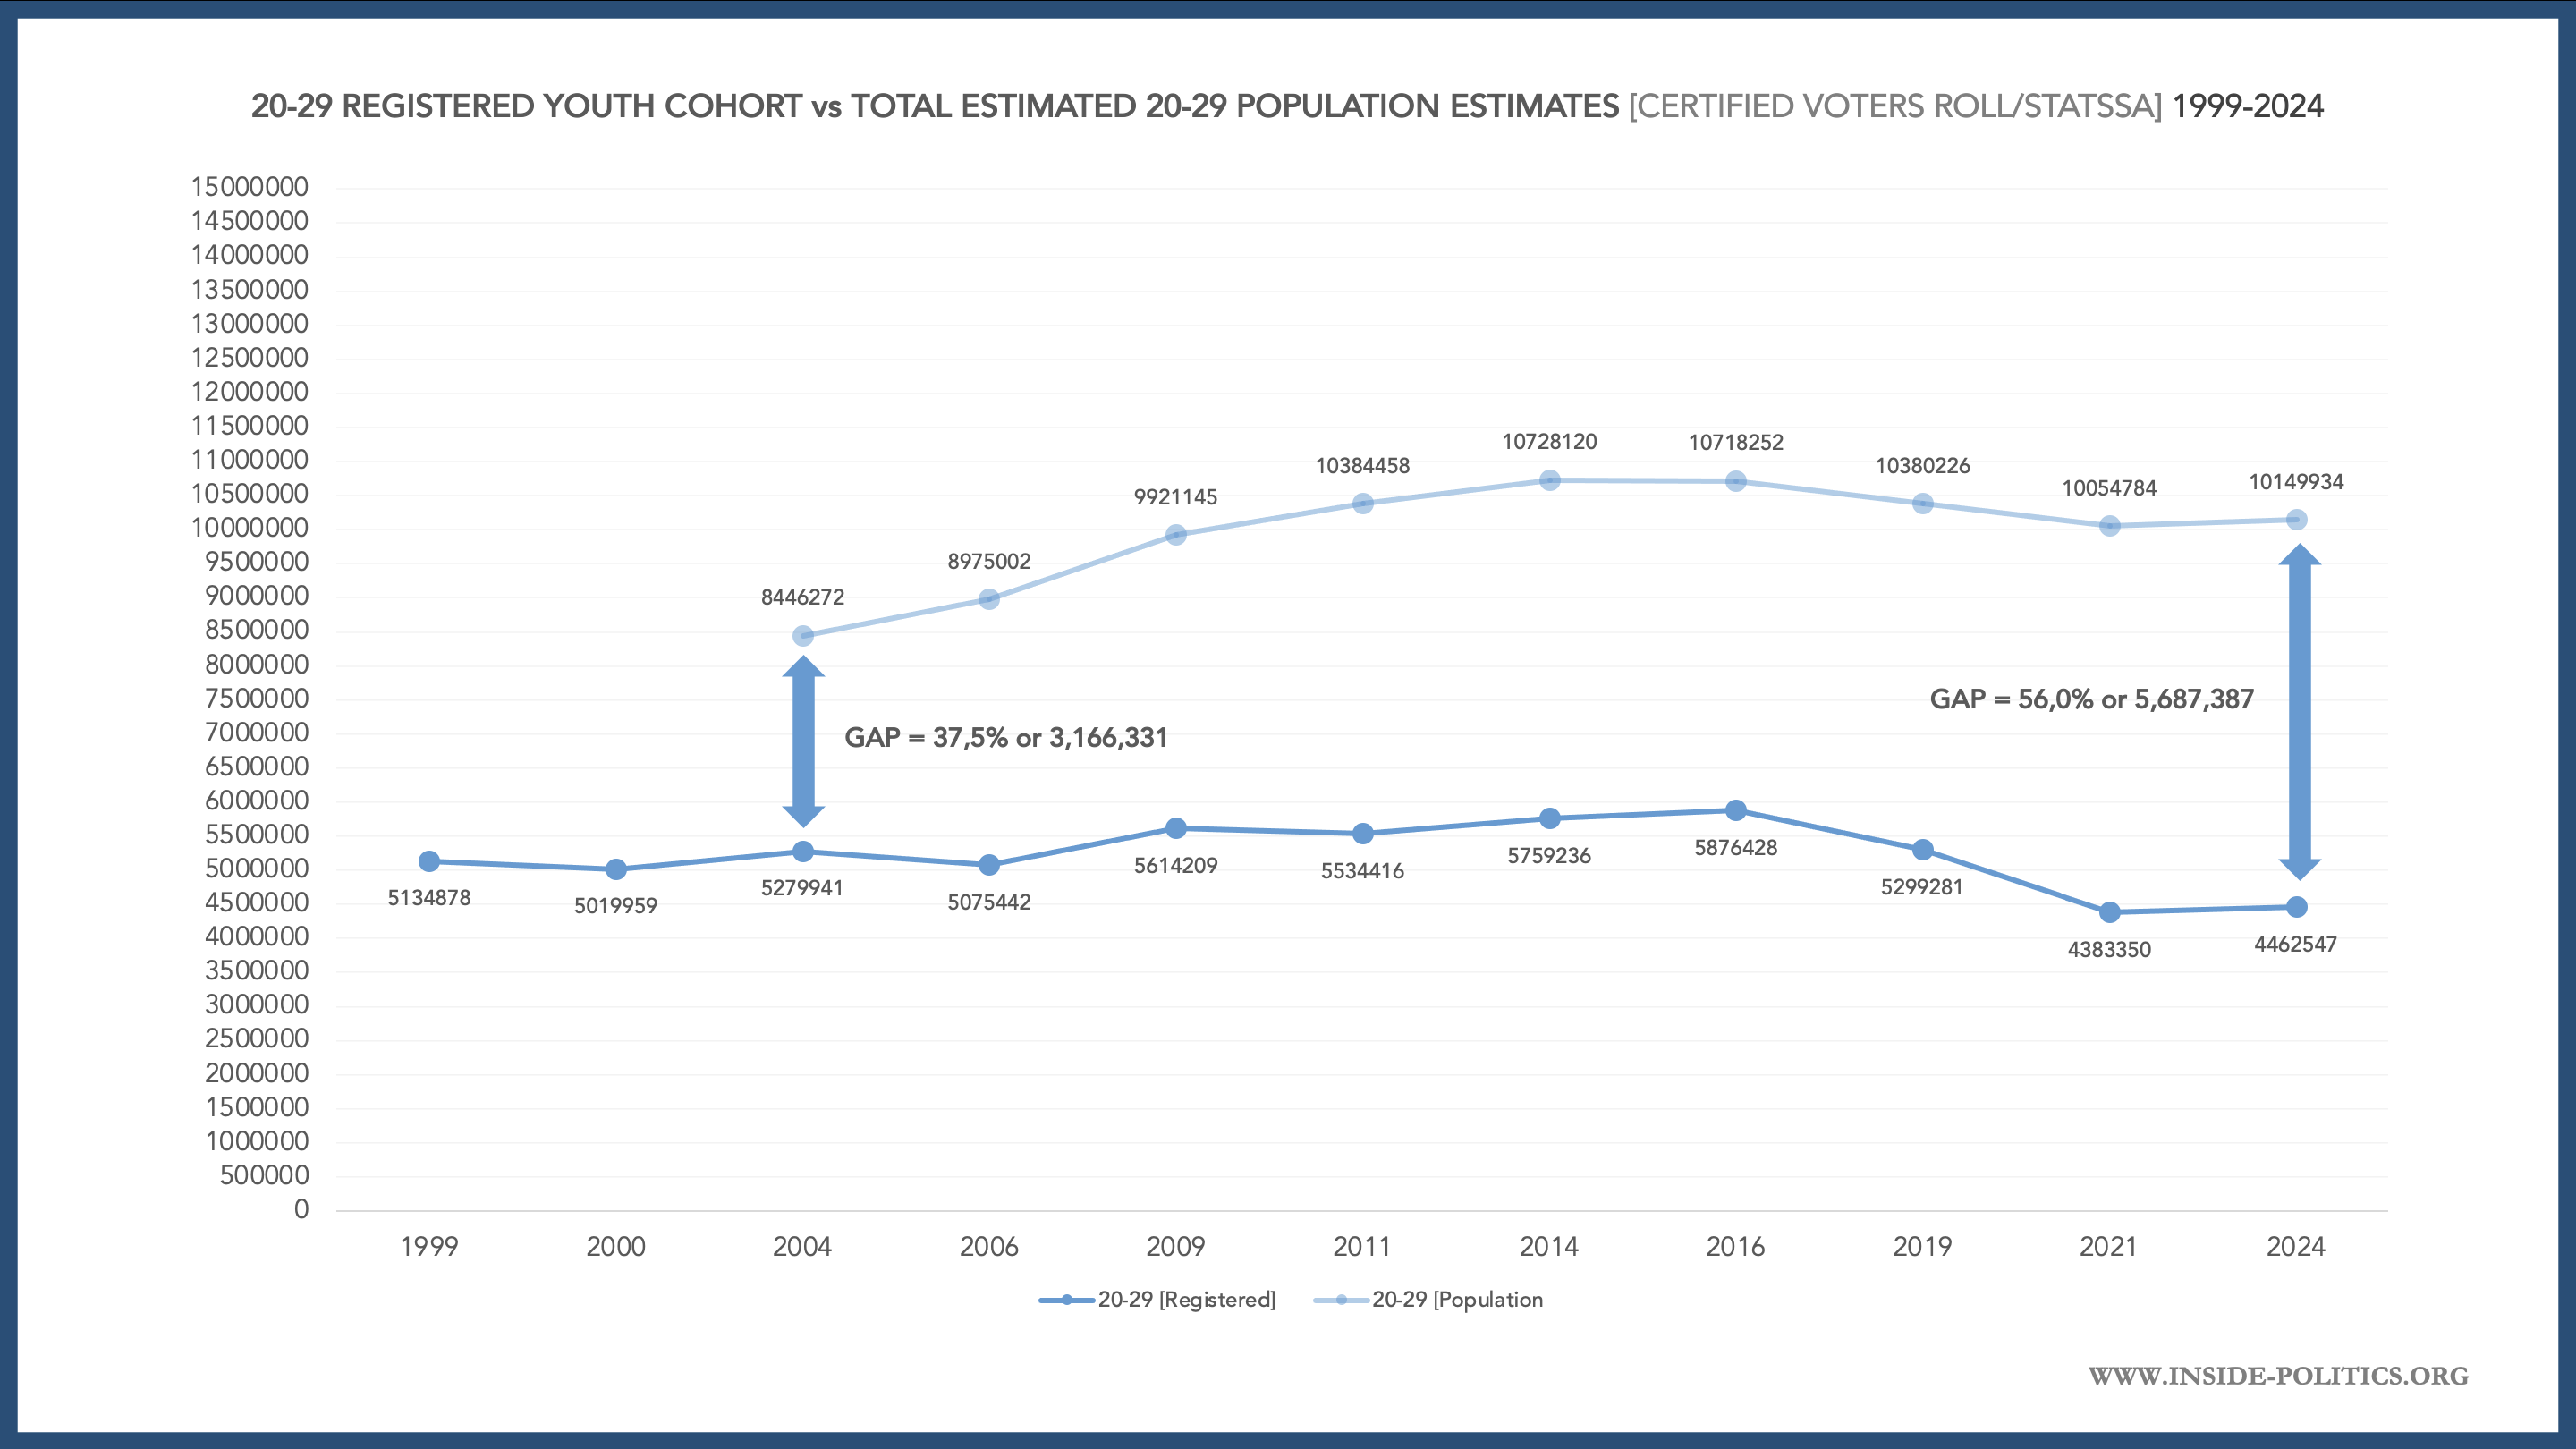
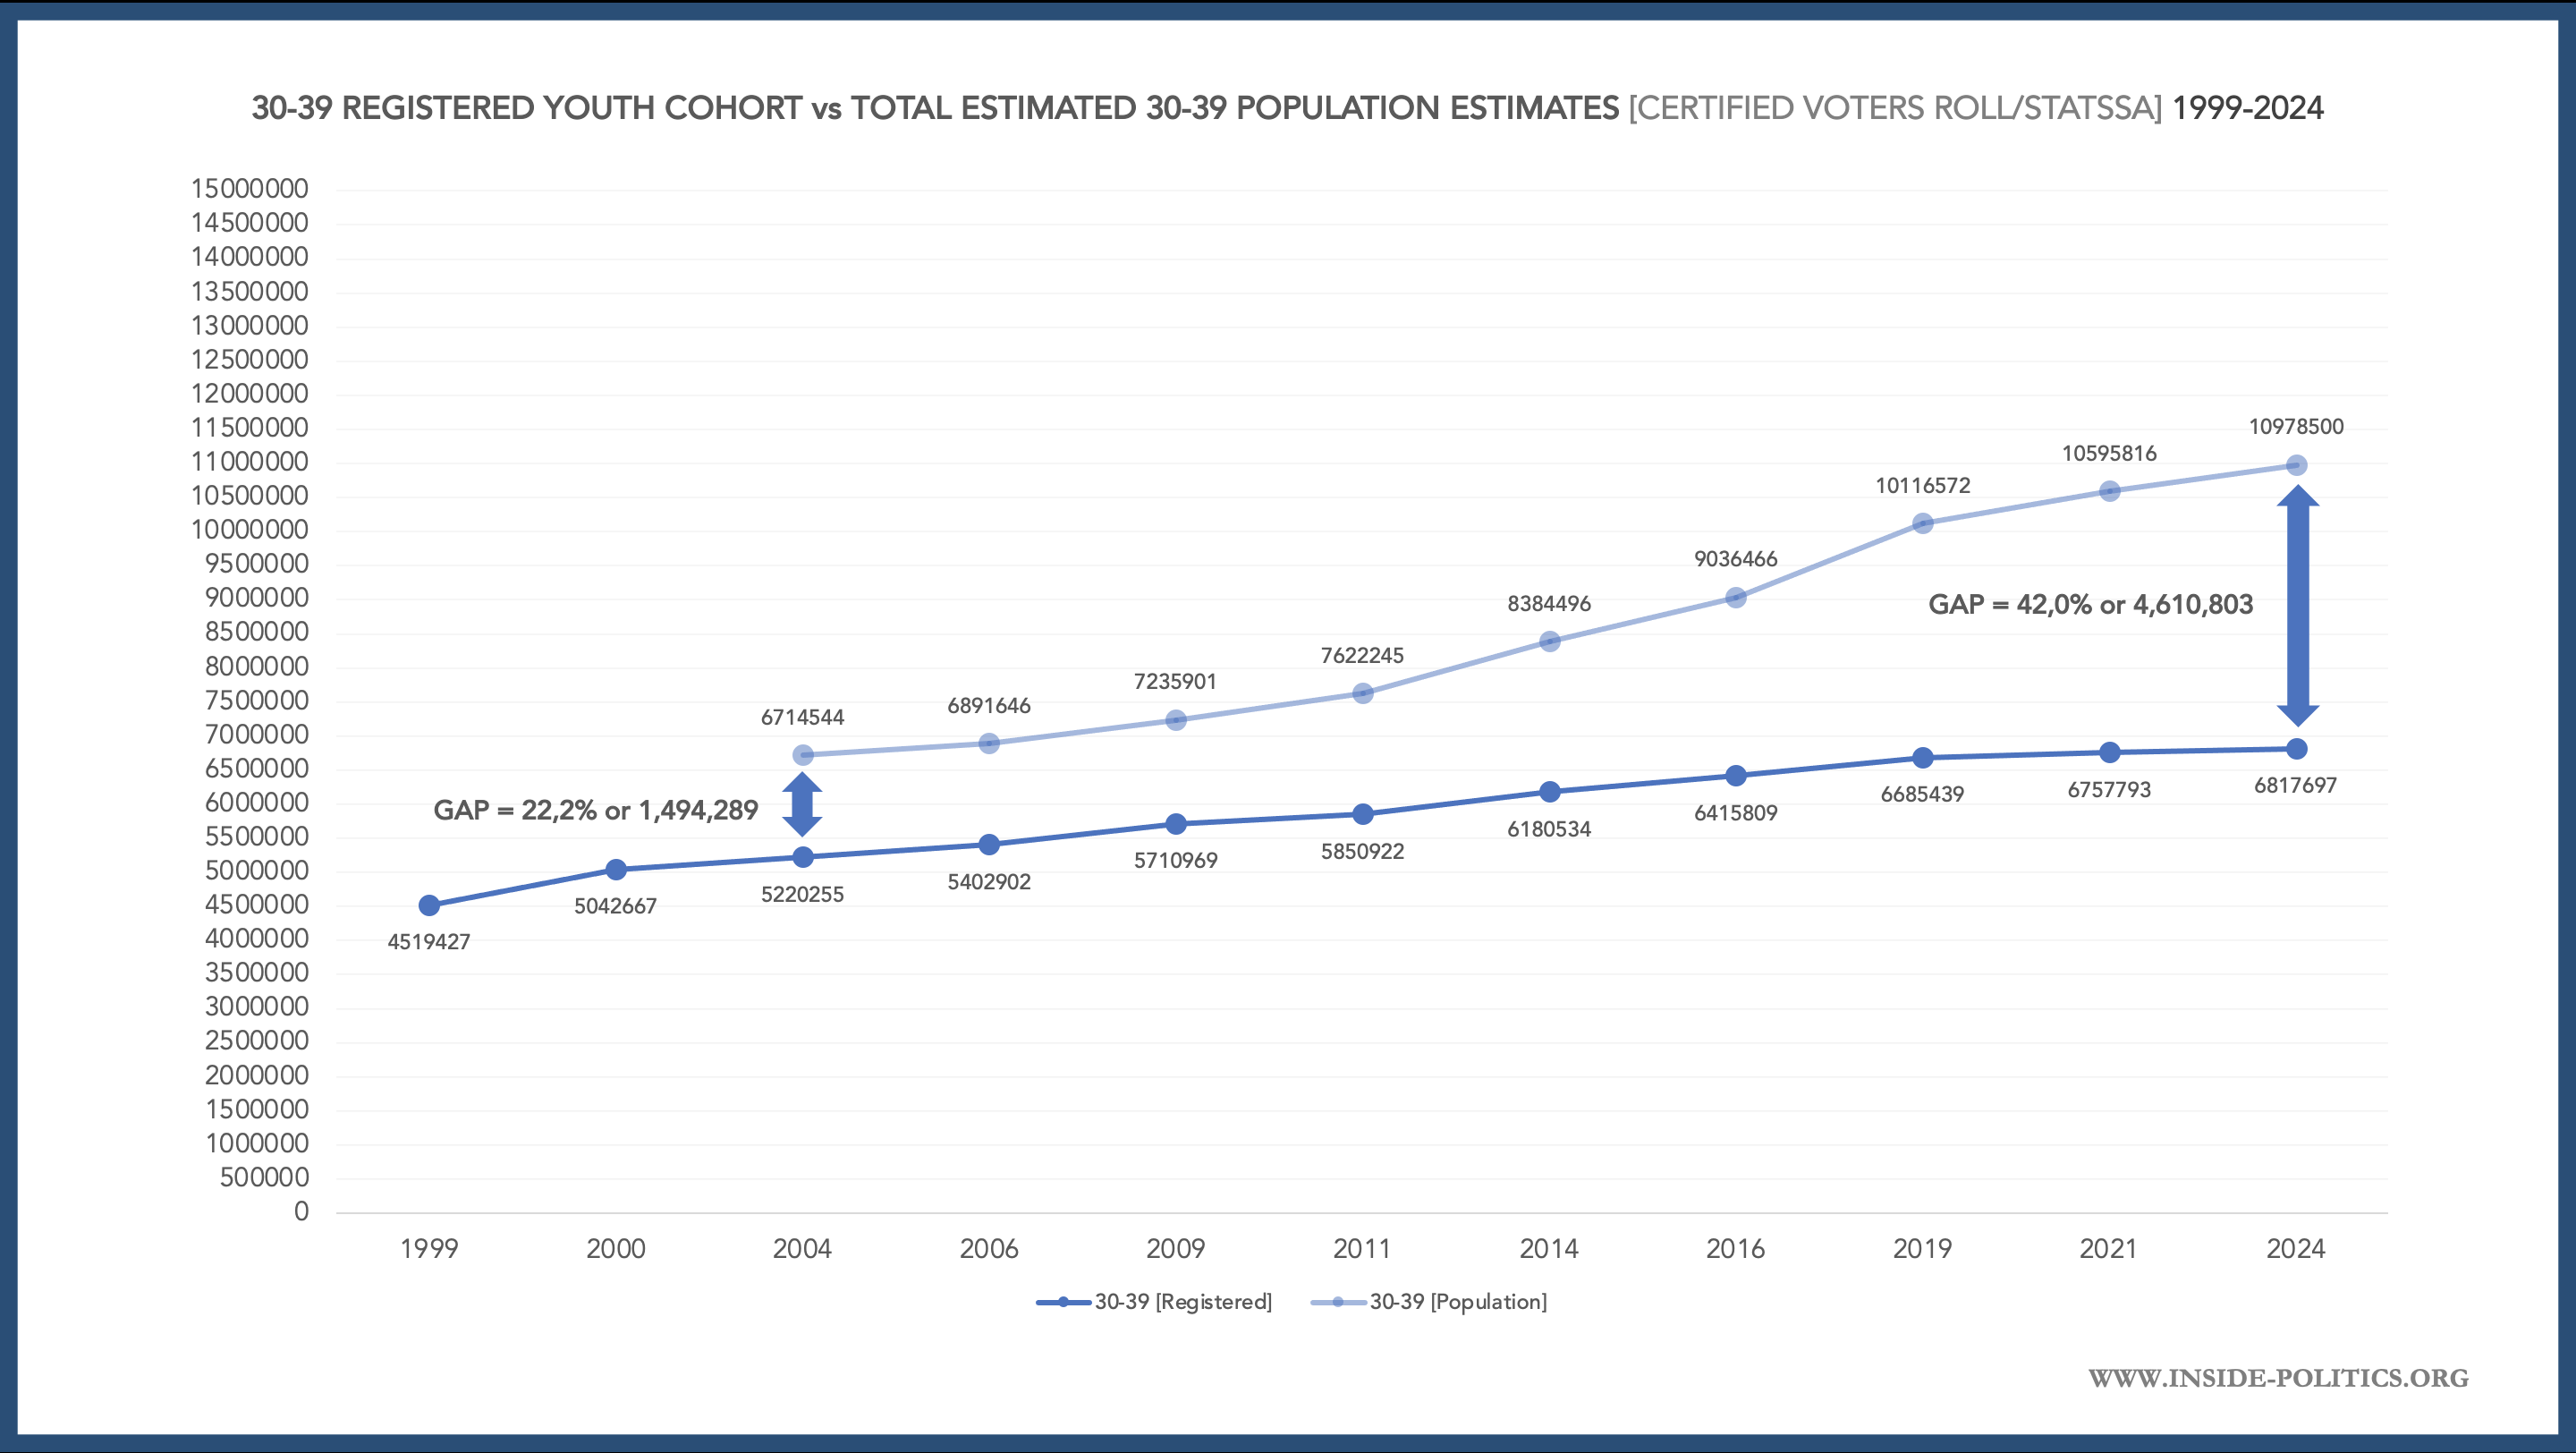
As of 2024, the 18-19 registered cohort is stable (after a period of decline), at around 29% of the total 18-19 population (the gap has remained stable at around 71%). There is a systematic gap developing for the 20-29 cohort – whereas in 2004 63% of the total 20-29 population was registered, in 2024 that has declined to 44% (the gap has grown from 38% to 56%). There is also a recent gap developing for the 30-39 cohort (over the past five elections) and a decline from 78% in 2004 to 62% in 2024 (the gap has grown from 22% to 42%).
The declines aside, it is the three 2024 percentages that are important here: 29% of the 18-19 population is registered, 43,9% of the 20-29 and 62,1% of the 30-39. That is strange too. If “the youth” all suffer disillusionment, how is it they are registered at different rates? And, given that we have seen the 20-29 cohort is driving the decline, why is it not more disillusioned than the 18-19 cohort, which register at a lower rate?
The final variable is turnout. The graph below shows the different turnout rates, for the different youth cohorts, for each election since 2006.
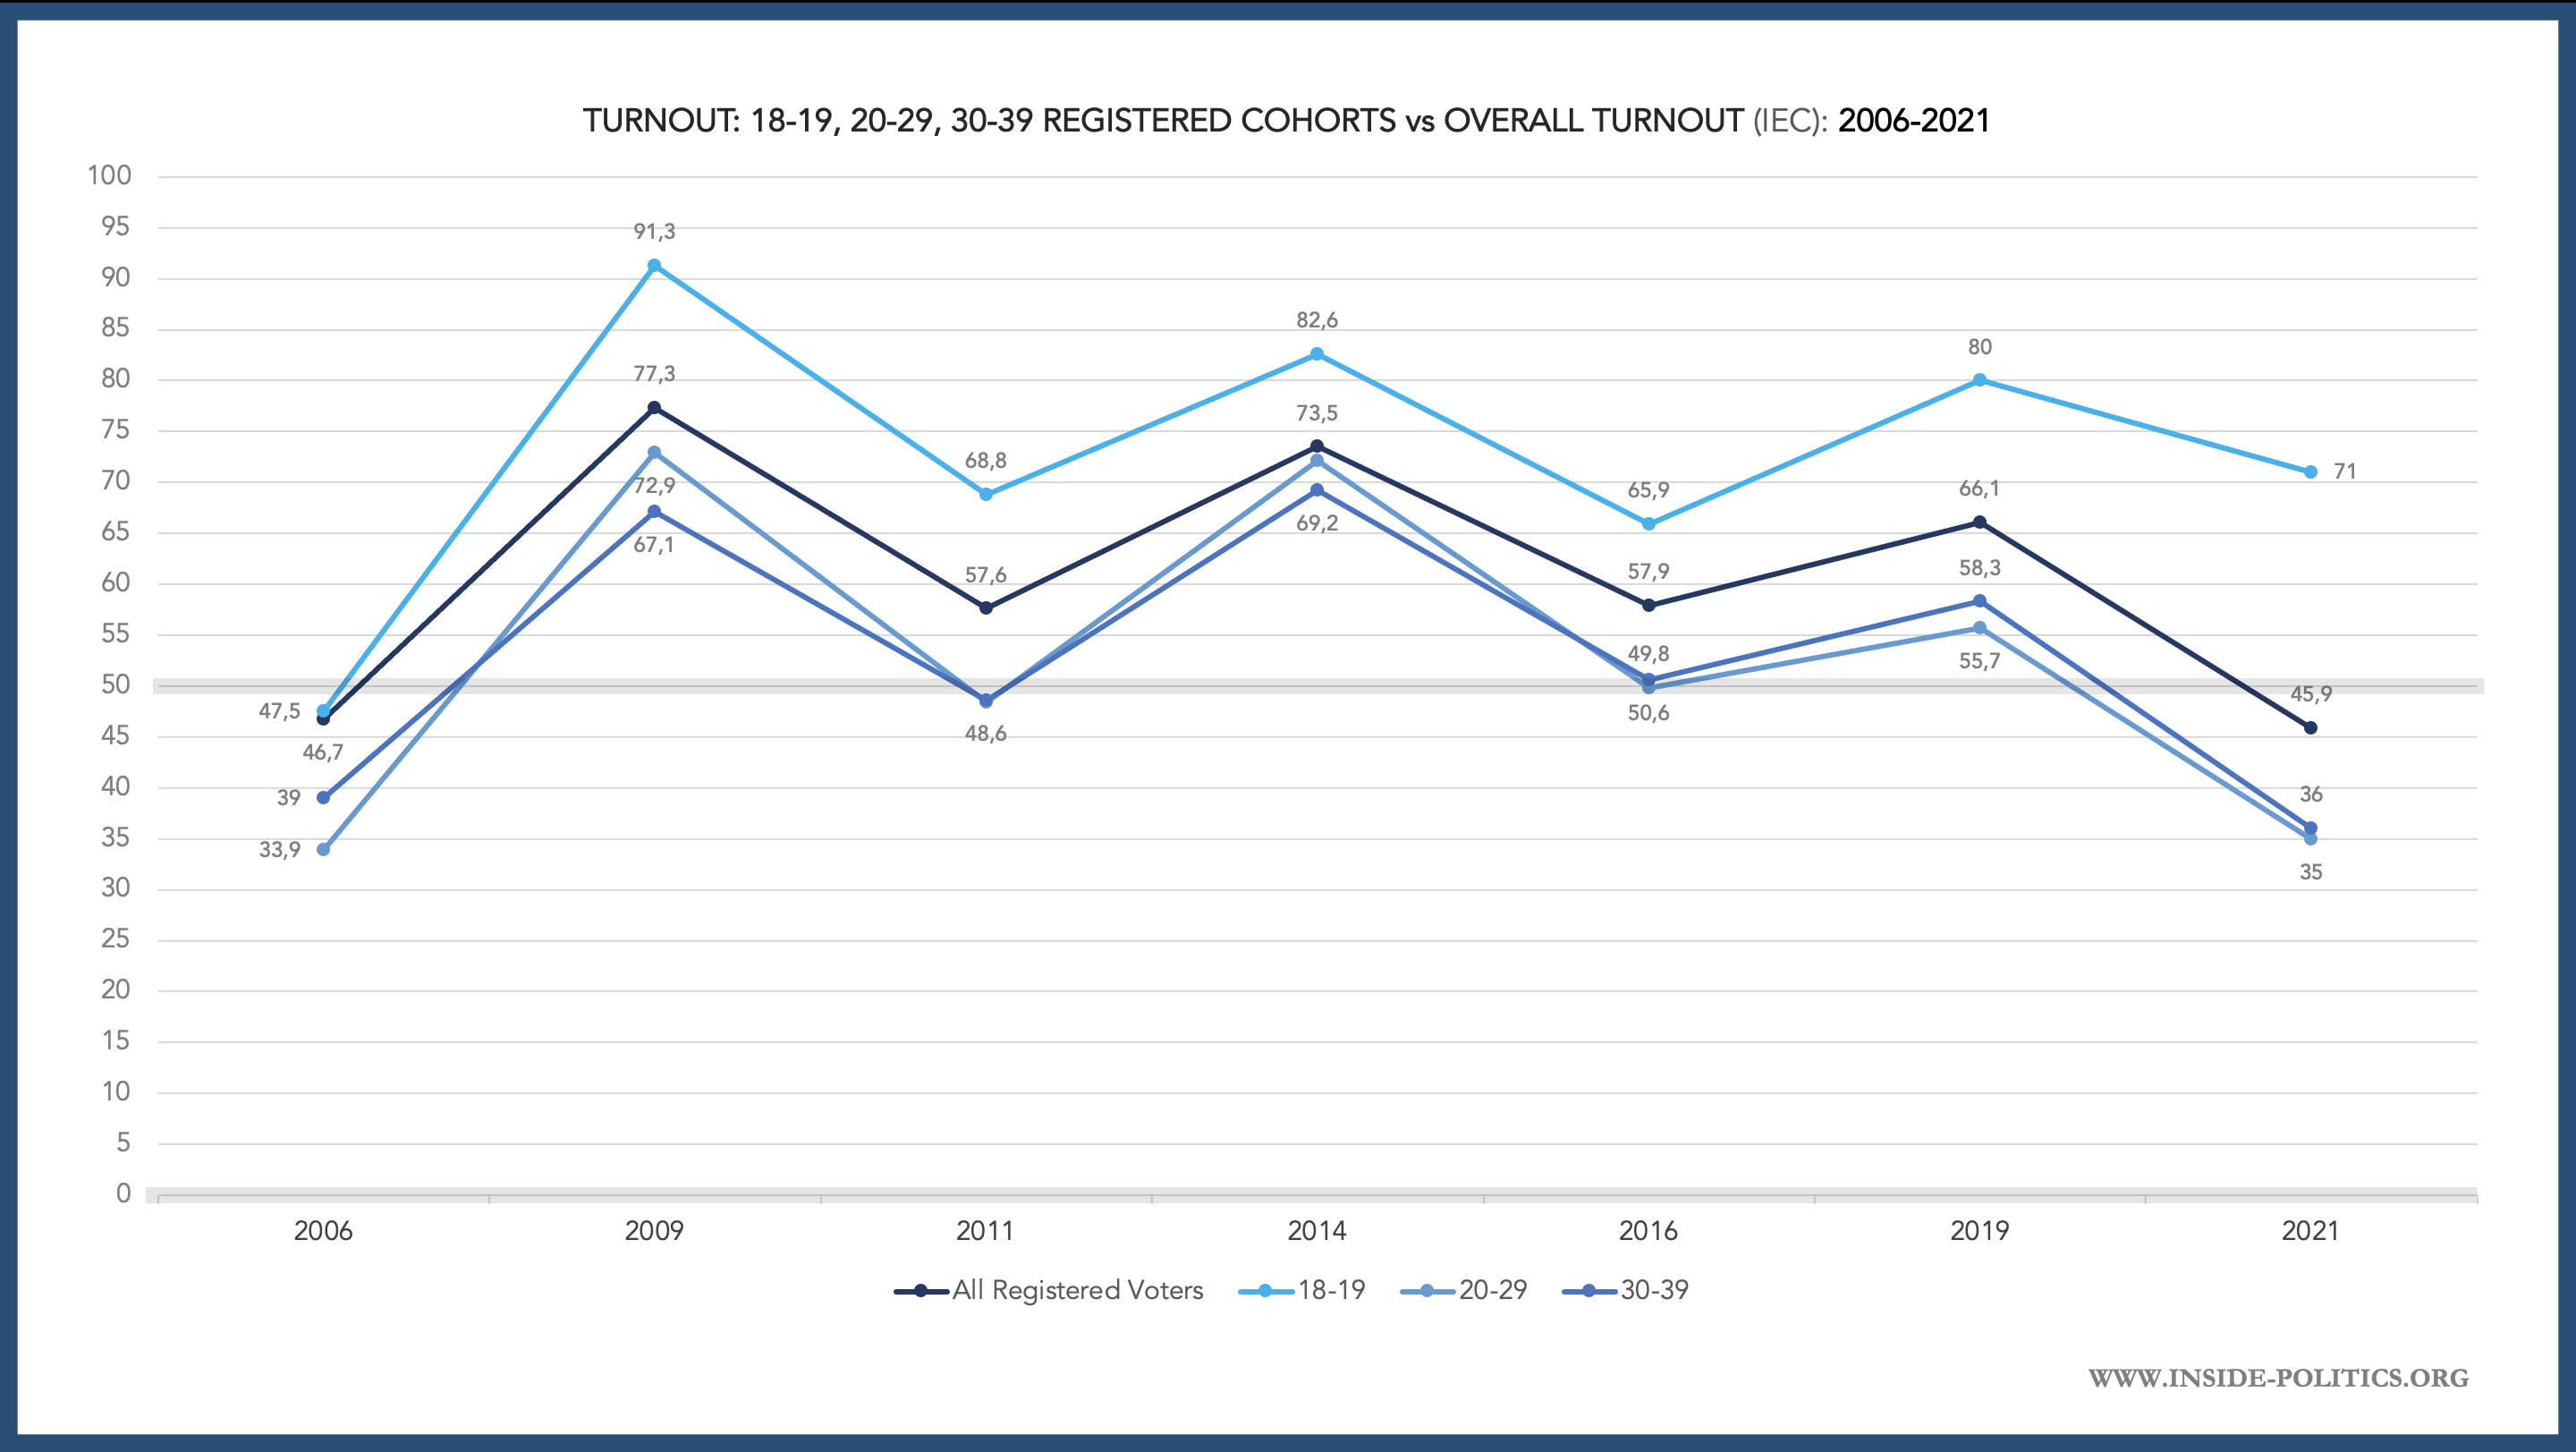
Although the 18-19 cohort is the smallest, and comprises the lowest general population registration rate, it is by far the most enthusiastic. 90%-80% turnout in the last three national elections. Even 71% in the Covid-affected 2021 local government election. All way above the general average.
Most likely is that the prospect of voting for the first time drives enthusiasm. But, once you have done that, enthusiasm drops off. That speaks more to apathy than it does disillusionment. After all, using the logic of the disillusionment thesis, the 18-19 cohort would be most out of touch with political parties and least represented by them. Yet they vote at the highest rate of the three.
Both the older cohorts, 20-29 and 30-39 fall below the average. Another clear sign that the youth is not homogenous. And another odd finding for the disillusionment thesis, which would have it all youth uniformly effected.
4. The youth and “disillusionment”
Having identified some of the contradictions with the disillusionment narrative, let us now look what the data says about the youth proclivity for politics in general terms.
First, it is important to understand that all South Africans are increasingly disillusioned. The graph below tracks three indicators – the turnout level in each election since 2004 (blue), and then the responses to two standard questions from the IEC’s 2021 Election Indicators Report: the percentage of people who believe the country is moving in the right direction (orange) and the percentage of people who are satisfied with democracy (green).
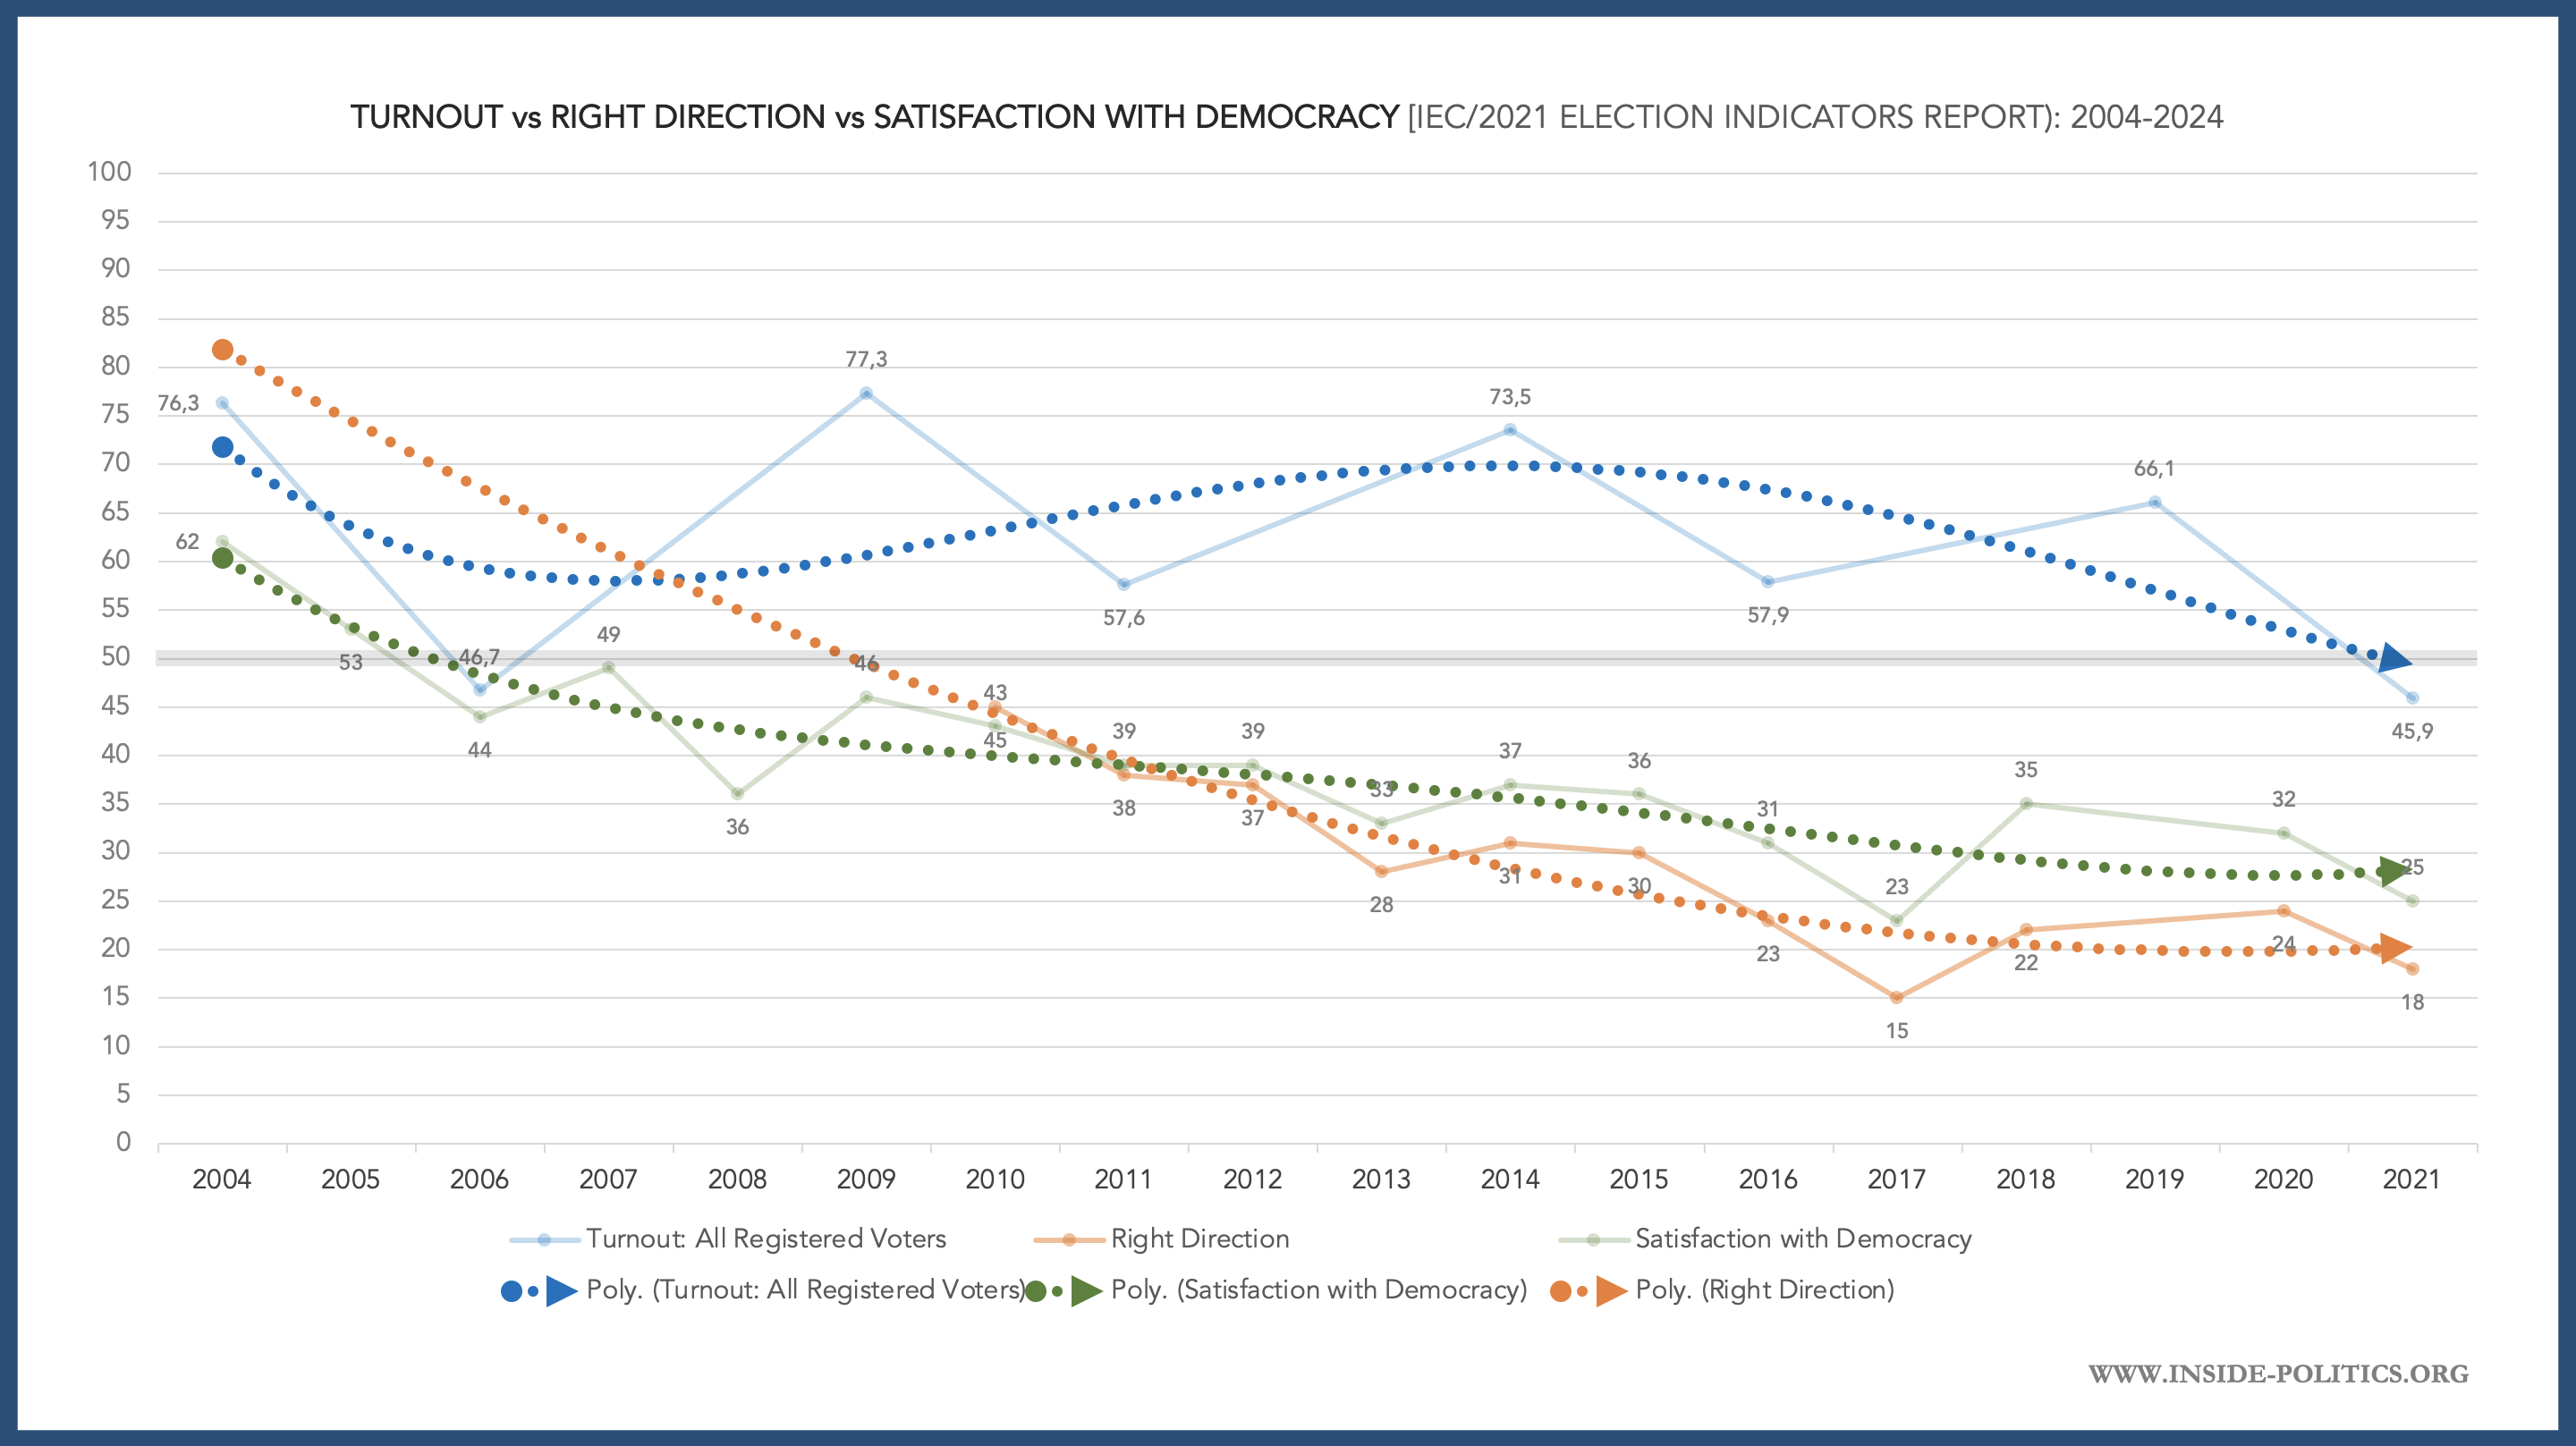
All three are headed downwards over time, and that makes sense: less and less people are satisfied with democracy, less and less people believe the country is moving in the right direction and so less and less people turn out to vote on Election Day. There is a general decline in the country’s outlook, that effects all age cohorts. In turn, this is also why the number of registered voters, as a percentage of the total Voting Age Population (VAP) is dropping too.
So, on one level, it is redundant to say the youth are disillusioned. Everyone is. The question is: how disillusioned are they? And are those (presumably extraordinarily high) levels of disillusionment responsible for their behaviour (especially among the 20-29 cohort)?
StatsSA’s Governance, Public Safety, and Justice Survey (2019/2020) has an indicator for trust in public institutions, and while it does not contain a breakdown by age, the NYDA’s 2022 Status of Youth Report (which uses the same StatsSA survey) does. So we can merge the two, as per the graph below, which shows the levels of trust per institution by age cohort.
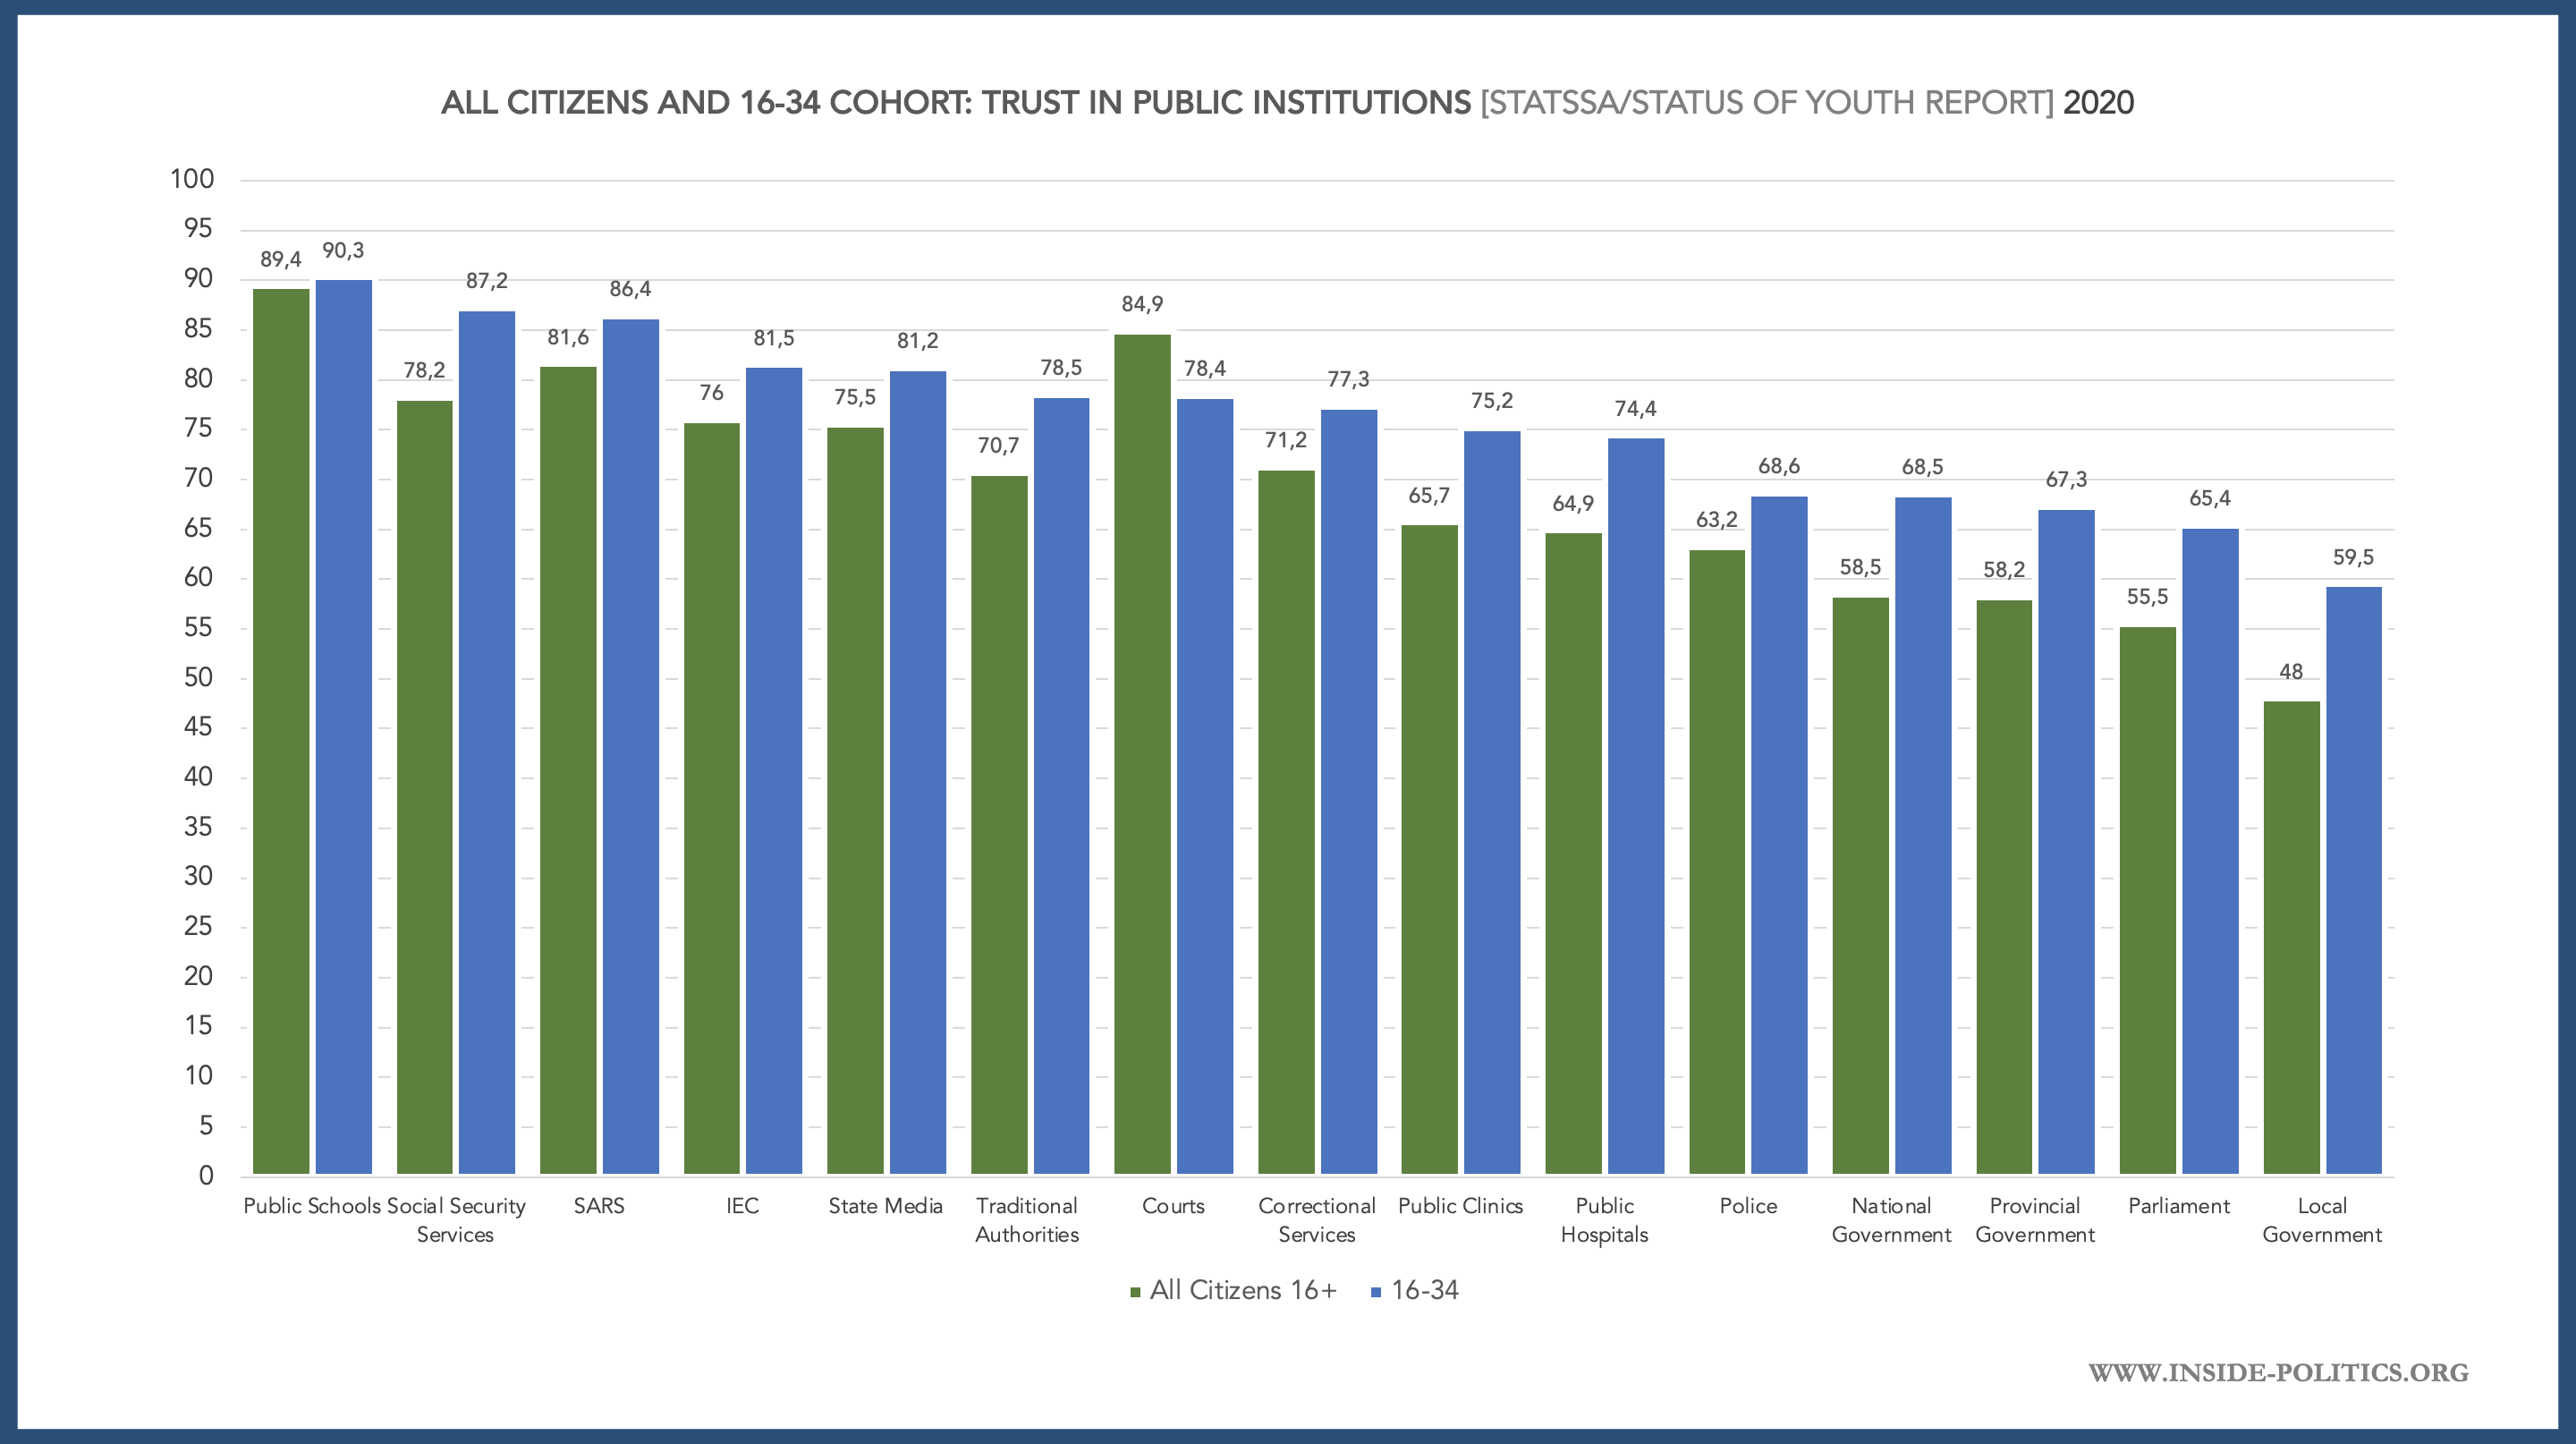
In almost every case, the youth (ages 16 to 34 in this survey) have more trust in public institutions than the total population (everyone 16+). This is better illustrated by looking at the trend-lines, as per the graph below.
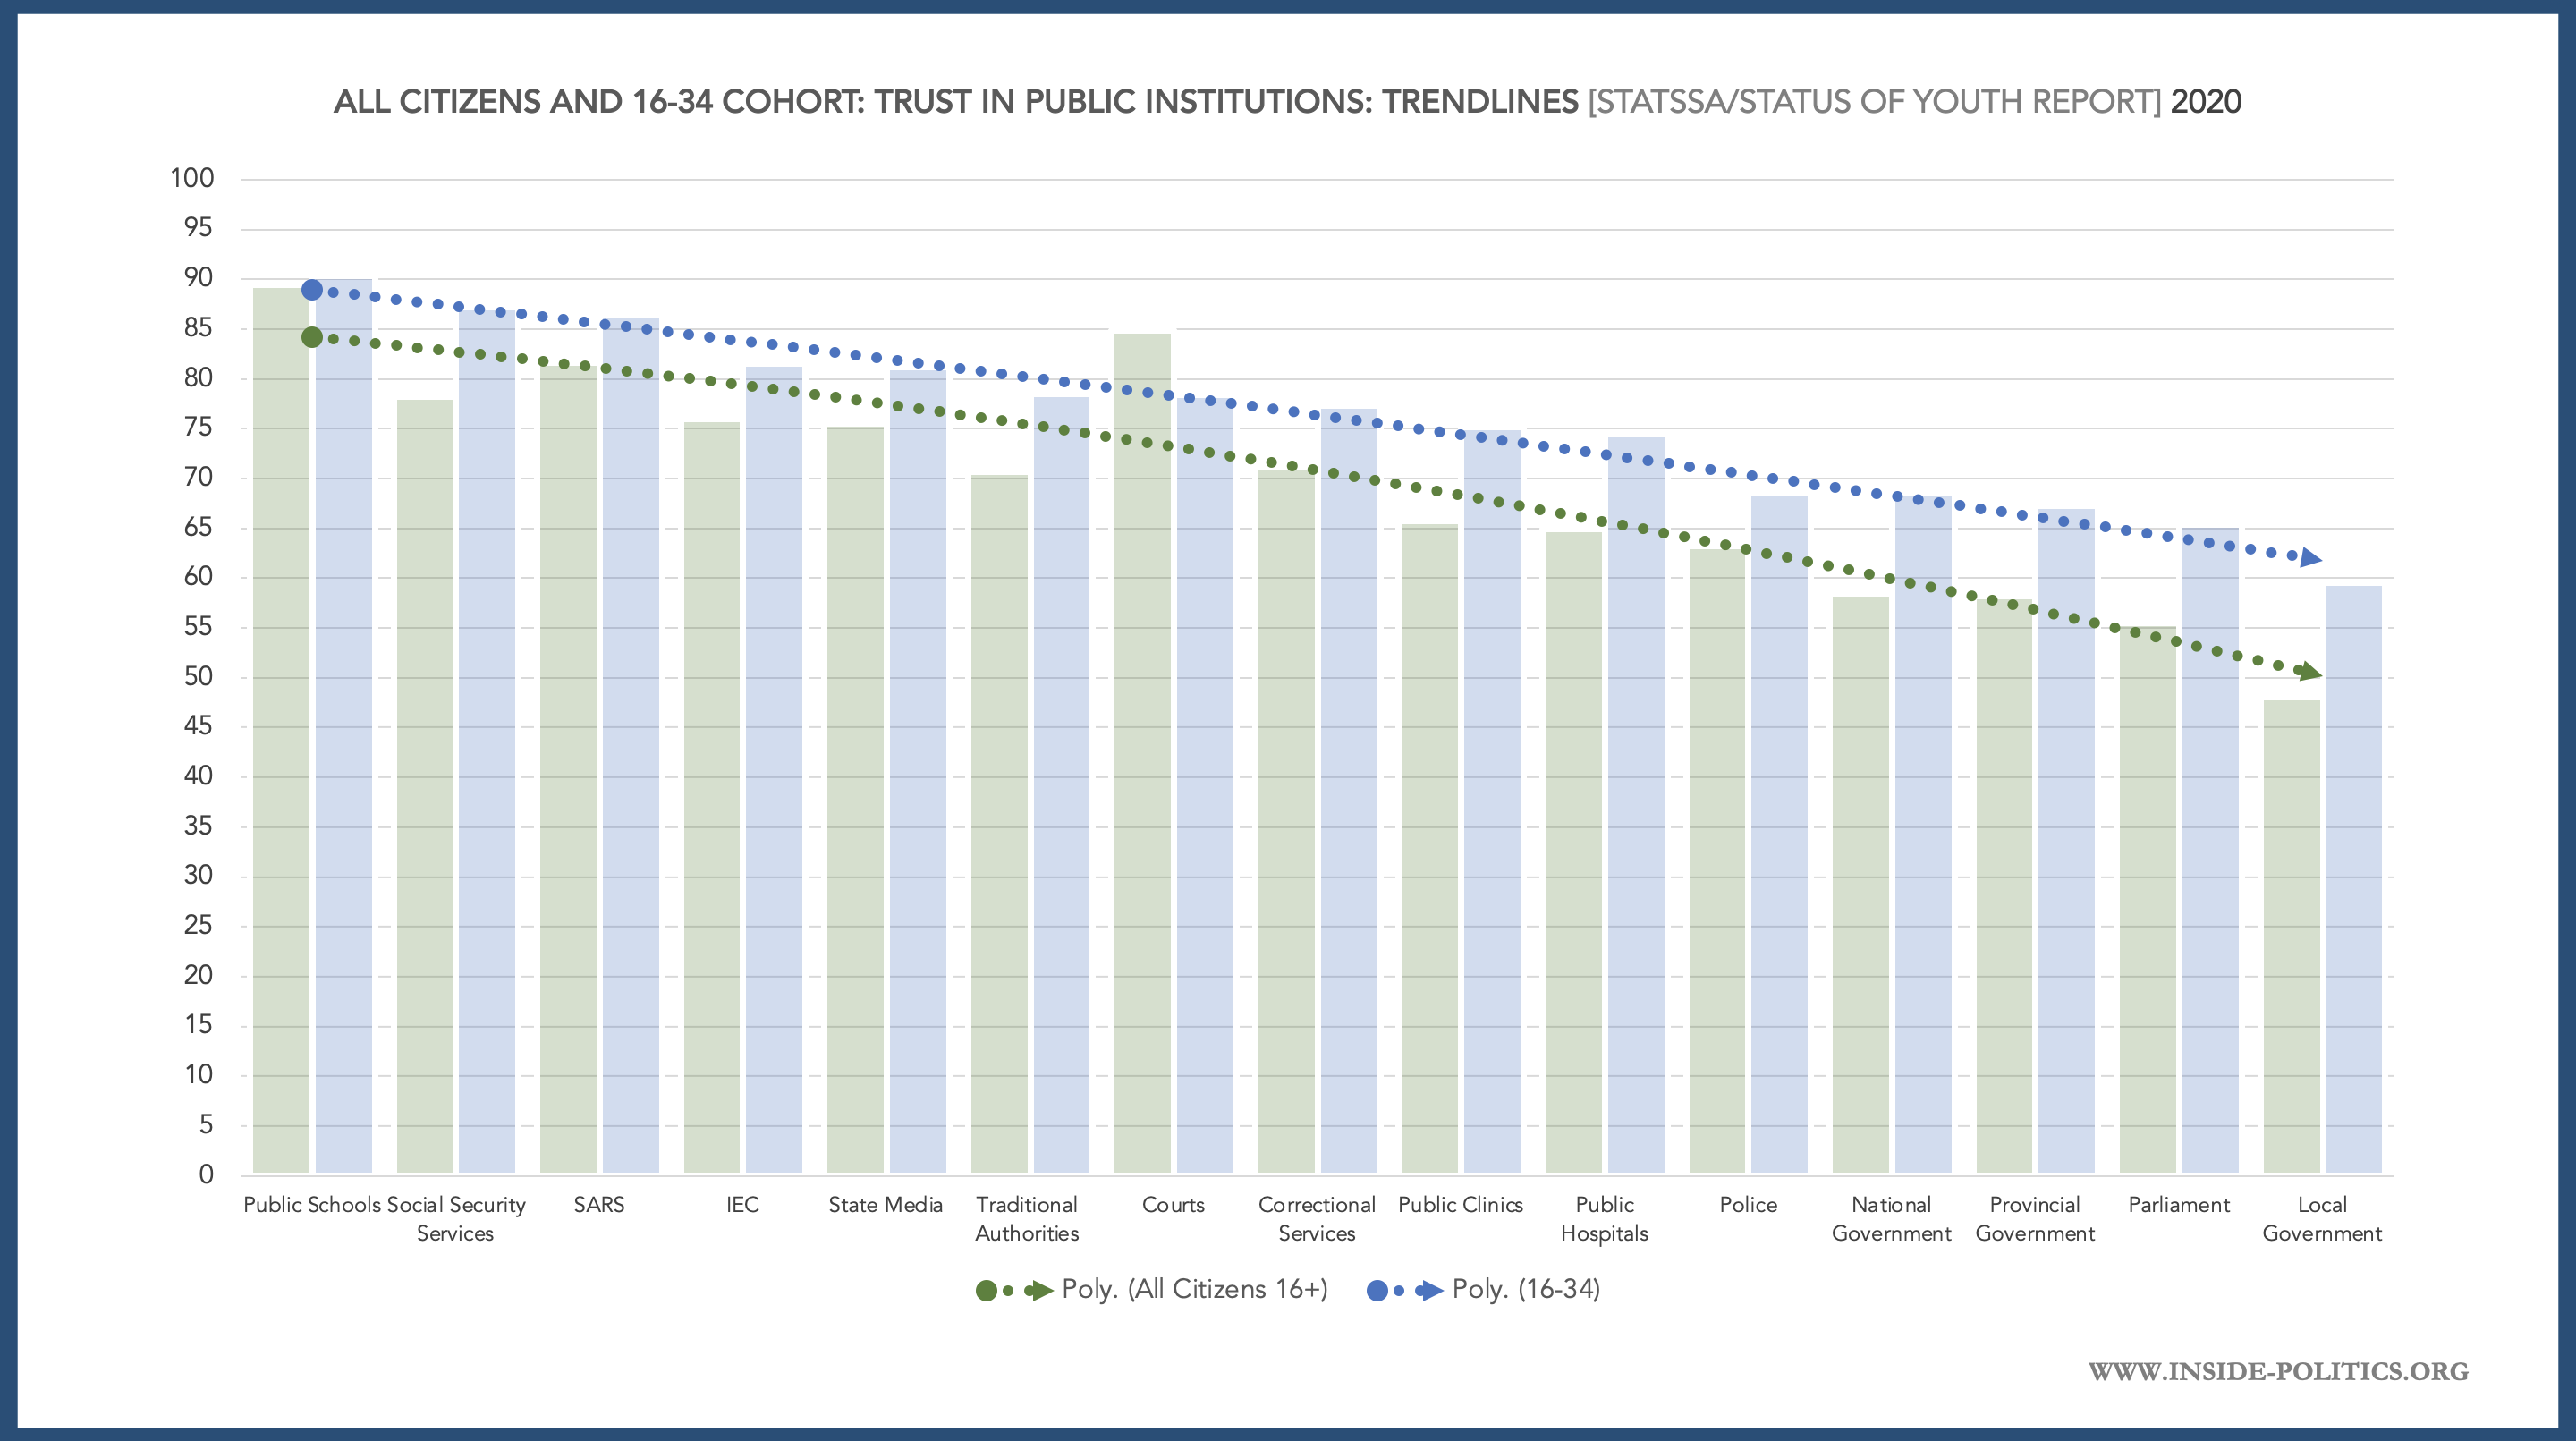
Almost without exception, “the youth” line stays significantly above the “all citizens” line. Strange, that the supposedly disproportionately “disillusioned” youth would have more trust in public institutions than the total (and given the total included the youth, remove them and you can be sure the gap would be bigger still).
And public institutions are at the heart of the disillusionment narrative. Parliament has failed. The youth are turning away “from the system”. Institutions are plagued by corruption, we are told, which eats away at their credibility and youth’s faith in them. Yet, compared to older cohorts, who register at a higher rate, “the youth” appears to have more faith in them.
Afrobarometer has run regular polls in South Africa since 1999, consistently testing core democratic indicators. They have an incredibly helpful website, which allows you to use and cross-tabulate all their data, as you wish. The graph below looks at the question, “How satisfied are you with the way democracy works in South Africa?” (similar to the IEC’s question). So, if we break it down by age, we can get a better insight into this indicator.
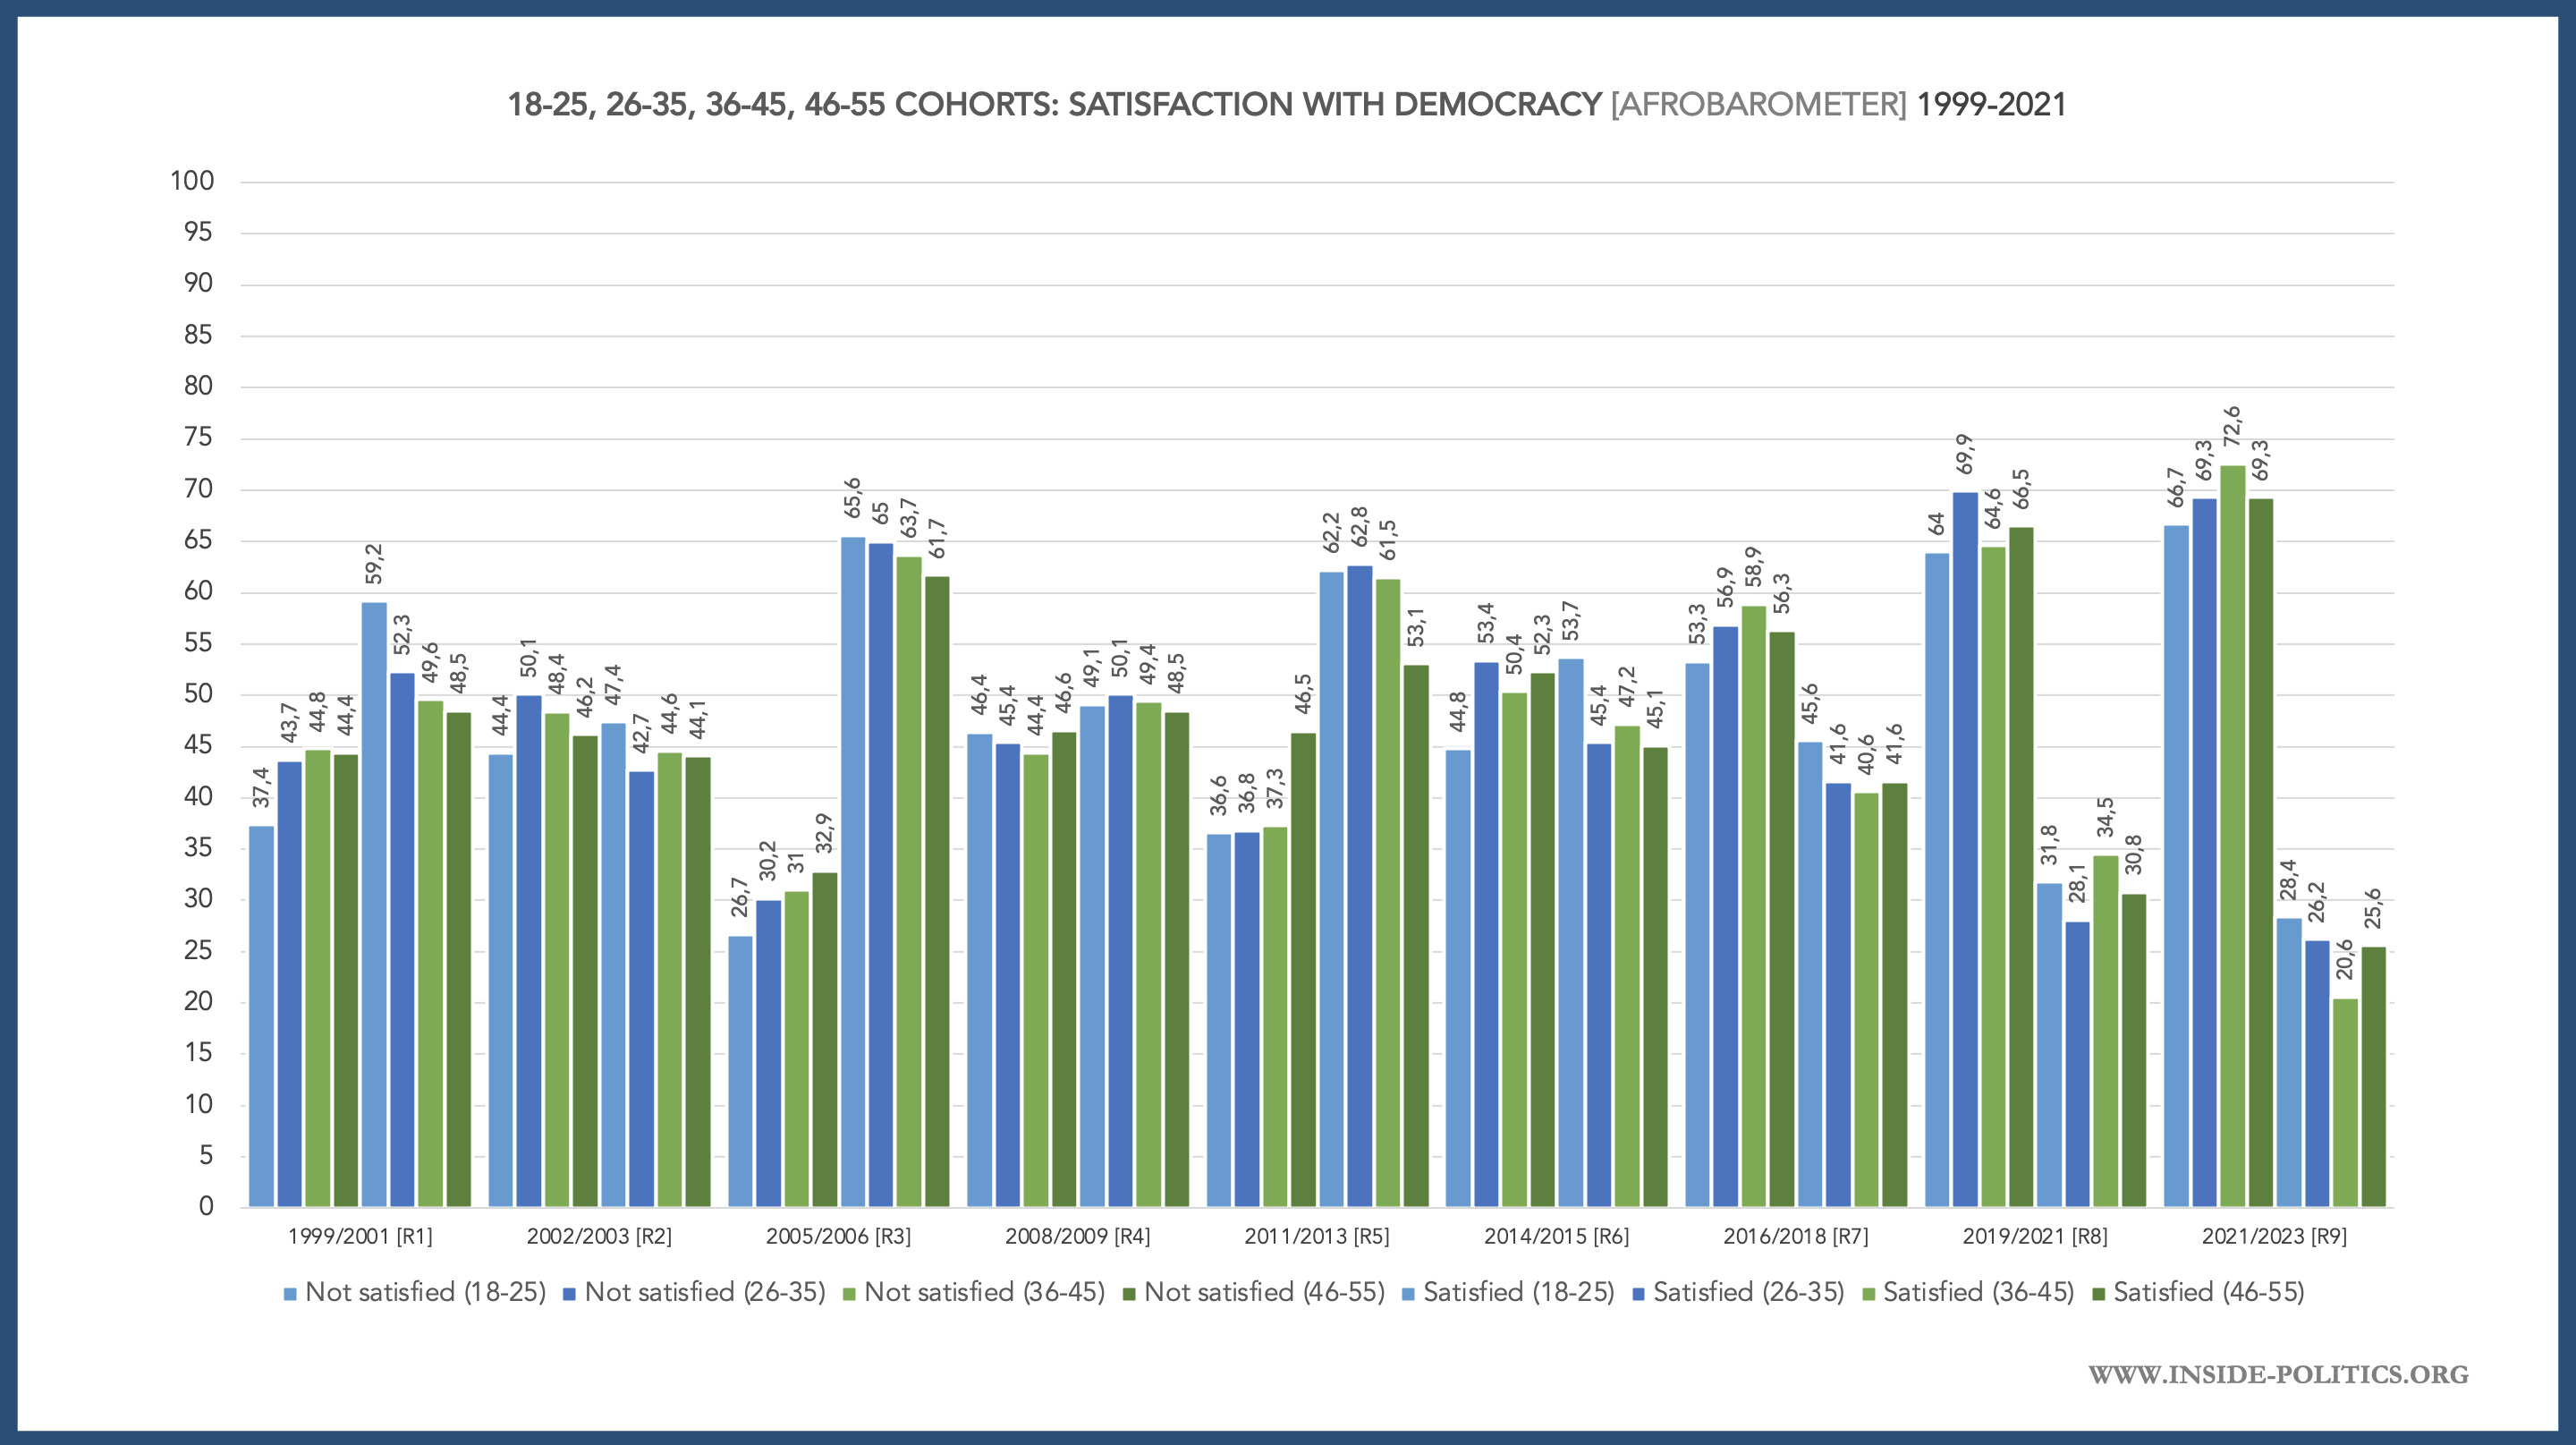
That graph appears very complicated. So let’s just look at 18-25 years olds (Afrobarometer’s lowest age cohort) and compare it to the 46-55 cohort, when it comes to dissatisfaction with democracy. Do that, and you get the graph below:
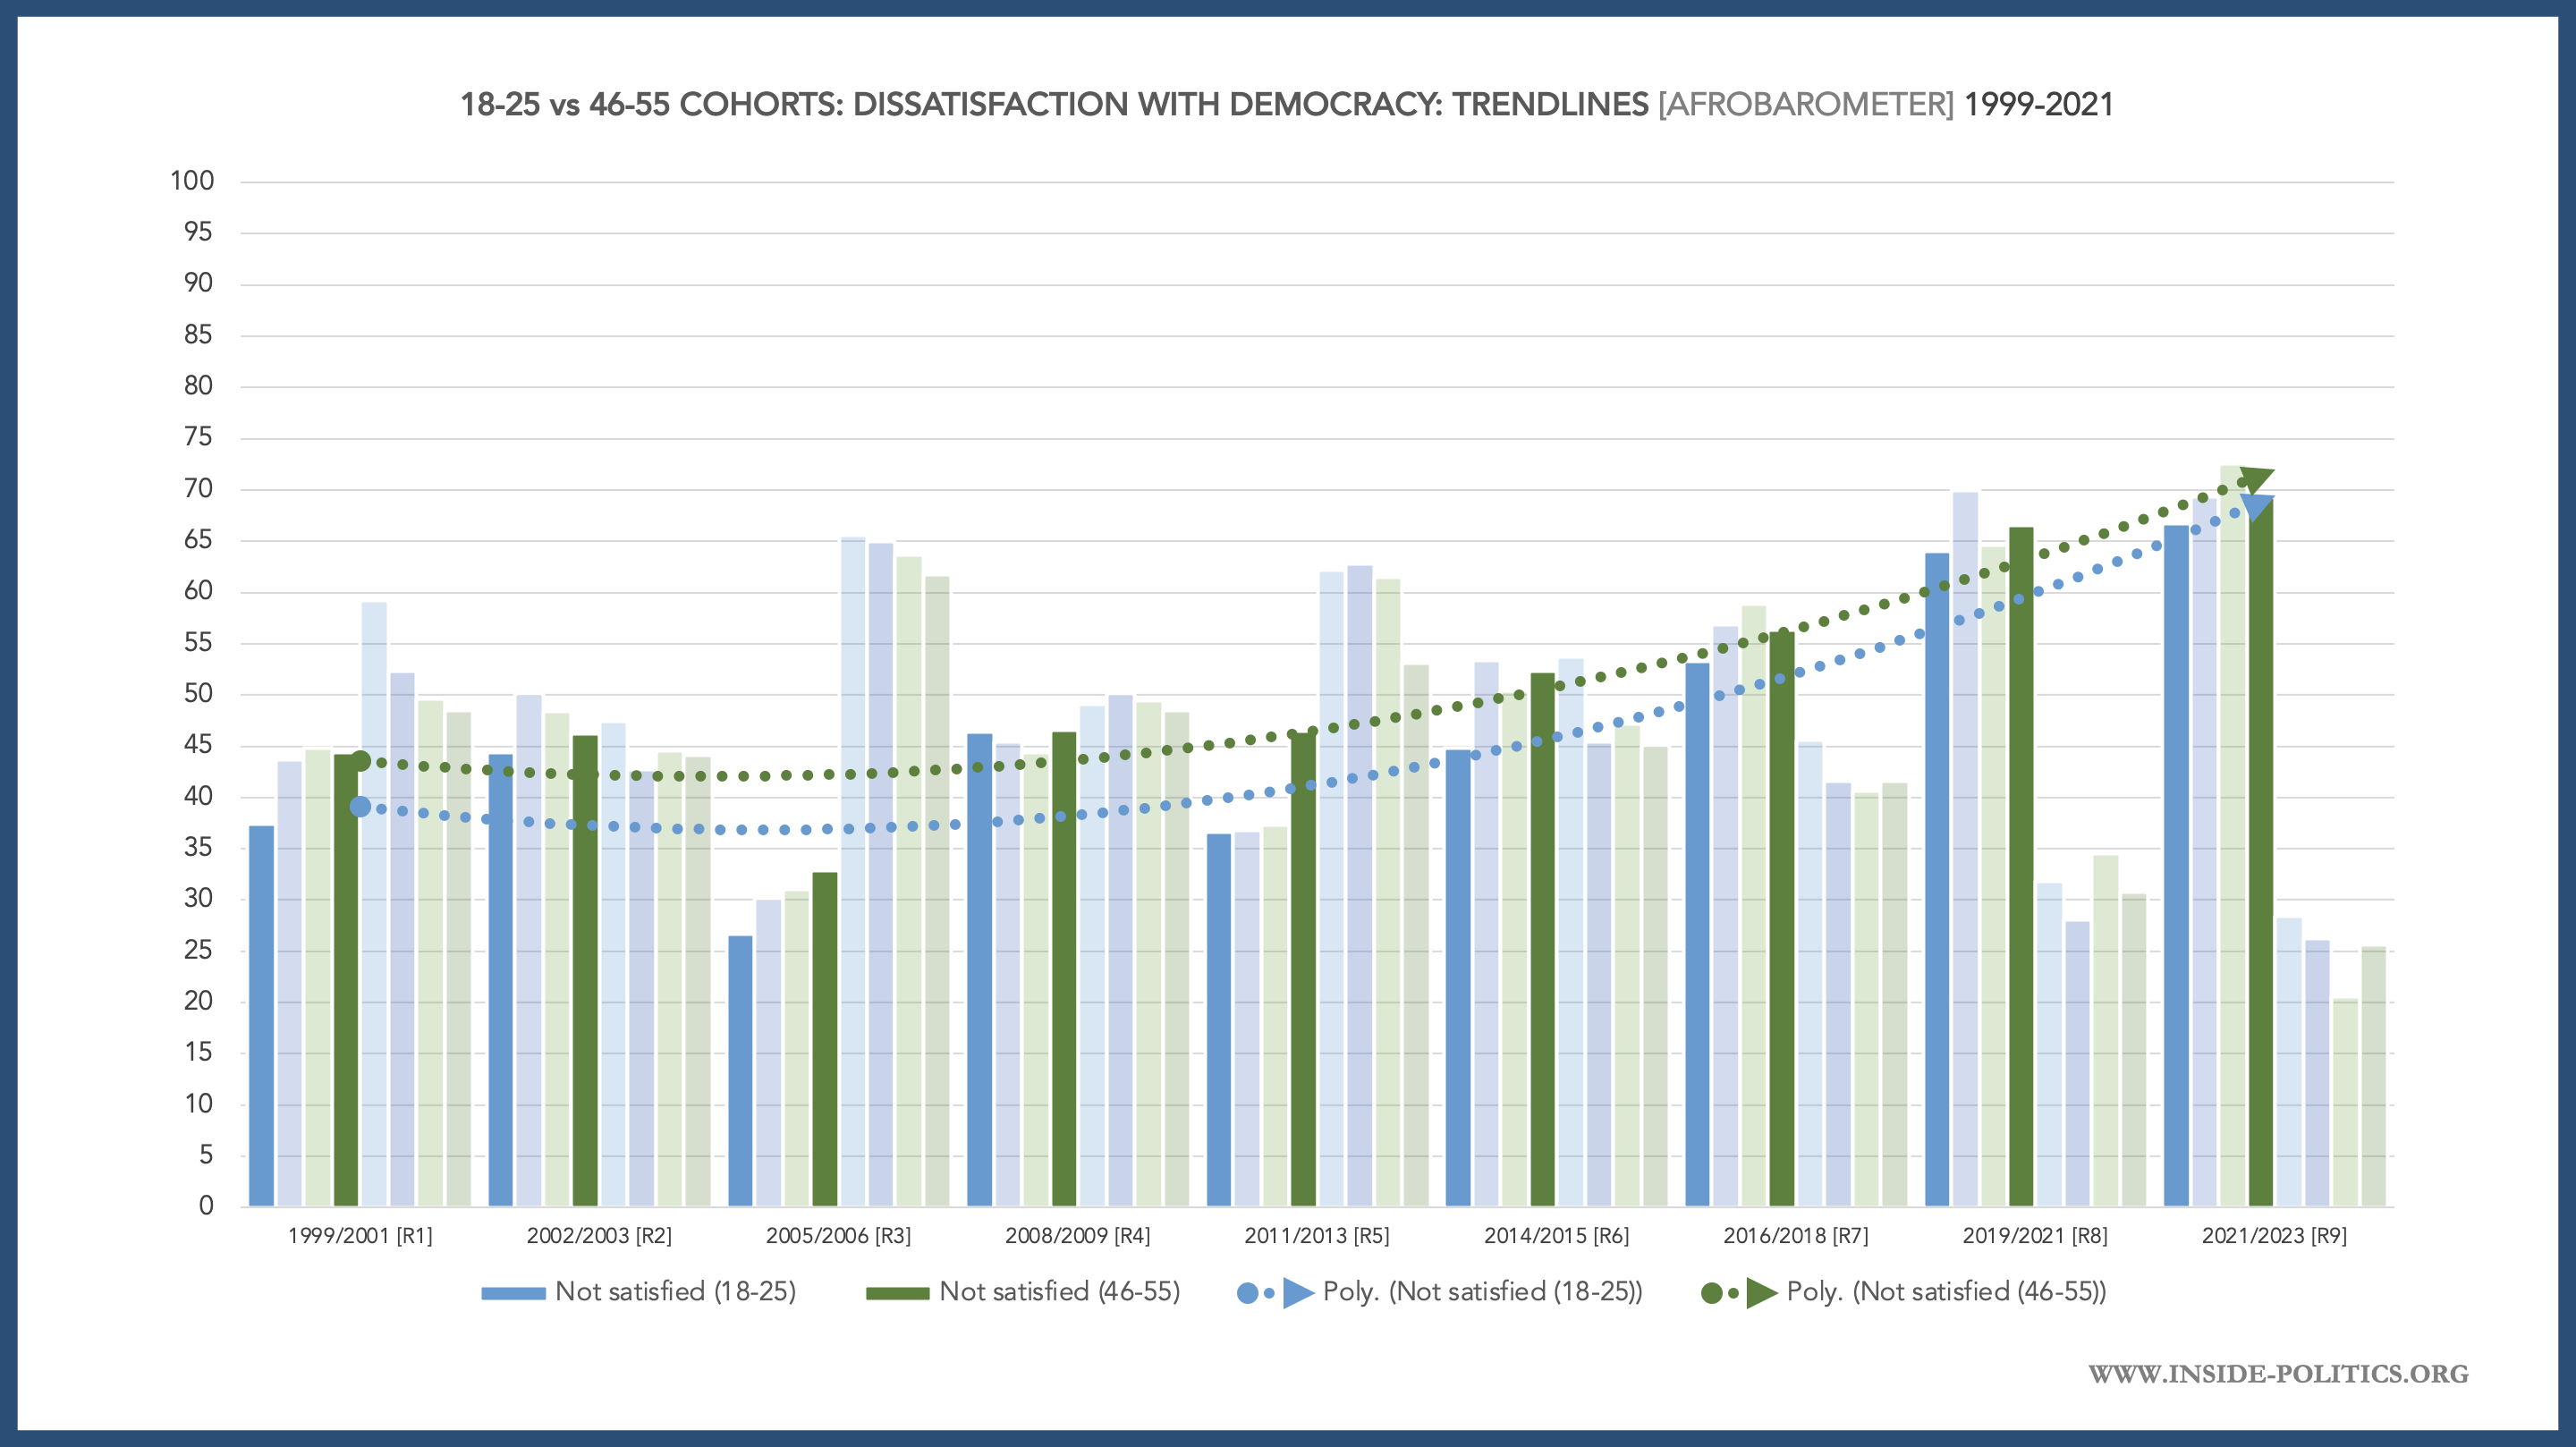
Consistently and over time you see that it is the older cohort (green) that is more dissatisfied than the younger one (blue). Yes, both are becoming more dissatisfied over time – which speaks to general disillusionment – but always the older cohort to a greater degree. The same is true in the other direction, if we compare those two cohorts with regard to how satisfied they are with democracy, as per the graph below:
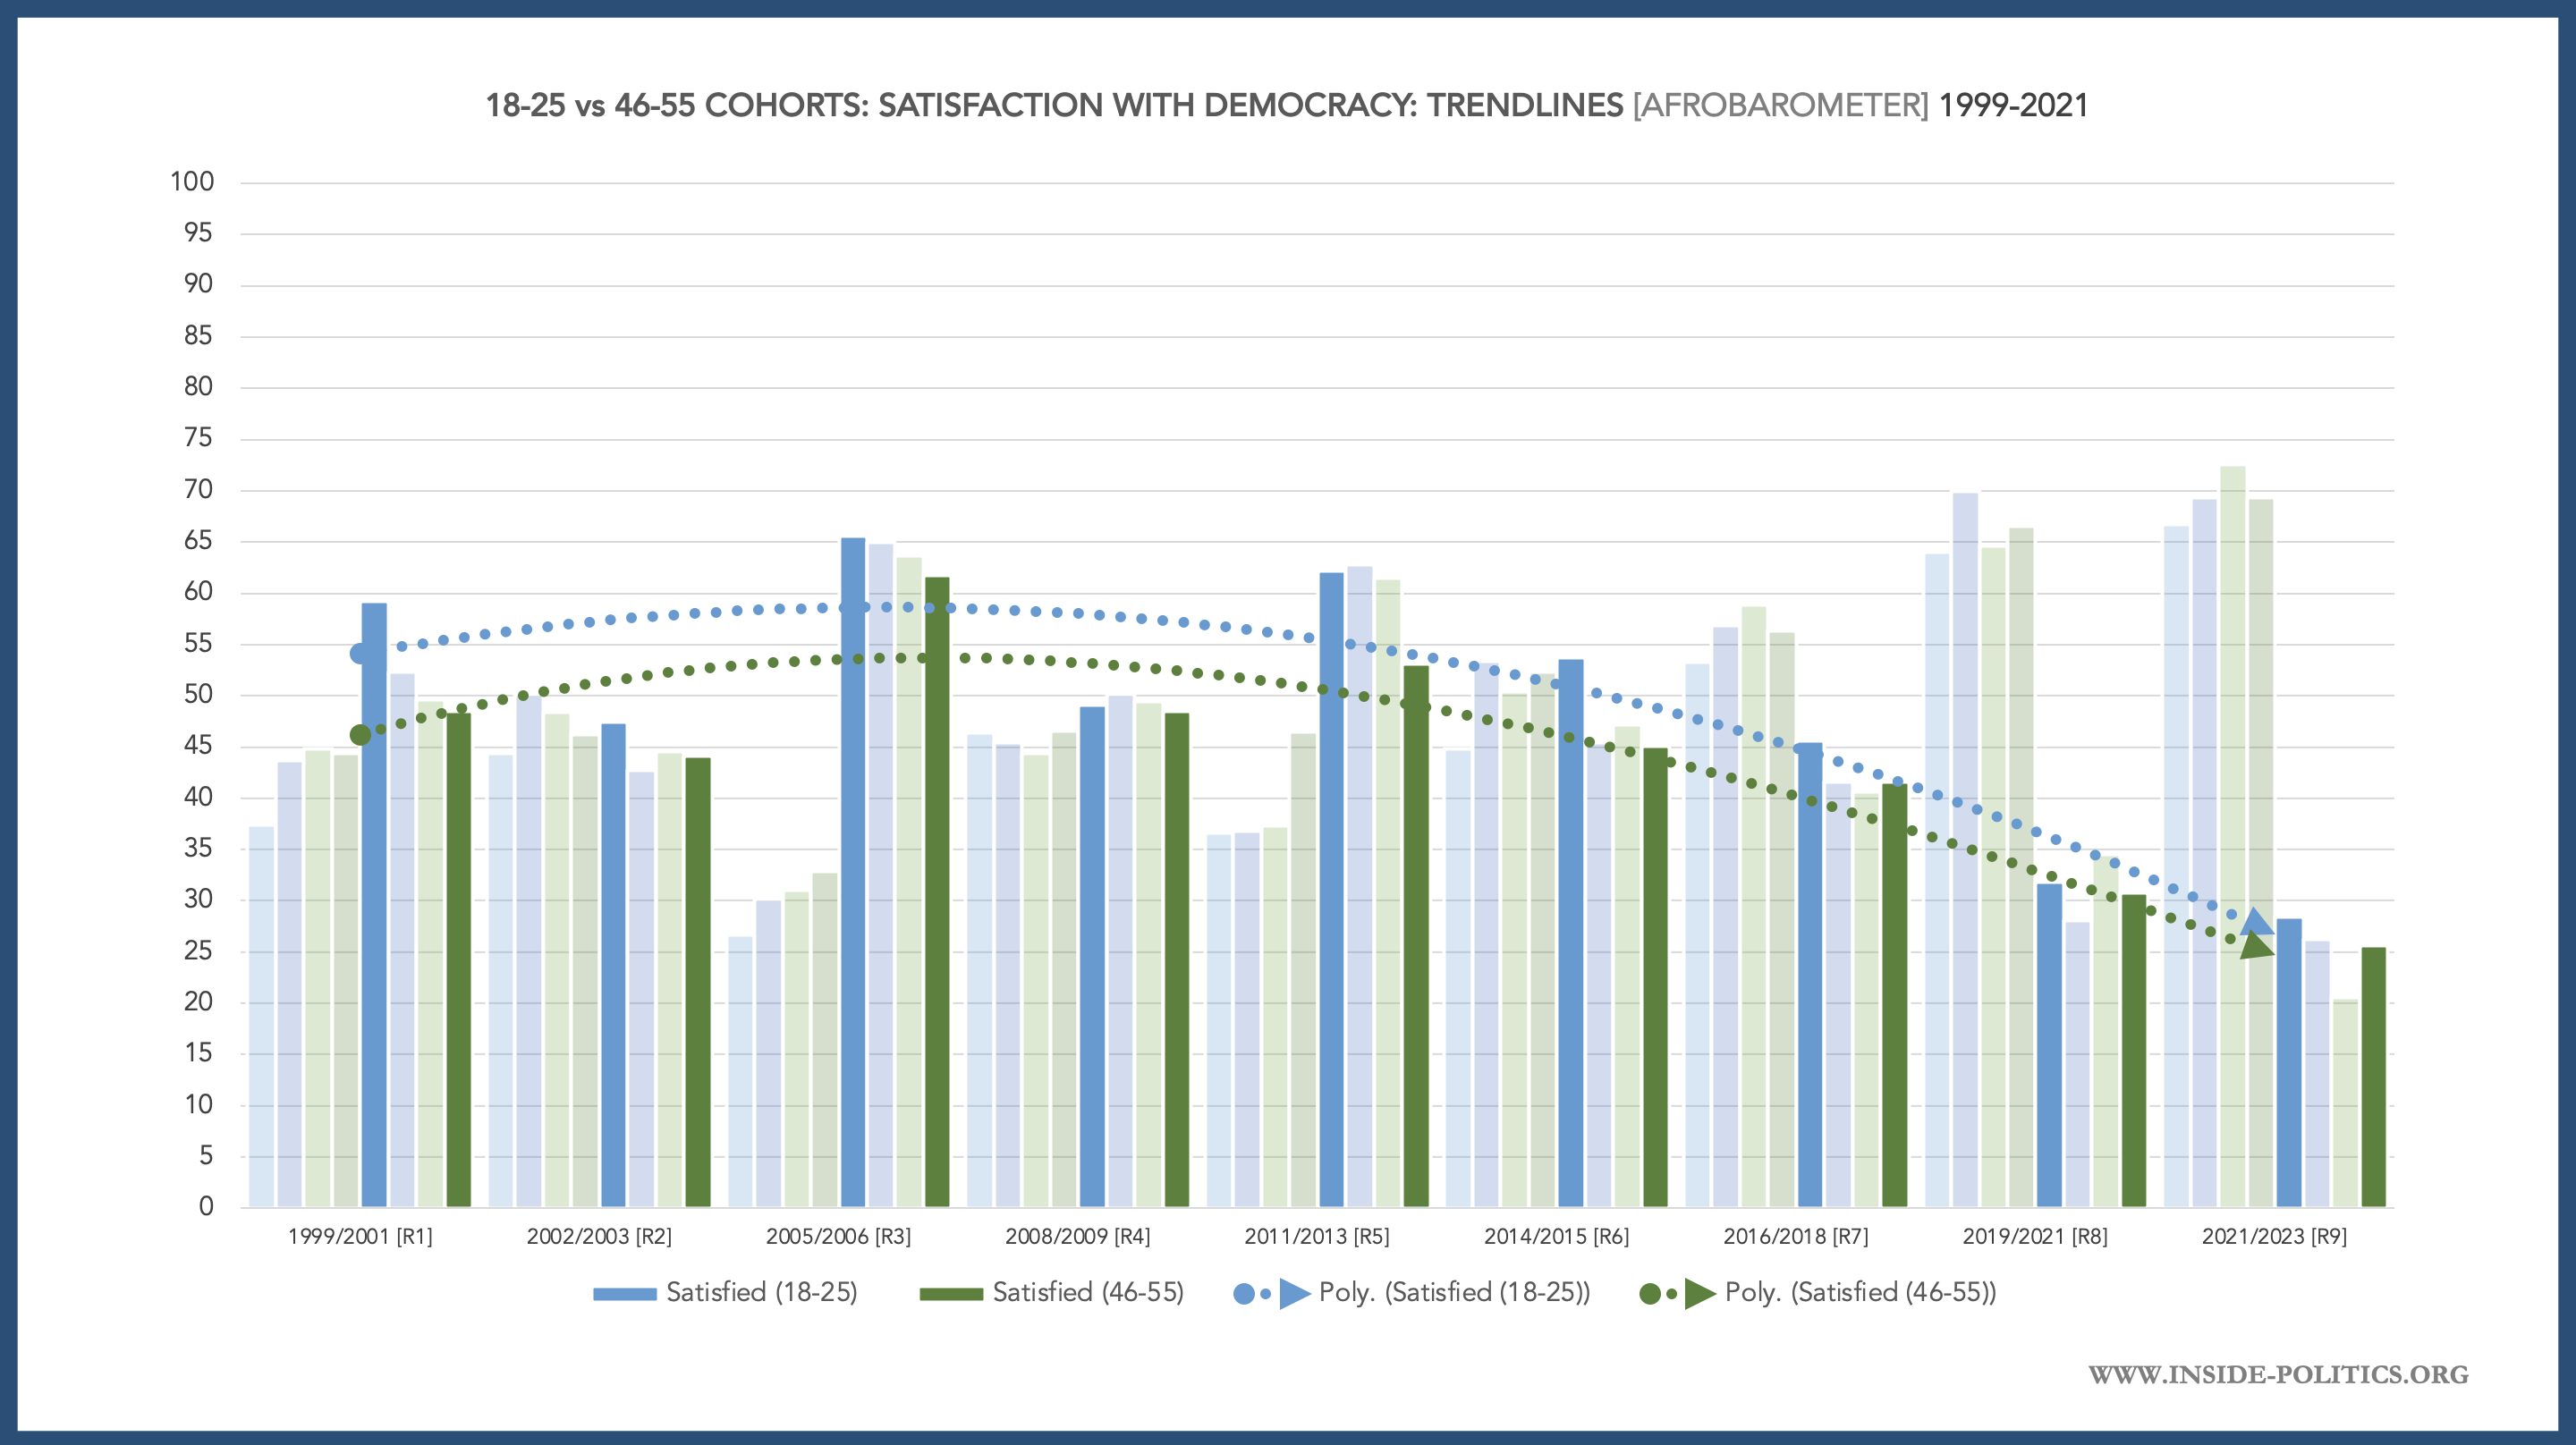
Here the youth is consistently more satisfied with democracy and, for the most part, above the green line. These findings are very difficult to reconcile with the popular youth narrative. Certainly they disprove the suggestion that the youth are especially disillusioned. Indeed, if anything, they suggest the youth are marginally less disillusioned and more optimistic than everyone else.
52% of 18-39 year olds are registered to vote, and 84% of 40-59-year-olds are registered. Why is it that, despite being more disillusioned, more 40-59-year-olds register to vote? This is another challenge to the narrative that would have it the youth are disproportionately disillusioned.
As regards the youth’s participation in politics outside of formal democracy, below are four other indicators from Afrobarometer’s 2021/2023 survey. You can track these back over time, the trends are the same.
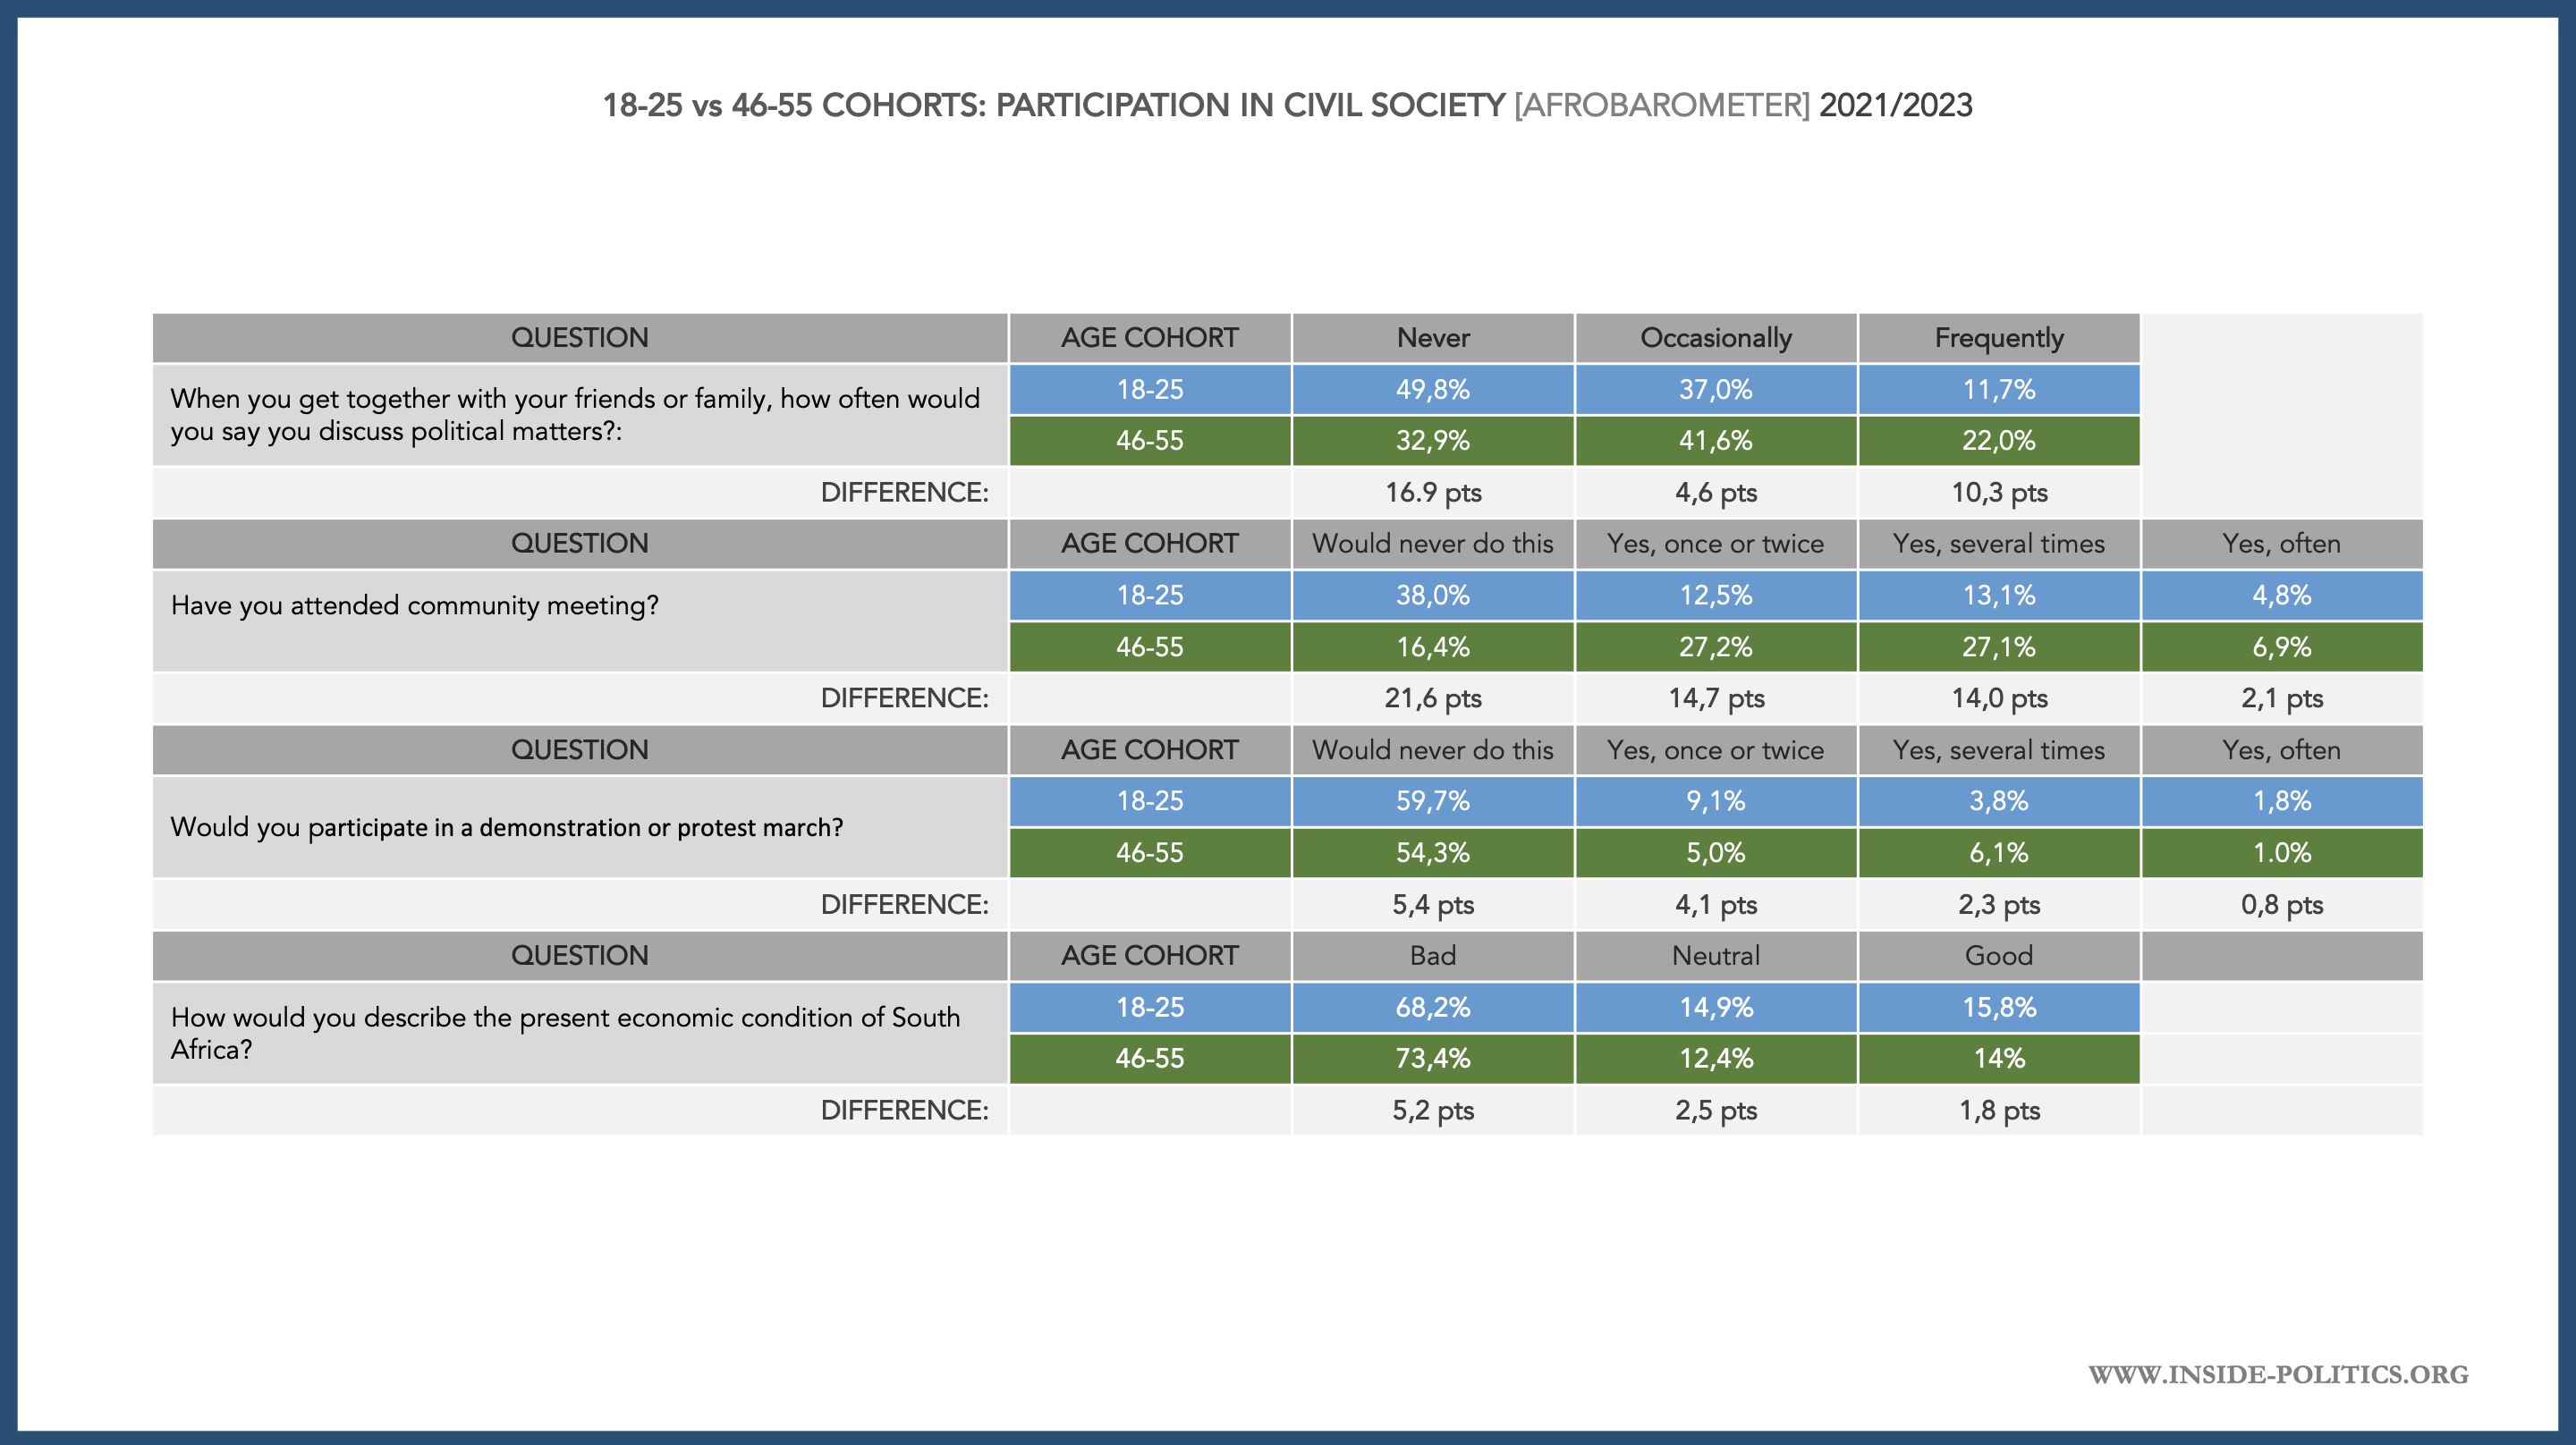
How often do you discuss politics: 18-25-year-olds discuss it less than 46-55-year-olds (10pt difference on “frequently”). Have you attended a community meeting: 18-25-year-olds attend less than 46-55-year-olds (14pt differences on “once or twice” or “several times). How would you describe South Africa’s economic condition (remember this is a cohort with world record unemployment): 46-55-year-olds think it is worse (5pt difference). (18-25-year-olds do seem to attend protests to a very small degree more than 46-55-year-olds on some indicators, not on others).
It is hard to reconcile these, and many similar indicators, with the defence offered for the youth’s lack of participation – that it must be the fault of political parties – because they are, to quote Corder, “extremely politically engaged, extremely involved and spend a lot of time seeking to understand certain issues“.
Not really, Afrobarometer suggests just 22% of 18-25-years frequently talk about politics and just 30% have ever attended a community meeting, in both instances, less than their middle aged counterparts.
Ute Inge Hermanus from Stellenbosch, produced a thesis on this, supervised by Dr. Collette Schulz-Herzenberg, who has written extensively on the youth and politics in South Africa. It found the following:
“The overall findings of this chapter indicate that youth in South Africa demonstrate higher engagement in electoral forms of political participation compared to non-electoral forms of political participation. This is different from Australian and American counterparts who demonstrate higher engagement in non-electoral forms of political participation in accordance with the ‘good citizen’ thesis.”
The truth is, and the data above supports this, the idea that the youth opt-out of formal politics, but disproportionately engage in informal politics is generally true elsewhere in the world but in South Africa – as low as their formal engagement is – it is still higher than their informal engagement.
Perception plays a part in the narrative that things are otherwise. The 2015 #Feesmustfall movement is a good example – often cited by those who suggest high informal youth engagement in politics. It is true, a significant number of students did partake in that protest but compared to the entire youth population, even the entire student population, this protest was incredibly small.
The entire higher education student population is around 1 million. A generous estimation of those who took part in #Feesmustfall is 50,000. But even if it was 100,000 that is only 10% of the student population and 0,4% of the entire 18-39 youth cohort. 100,000 is also just 0.8% of the 18-39 registered youth population. And besides, students are a more politicised sub-group than the youth generally.
That does not mean the #Feesmustfall wasn’t powerful or effective. Only 7,000 protestors took part in Sharpeville. But what you cannot say, is that it is indicative of a broad informal youth engagement with politics.
Municipal IQ, which tracks local government data, says, post Covid, the number of service delivery protest per year returned to pre-Covid levels. 193 in 2022. But even if 10,000 people took part in each one of those protests, and even if every one of them was young, that is 2m people, or 9% of the total 18-39 population.
The same is true of social media, which many commentators – again most likely projecting their own experience onto the youth entirely – assume “the youth” are on social media, en mass. Corder says one of the reasons political parties cannot connect with the youth is that, “they have no idea what it is like to have your life mediated through social media”. He argues TikTok is a primary example of this. But, going by his own numbers, just 1,5m South Africans are on TikTok each month. Even assuming every single one of them were young, that’s just 6,5% of the total 18-39 youth cohort.
Again and again people assume, because their bubble has these patterns, “the youth” must have these patterns too. It is just not true. The vast majority of the youth couldn’t care less about TikTok.
In all these areas, the popular youth narrative relies on perception. They never cite actual numbers, and feed off media coverage which creates the illusion that the youth are hugely political informally. When in truth, the actual numbers are tiny, certainly as a proportion of the entire youth population.
Some very serious work has been done on youth participation in democracy. In their 2022 paper, Beyond the binary: examining dynamic youth voter behaviour in South Africa, by Martin Bekker, Carin Runciman and Benjamin Roberts – and also based on market research – they found the following, when it came to reasons for abstention among the youth, in the 2021 election:
Among the 18-24 cohort, “administrative” (36%) and “individual” (32%) barriers were the primary reasons for not voting. 68% between the two. “Disillusionment/disinterest” accounted for just 13% of respondents in that cohort.
This trend was true of most cohorts, but acute among the youth. Bekker, Runciman and Roberts wrote the following in response to that finding:
“For the youth, irrespective of their generation, individual and administrative barriers were the primary reasons for abstention, with not registering to vote or being ‘too busy’ to vote are being mentioned among the common reasons provided for not voting. Not registering to vote is a pre-emptive disengagement from electoral democracy, while being ‘too busy’ may suggest that participating in electoral democracy is not strongly valued by some.”
There is a wealth of data that suggests “the youth” are less engaged in politics, formal or informal, than their older counterparts. In turn, a wealth of data that suggests they are less disillusioned than other, older cohorts.
PART III: Bubble analysis and its pitfalls
One of the problems with so much “youth analysis” in South Africa is that it tends to take place in a bubble. The Human Sciences Research Council (HSRC) which does a lot of work for the IEC on this front, is particularly notorious for this. The 18-39 cohort – or a subgroup within it – is analysed in and of itself. There is rarely an attempt to compare and contrast age cohorts.
Look at “the youth” in insolation and it is almost inevitable you will arrive at the conclusion they are disillusioned (everyone is). But the response to that – that this is entirely a consequence of the neglect of youth issues by political parties does not follow. No doubt parties can do more, but it is one of several complicated forces at play, most of them only revealed by comparative analysis (with other age cohorts and against time and population trends).
Apathy is itself incredibly difficult to gauge using market research. Few people are honest enough to admit they are personally at fault, whatever their age. You can include categories like “laziness” in a market survey on voting abstention. No one will choose it. People conceive of themselves as noble and their decisions are almost always retroactively justified as virtuous or reasonable. One has to read between the lines to identify it.
The response “too busy” is indicative of apathy. Likewise “administrative” and “individual” barriers. Anyone who is too busy to vote, or has found themselves in the wrong province on Election Day, has priorities other than voting. And that has nothing to do with disillusionment.
Take a step back, look at the full comparative picture, and the following would seem to hold true:
General
- 52% of the youth are registered to vote and engaged in formal politics to one degree or another.
- Available evidence suggests that the youth are not highly political (in an informal sense). They partake in informal politics to a small degree, and less than their older counterparts. Although clearly disillusioned, they are relatively less disillusioned and more optimistic than their older counterparts.
- Despite this, they engage in formal democracy at a far lower rate, and at a rate that declines as the age cohort reduces.
- Generally, the youth demonstrate no large-scale desire to actively engage in formal politics, in so far as establishing their own political party or movement goes, preferring to opt out.
- Among reasons for not voting, administrative and individual barriers feature strongly, disillusionment to a far smaller degree.
- The youth are also not a homogenous group, but political behaviour varies greatly between age cohorts.
18-19:
- A small and volatile group, highly susceptible to general trends, that turnout to vote to a high degree compared to their youth cohort counterparts, and well above the average. Registration trends are stable (barring 2021 and Covid) as their proportion of the general 18-19-year-old population (29,1%).
20-29:
- A large group primarily responsible for the decline in the registration among the consolidated 18-39 youth cohort. However, more democratically engaged than their 18-19 cohort regards registration: 43,9% of all 20-29-year-olds are registered to vote (compared to 29,1%). The decline in 20-29 cohort is driven by various factors, including general disillusionment and population decline. Turnout has generally not been significantly below the average but there is a gap developing.
30-39:
- The biggest and most stable cohort among the youth. 62,1% of all 30-39-year-olds are registered to vote, and while a worrying gap has developed between the 30-39 registered and general population, this has not yet significantly impacted on their registration rate, which continues to grow steadily election-on-election (unlike the 20-29 cohort). Like the 20-29 cohort, turnout has generally not been significantly below the average but there is a gap developing.
What are we left with after all this? While much of the youth’s behaviour can be explained by general disillusionment it cannot explain their disproportional opting out. Population decline is a mitigating factor (although ignored). And the idea that they simply choose to be political in other, informal ways, cannot explain their low participation rates in these areas either (as those levels are lower than older cohorts, who participate at a higher rate).
What you are left with is apathy. And a lot of it. A great many young people are just not that interested in politics. They feel it doesn’t yet affect their lives directly, they are pandered to by a popular narratives that suggest they need do nothing but wait until the right party comes along, and so, the younger they are, the more disengaged when it comes to registration. There is no pressure on those who opt out to take action or be responsible, and they are shielded from blame or criticism.
It is important to interrogate this myth, because an entire industry has grown up around it, and in response to it, from NGOs to media campaigns, to political parties. All accept this narrative unquestioningly.
Political parties bear the brunt of this popular but generally false narrative. And as with any good fiction, it contains within it some truth. Of course political parties must play their part, and they can and should do more. But democratic participation is a two-way street, and so much is focused on political party responsibility, so little on personal responsibility. If the youth are to become engaged adults, and not perpetual children, the narrative about them needs to become more grounded in facts, more sophisticated and, at least to some degree, hold the youth jointly responsible for their actions, or lack thereof.
This essay is the 13th in an on-going series on Election 2024, for all other editions of this series, please click here: Election 2024
Discover more from inside politics
Subscribe to get the latest posts sent to your email.

[…] talk about politics and 30% have ever attended a community meeting, according to a thought piece ‘Busting the “disillusioned youth” myth’ by political commentator Gareth van Onselen. They prefer to use their agency and time outside of […]