
Election 2026/7 [3] Turnout, Ekurhuleni, the ANC and DA
by The Editor

A comprehensive look at turnout trends in Ekurhuleni, with a focus on the ANC and DA. The ANC’s support appears to be in an exponential decline and, as a result, the DA needs only the smallest differential turnout advantage to make a profound impact. But the turnout trends are not on the DA’s side, and it is going to require something special.
Turnout, Ekurhuleni, the ANC and DA
By: Gareth van Onselen
Follow @GvanOnselen
3 October 2025
This essay is the 3rd in an on-going series on Election 2026/7, for all other editions of this series, please click here: Election 2026/7
Introduction
This is the third essay in a series of in-depth, statistically driven analytical essays on the upcoming local government elections (to be held at some point between November 2026 and January 2027). Following our look at Johannesburg and Tshwane, this essay focuses on Ekurhuleni.
Ultimately, we will look at all eight metros, before moving on to some consolidated national analysis. But, before that, and because Gauteng is unique in this regard, I’ll take a consolidated look at all three Gauteng metros, and what insights can be gained from that.
Turnout: Ekurhuleni
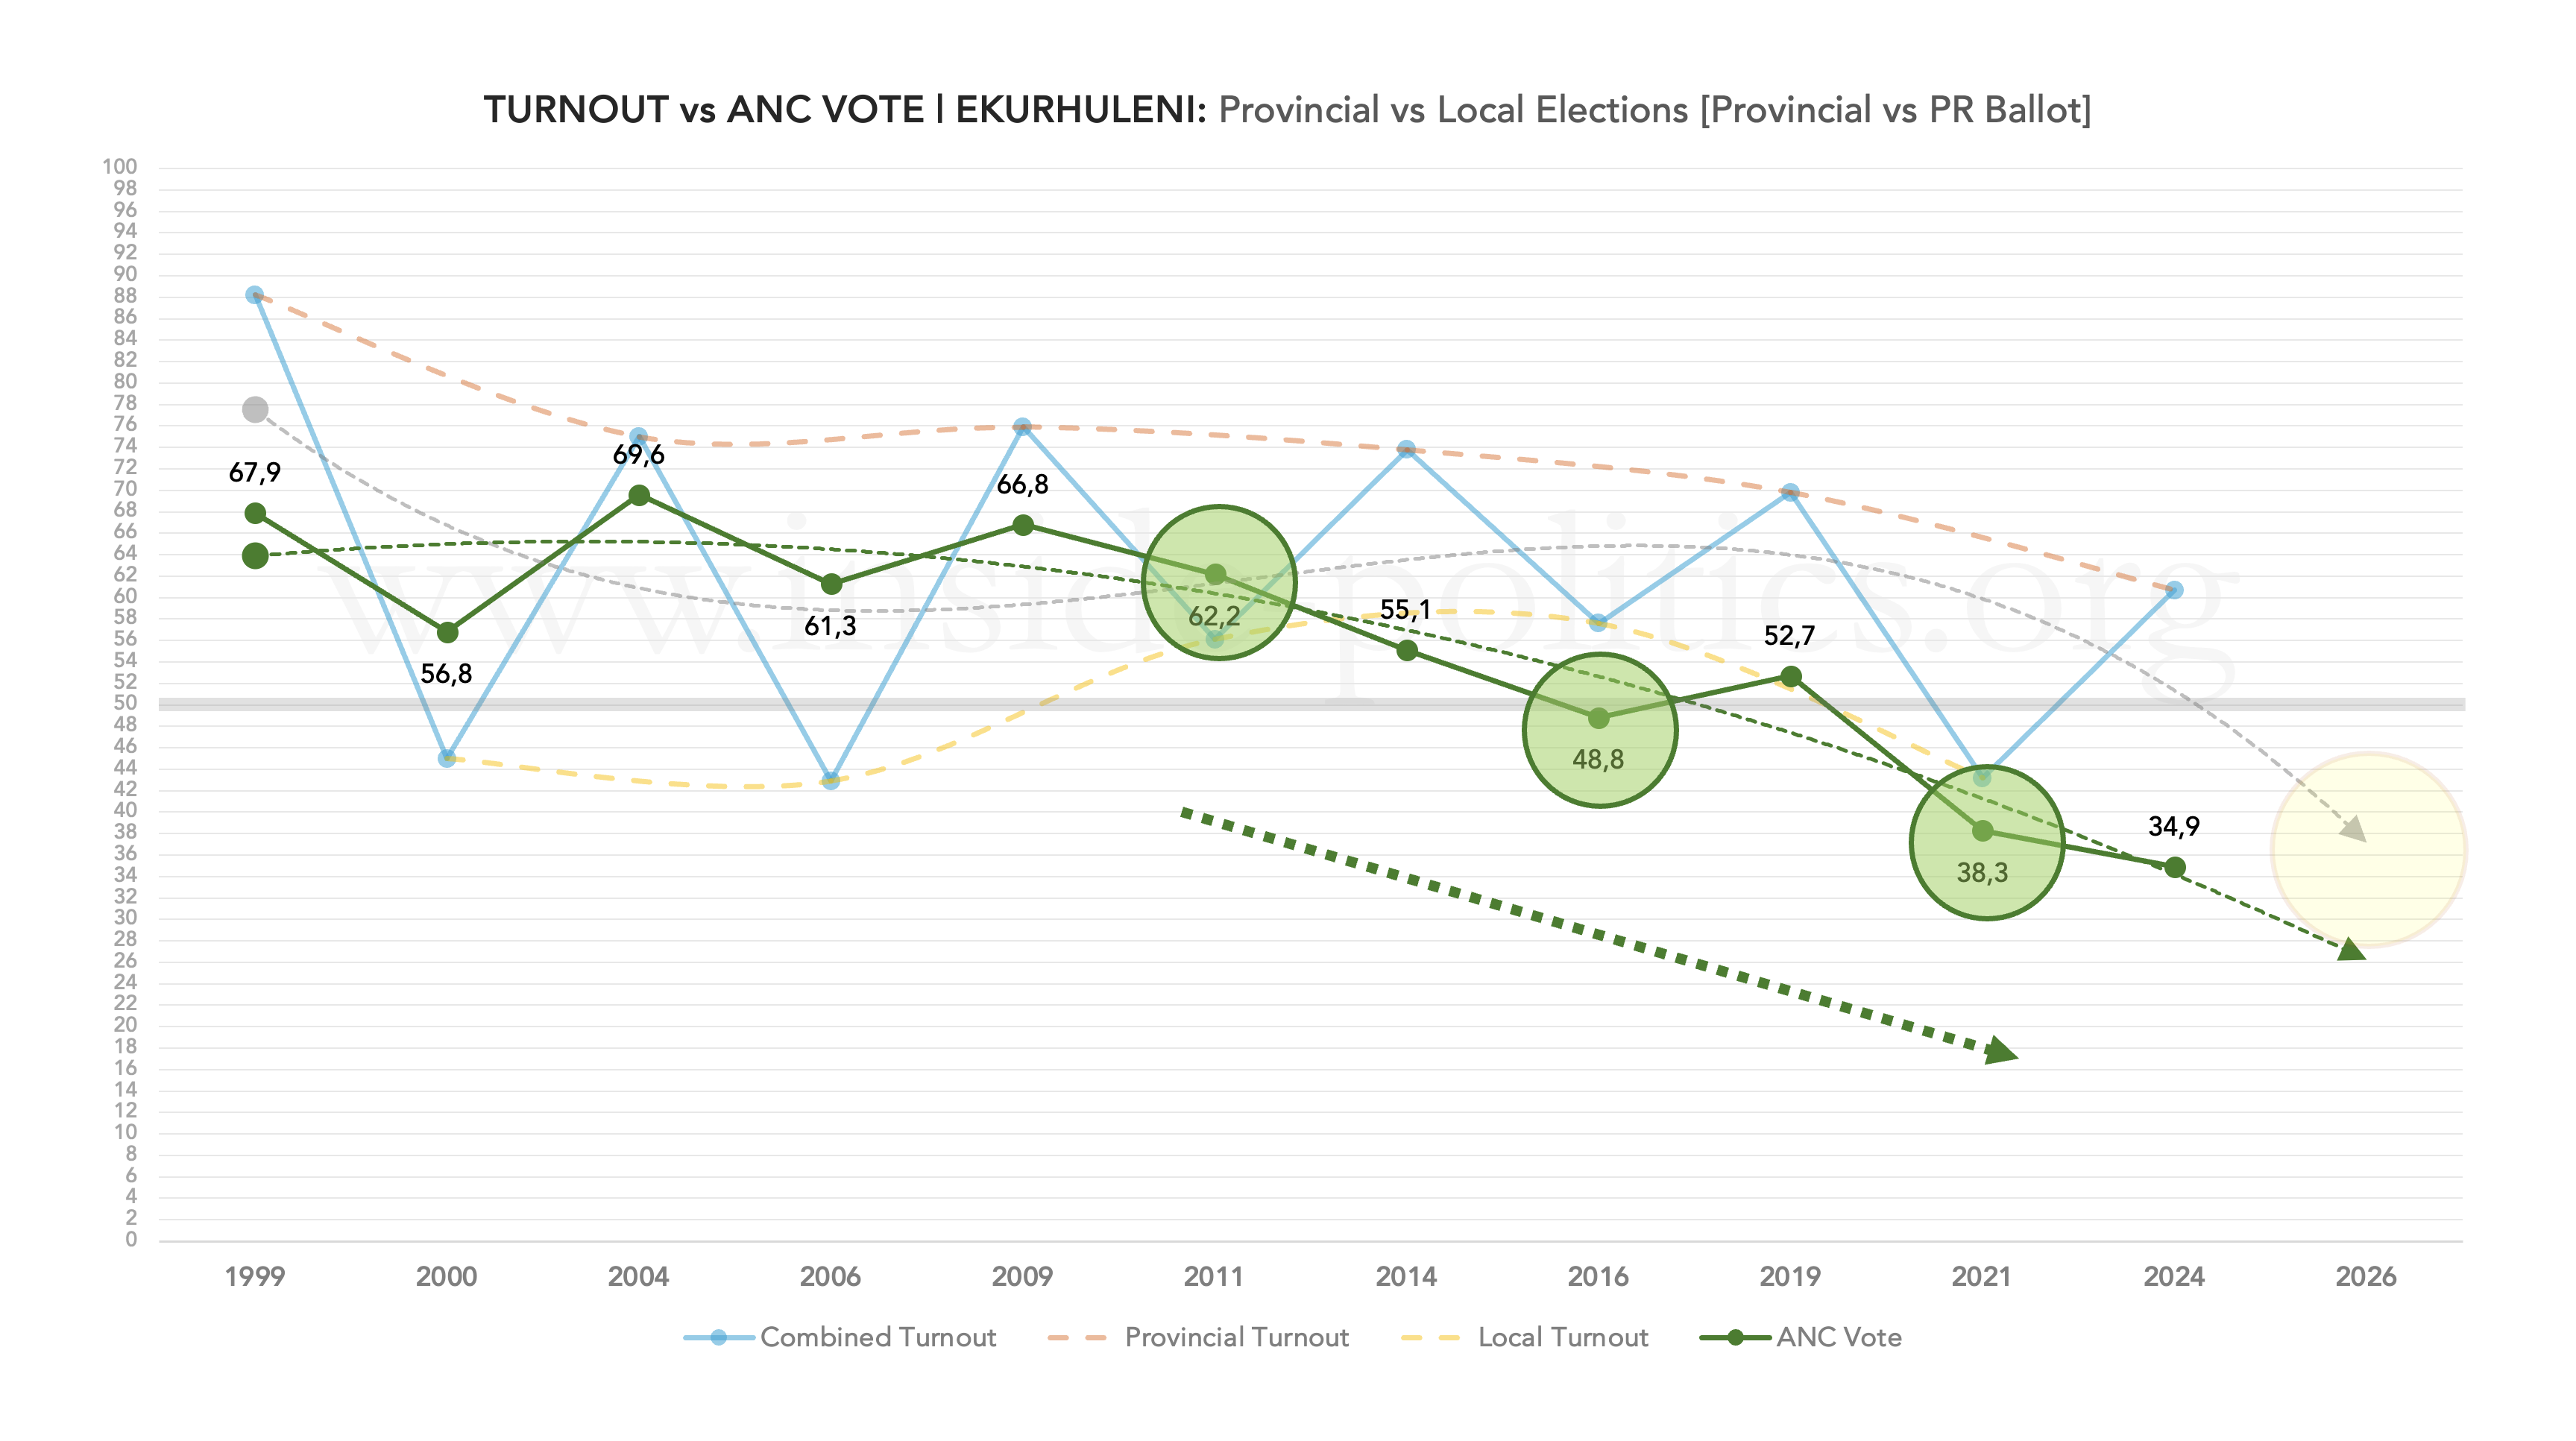
The graph below sets out the provincial and local election turnout results for Ekurhuleni. The pattern mirrors the other two Gauteng metros, starting off relatively stable (all the way through to 2019) and then dropping dramatically (2021 and 2024 in particular).
43.2% in 2021 is not the lowest-ever turnout in Ekurhuleni (that was 42.9% in 2006) but all indications are that a new record low will be set in 2026/7 and by a considerable margin – barring some as yet undetected wave of democratic enthusiasm sweeping the nation.
While the general trendline (that accounts for both provincial and local elections) suggests Ekurhuleni headed for the middle of the 30% bracket, the trendline for local elections only is more depressing still, suggesting 30% full stop will be something of a miracle.

A note on these trendlines, which I have made use of in every essay up to this point (and will continue to use going forward): their strength is the assumption that historical patterns will hold going into the future. Their weakness is when those patterns are interrupted by something abnormal.
Nationally and locally (in the metros) there are really only two “abnormal” changes which could alter things dramatically. The first, alluded to above, is a reversal of the voter apathy that currently holds our democracy in its grip. That is unlikely. But the second is a more distinct possibility: that the ANC’s decline is no longer systematic but exponential.
In this scenario, the ANC’s vote implodes in 2026/7, not so much tumbling down a hill as it has been doing, but falling off a cliff. All the turnout graphs and the ANC’s metro vote share graphs produced so far illustrate a dramatic recent decline. And, because both are linked, if the one drops off our imaginary cliff, so will the other. That is just as true of Ekurhuleni, as it is Tshwane and Johannesburg.
Below is the ANC’s vote share over time, for Ekurhuleni, with the turnout trends faded in the background.
The ANC’s decline in the metro has been substantial and relatively consistent up to this point. Between 2011 and 2016 it lost 13.4pts (down from 66.2% to 48.8%), and between 2016 and 2021 it lost 10.5pts (down from 48.8% to 38.3%). Optimists out there might say the ANC is bottoming out but, as with Tshwane and Johannesburg, it is the ANC’s 2024 provincial number that is all-telling.
Remember, the ANC vote goes up in national and provincial elections, down in local elections. Thus, the preceding provincial result is almost always the maximum base support from which the ANC can draw on in the next local elections. But that pattern broke in 2024 in Ekurhuleni. There was no ANC bump. Instead, a big ANC decline, down to 34.9% – amazingly, its lowest ever percentage in that metro – below even 2021.
So there is no bigger national election base for the ANC to draw on in 2026/7. It is gone. This is one of the stronger indications that, perhaps, the next local election in Ekurhuleni will produce an exponentially bad ANC result, as opposed to something more predictably bad.
Below is the ANC’s consolidated vote share track for all metros (I am adding them one by one as we go along).

The key figure here is not actually the latest one, rather the 52.7% the ANC secured in 2019. That set it apart from Johannesburg and Tshwane, as the only Gauteng metro where the ANC retained an outright majority. It also spoke to a more resilient base in the metro (further illustrated by the fact that, for years, the ANC in Ekurhuleni tracked above Tshwane and Johannesburg).
But the ANC’s decline from 2019 to 2024 in Ekurhuleni (-17.8pts) is big and dramatic, even fractionally bigger than Johannesburg; more evidence that the ANC’s spiral in the metro is steep indeed.
(As an aside: Notice how the ANC’s national percentage has, since 2011, pulled above its performance in Gauteng metros. This is because it now relies on more rural provinces to deliver the bulk of its support. You will see the opposite with the DA, a bit further down.)
Turning to the DA, the graph below sets out the DA’s vote share in Ekurhuleni over time. Ideally, the DA would have wanted to see the rapid and recent decline in the ANC’s vote translate into more DA votes, but it has struggled. In fact, it too is headed in the wrong direction.

Its peak percentage, of 34.1% in 2016, dropped dramatically to 28.4% in 2021 (a significant decline of almost 6pts). And while it did manage to improve marginally on its 2019 result (25.5%) in 2024 (26.4%) it will be the 2021 result that most disturbs the party: Its typical local election “bump” was marginal, and that means it too has a turnout problem.
If one views the DA vote share in Ekurhuleni over time (below), for a long period (up until 2019) it trailed the party’s performance in Johannesburg and Tshwane, but has since overtaken Johannesburg – a further sign of how problematic the DA’s performance in Johannesburg is.

(Aside: Here you also see the inverse of the ANC’s vote share – how the DA’s national percentage is below its metro performances, meaning it is heavily reliant on them and its vote share typically gets dragged down by its rural results.)
Slumps and bumps
Below is a graph that maps the DA’s historical local election “bump” and the ANC’s historical local election “slump”.

The ANC’s traditional “slump” in local elections has dramatically worsened in Ekurhuleni:
- 2009–2011: dropped 4.6 pts
- 2014–2016: dropped 6.3 pts
- 2019–2021: dropped 14.4 pts
To give an idea of just how dramatic that is: if the ANC slumps by 14.4% again in 2026/7, it will land on just 20.5% in the metro, worse than that and it will be in the teens. The recipe for not landing on 20% therefore is simple: The ANC needs its voters to be more enthusiastic than they were in 2024. In fact, that sentence is the fundamental obstacle to the ANC, across the board. Such a basic requirement, and yet all indications are it will be next to impossible to achieve.
As for the DA, it too has issues, as alluded to above:
- 2009–2011: gained 8.8 pts
- 2014–2016: gained 5.0 pts
- 2019–2021: gained 2.9 pts
As with the other Gauteng metros: ever diminishing returns. And, as with the other Gauteng metros, the DA will, at worst, rely on the ANC’s decline outstripping its own in the metro. Unlike the ANC, the DA does have a more realistic chance of injecting some enthusiasm into its voters. Anything on this front will make a dramatic difference. If it could secure just a 5pt differential, for example, it would put it on 31.8%. The same differential as 2021 would put it on 29.7%. If it’s differential continues to decline at its historic rate, it should end up around 24%.
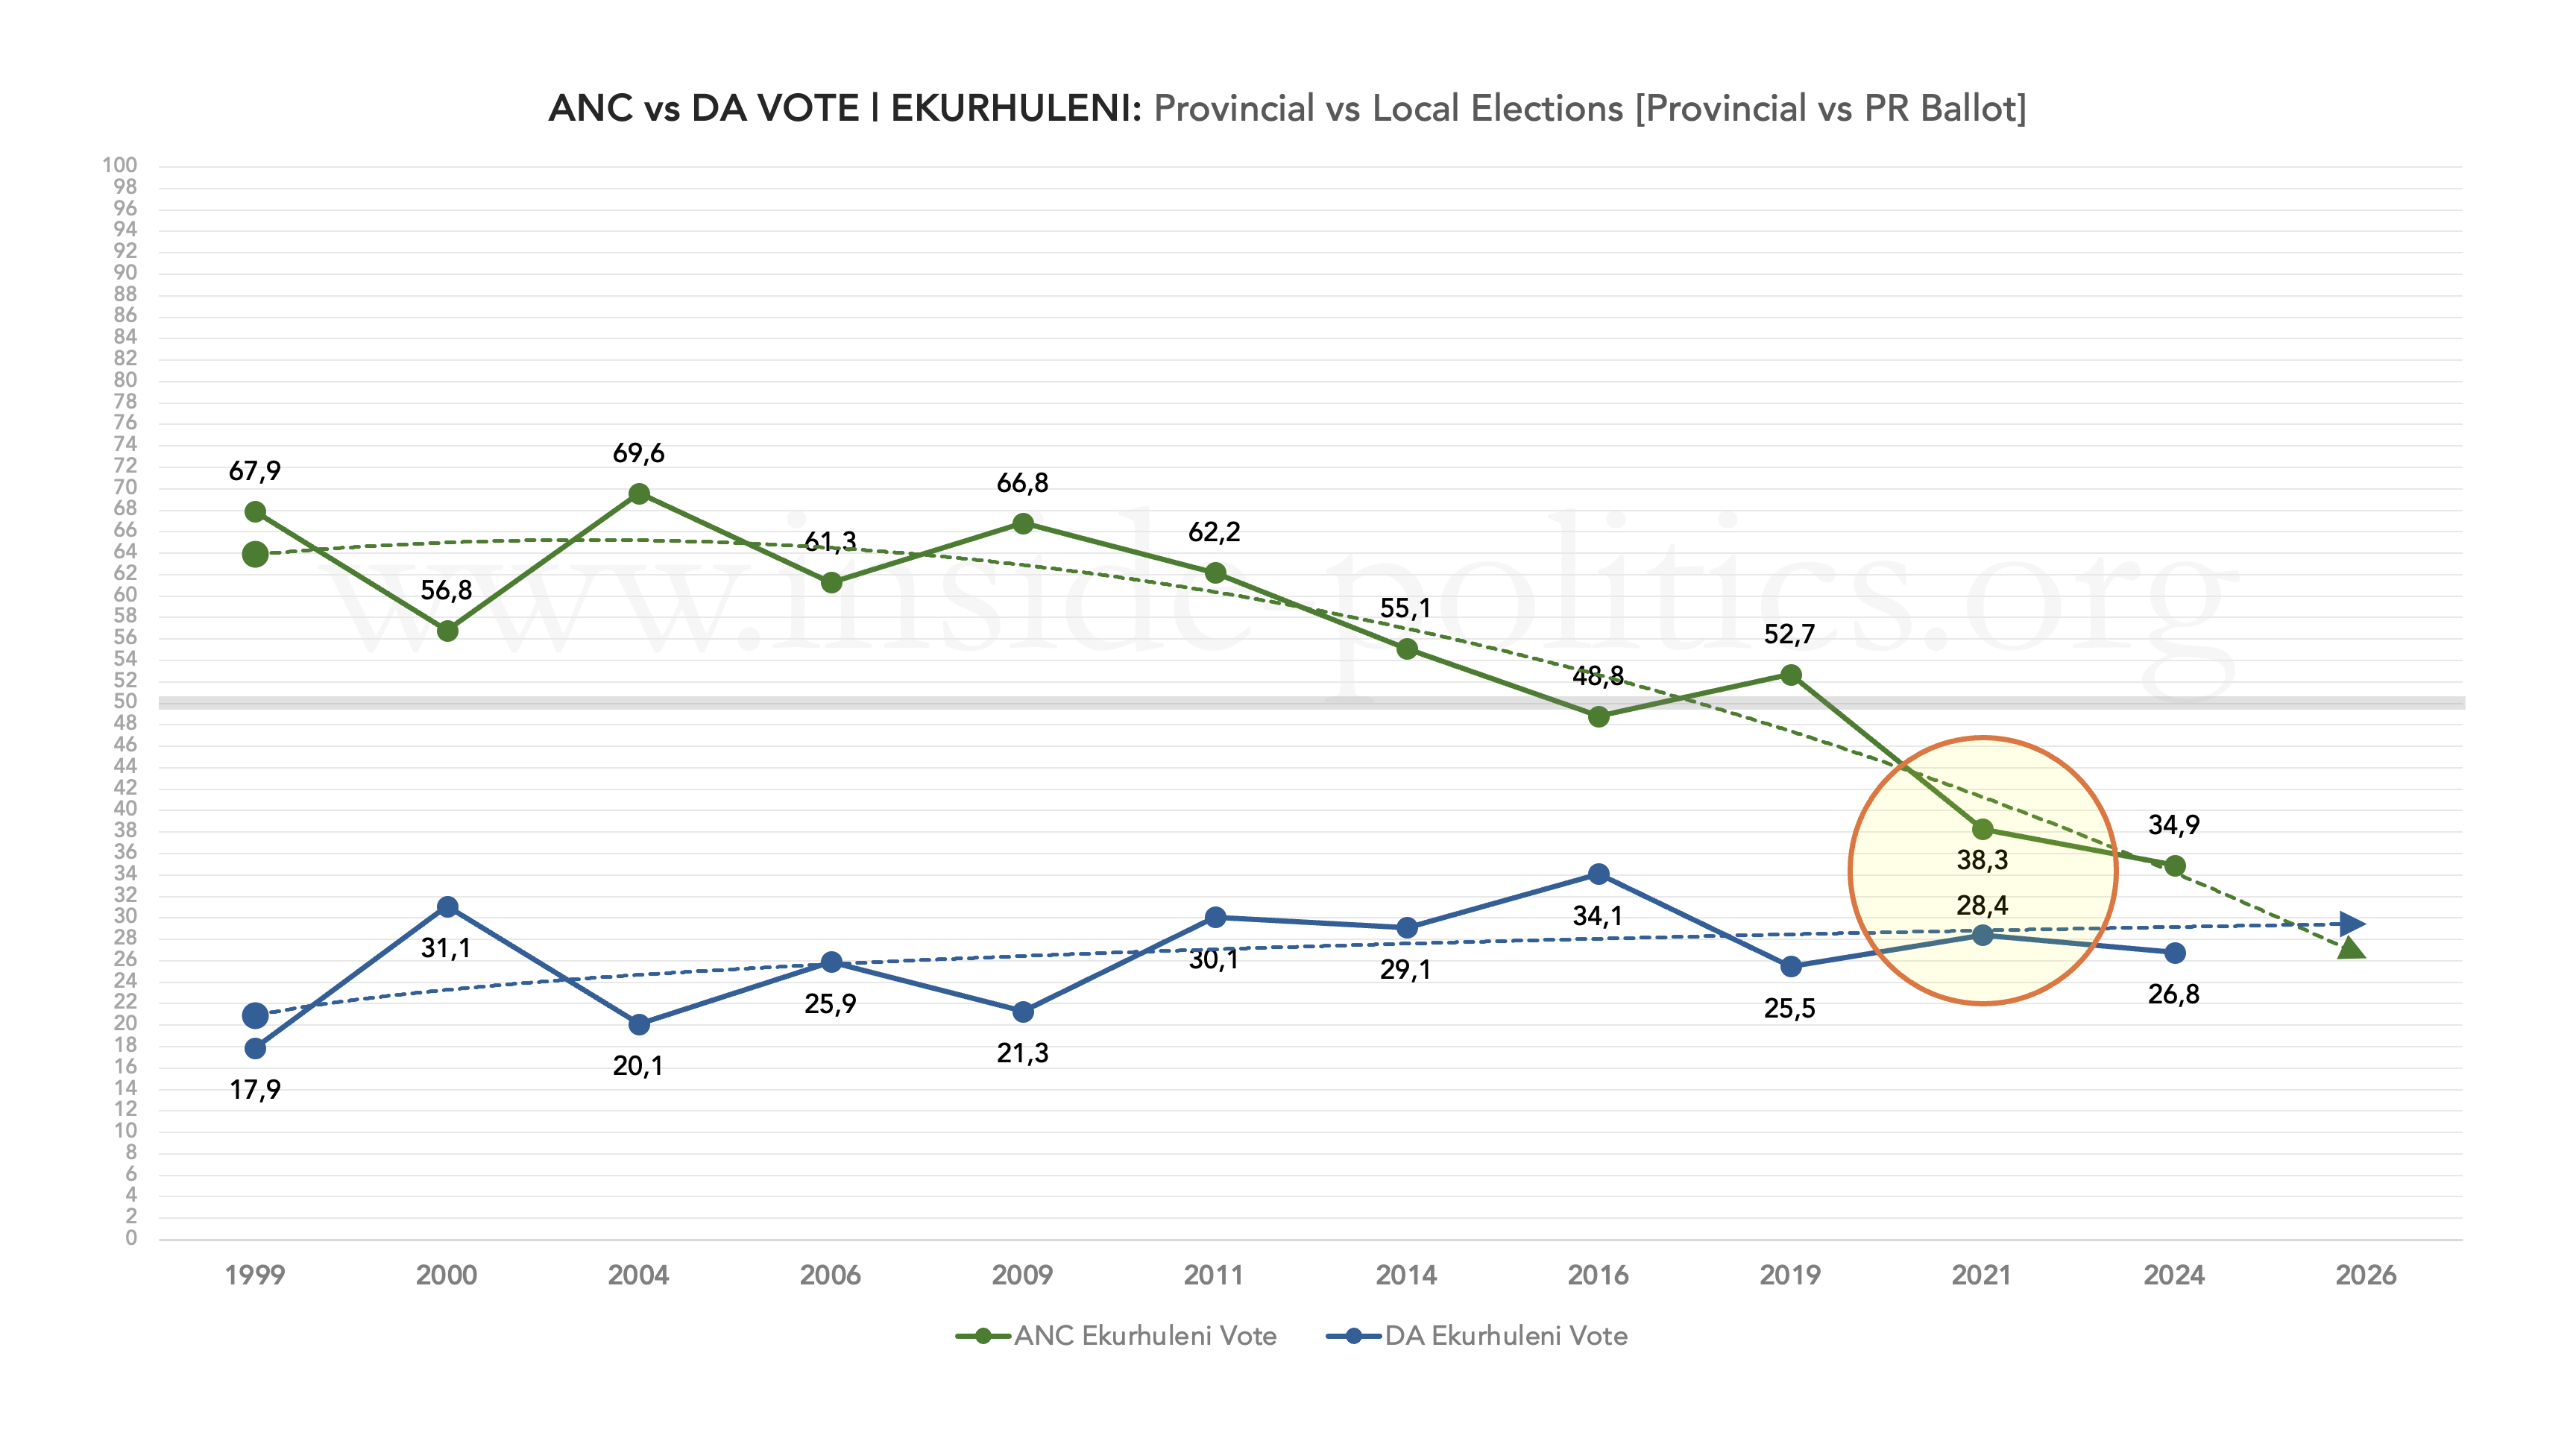
Finally, before moving onto the ward-by-ward analysis, it is worth plotting the ANC and DA vote share on the same graph (below). It differs from Johannesburg and Tshwane in one important respect: the point at which the ANC and DA lines come closest to crossing is 2021 (with a gap of 9.9pts) as opposed to 2016 (14.7pts). The DA’s bump in 2021 (although greatly reduced) and the ANC’s slump (greatly increased) was still in evidence, and is something from which the DA will take heart, as it aims to replicate it in 2026/7.
A ward-by-ward view of Ekurhuleni turnout
The scatter graph below shows ANC turnout (the ANC’s PR vote divided by the total registered voting population) in every ward in Ekurhuleni, for 2000–2021 (every dot is a ward). The ANC’s turnout percentage runs up the Y-axis, and the size of the ward (in terms of registered voters) runs along the X-axis. So, what you want as a political party are dots up and towards the right-hand corner (big ward/high turnout).
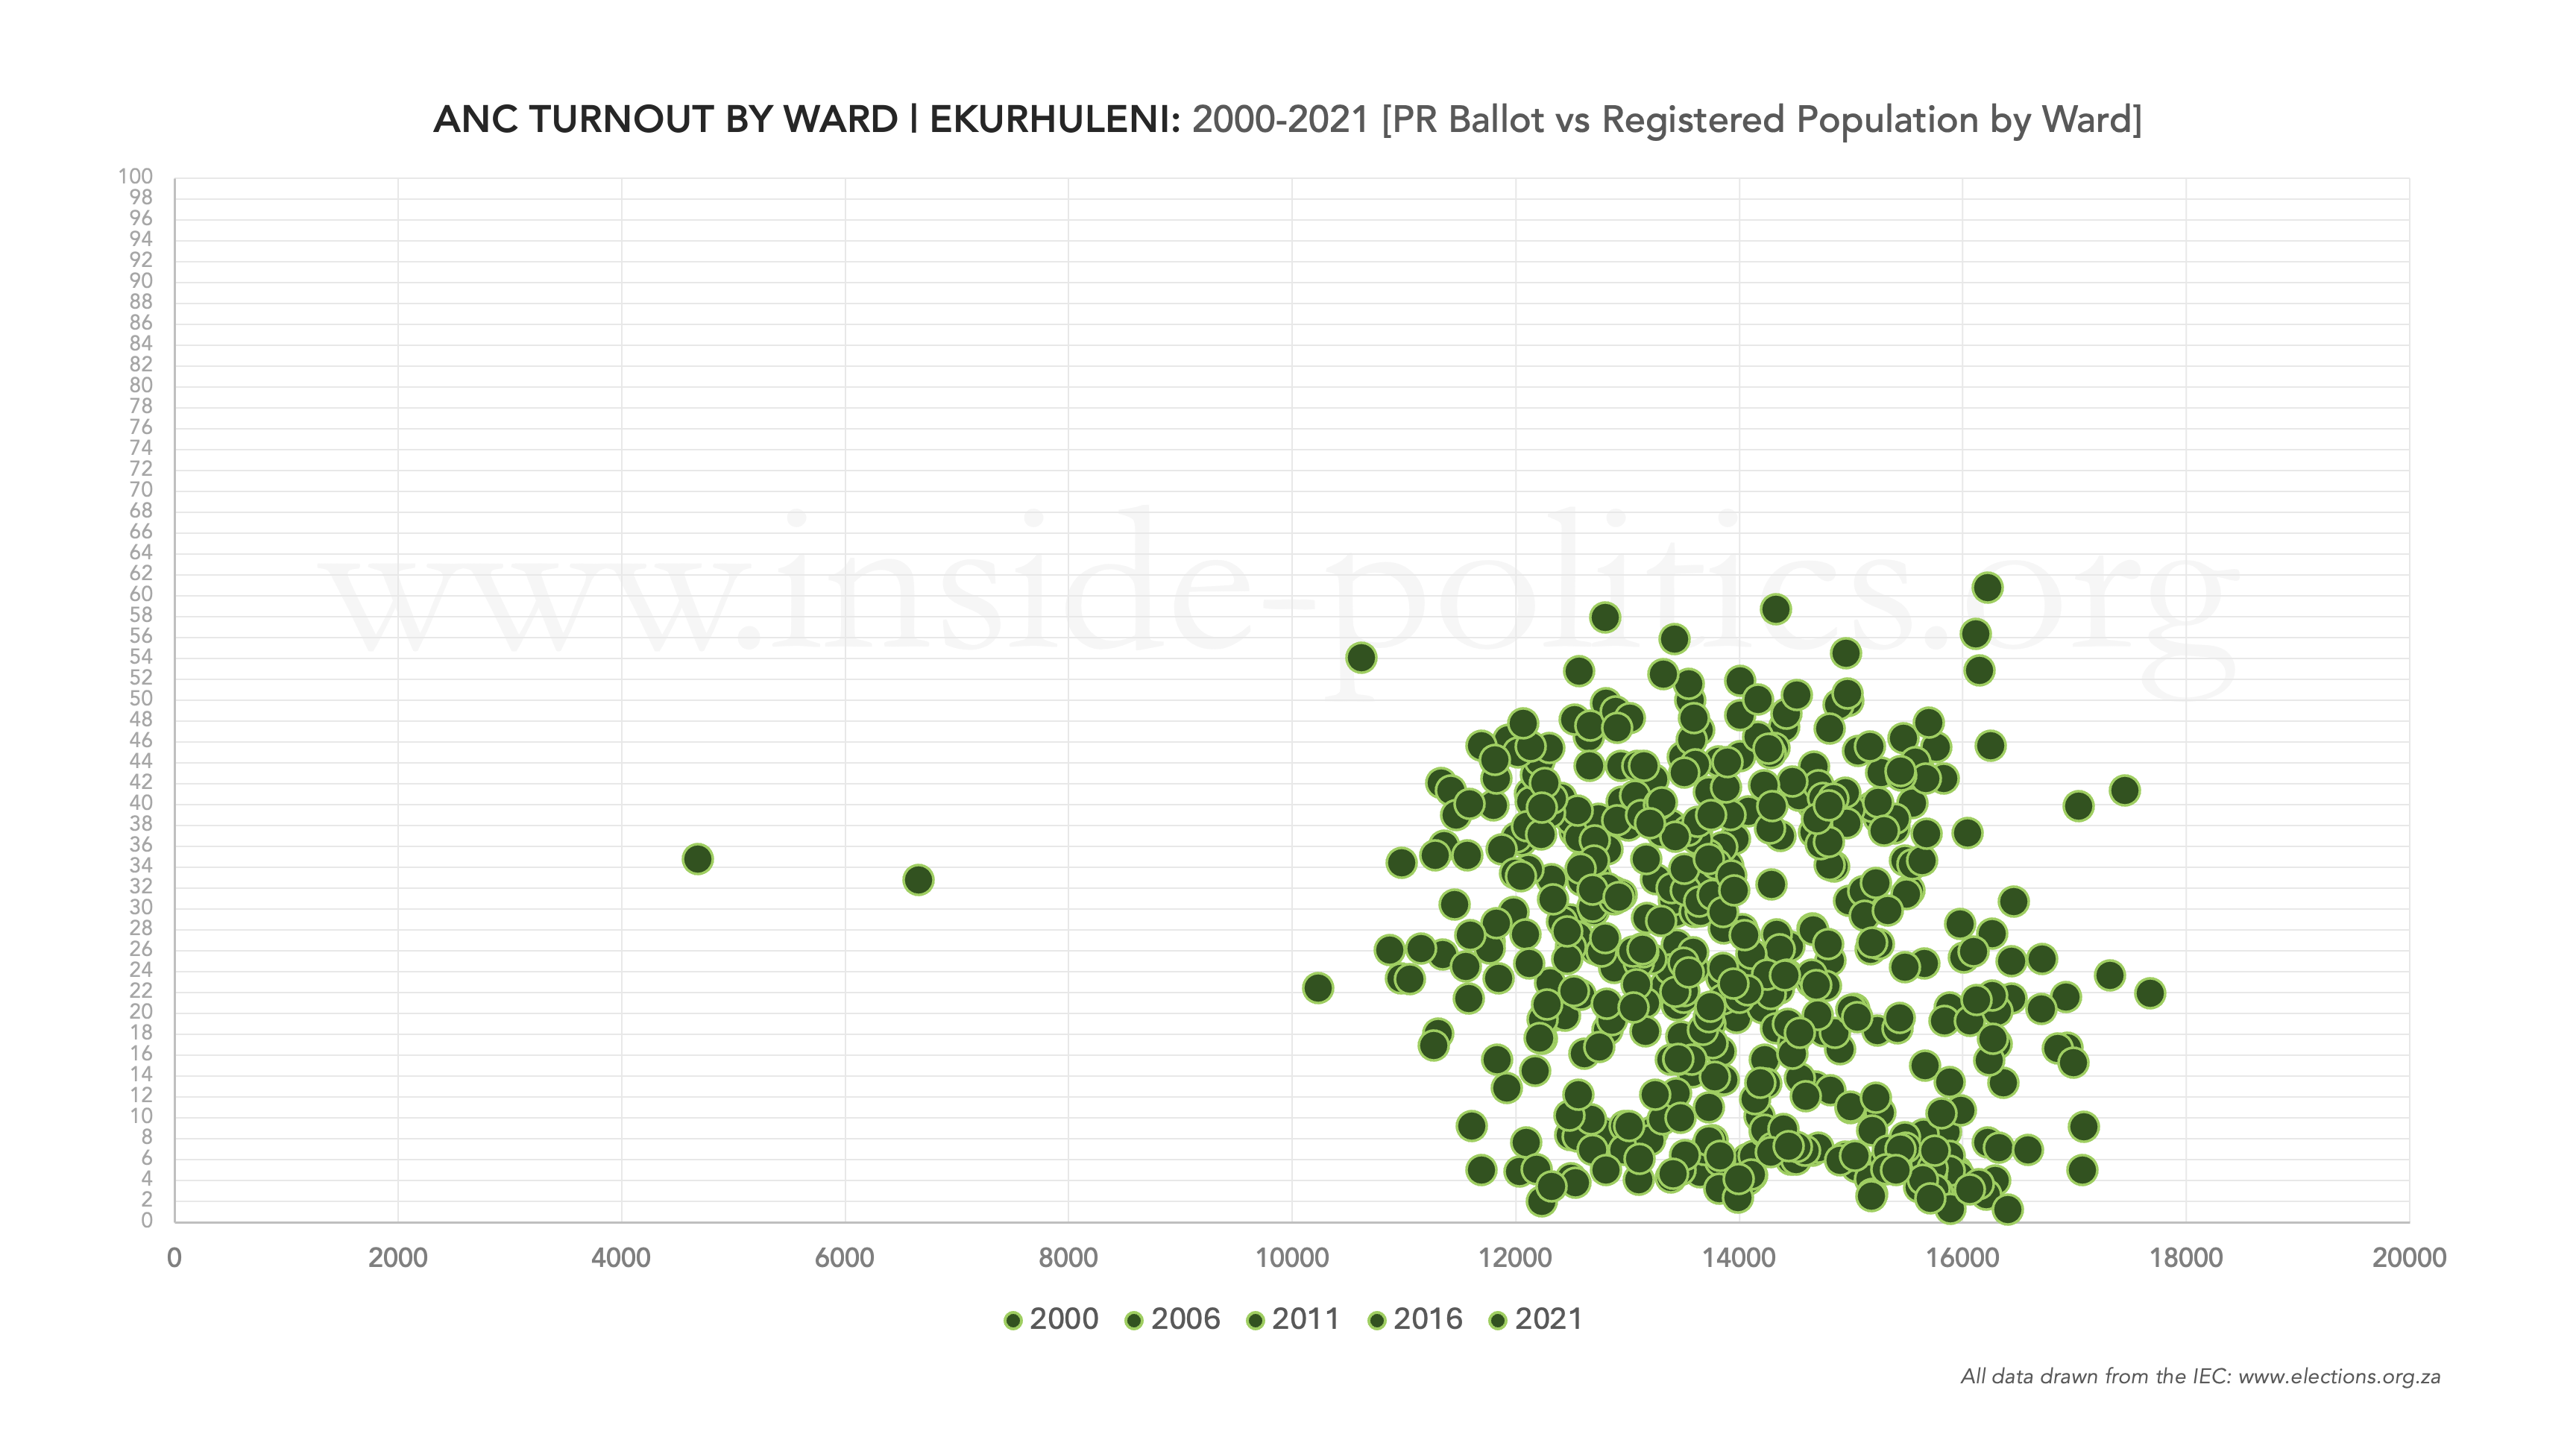
As with the other Gauteng metros the ANC has a good spread over the years. This would be an excellent set of results if it was a single election. But it is not. And when you disaggregate the individual election years, its recent decline becomes apparent.
The following two graphs (below) illustrate a good election for the ANC in Ekurhuleni (2011) and a bad one (2021).

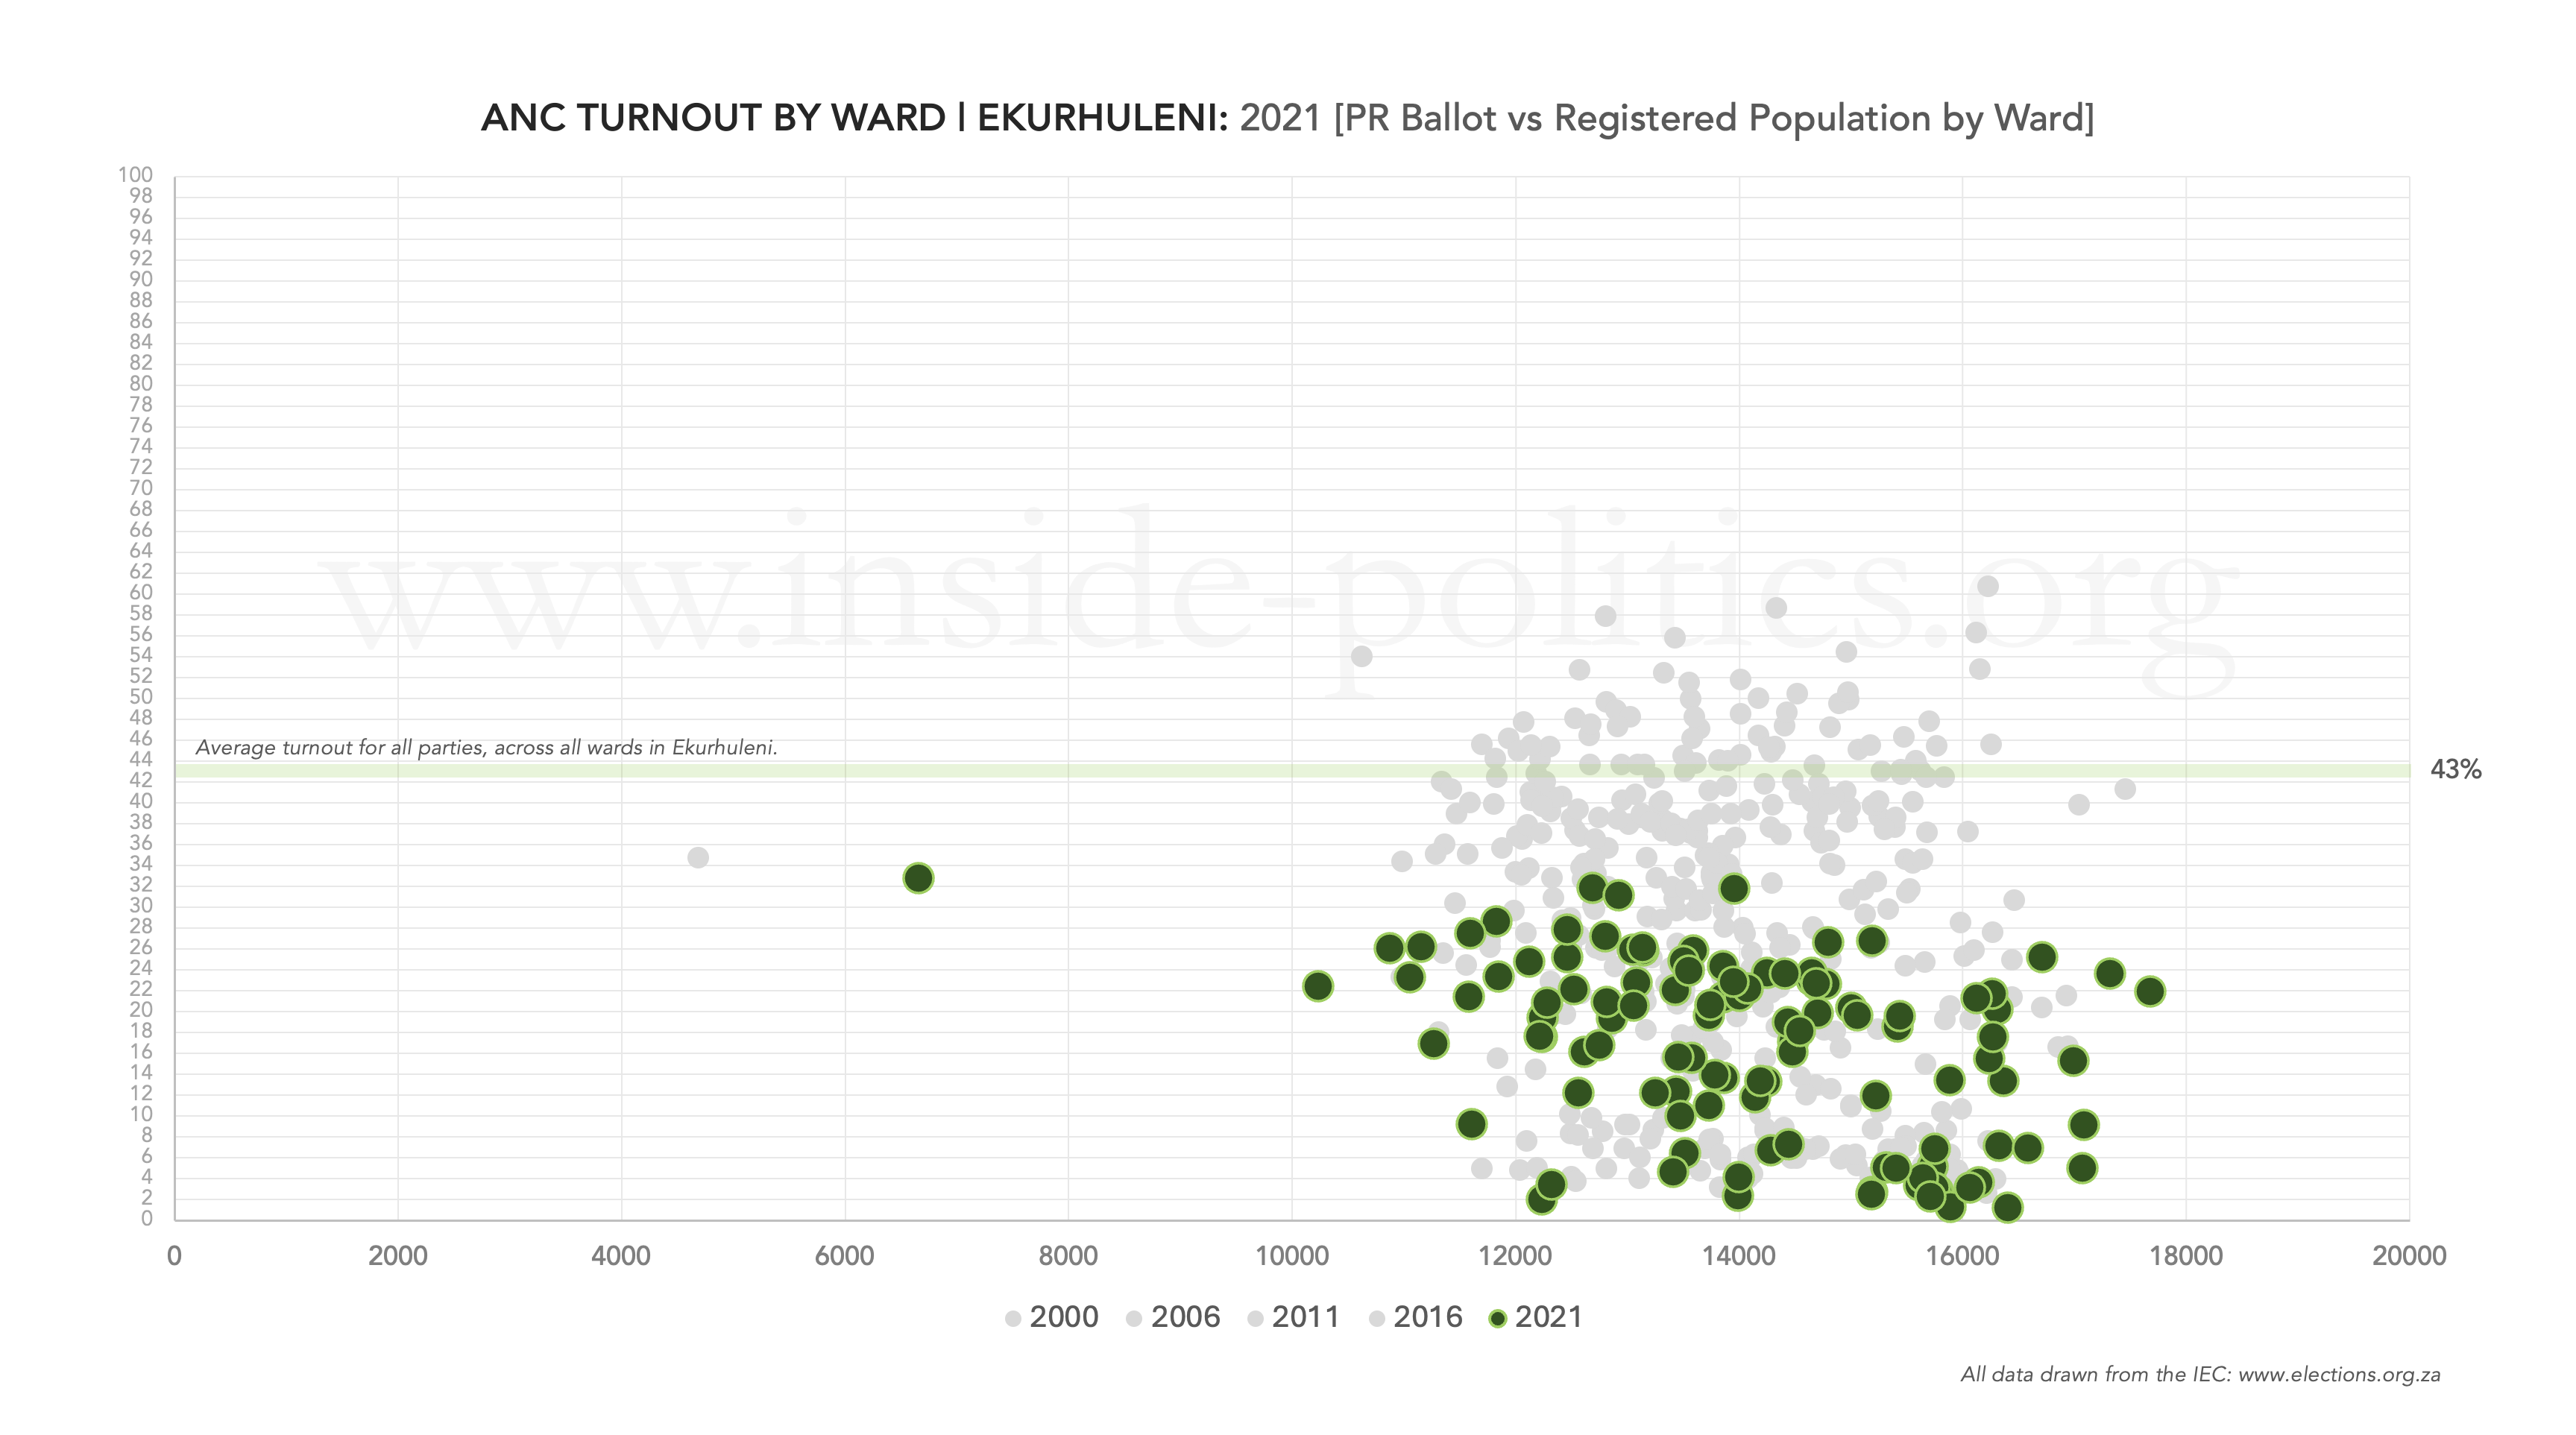
You can see how repressed the ANC vote becomes in 2021. In 2011, it has a number of wards on or about the turnout average (56%), in 2021 the turnout average declines dramatically (down to 43%) and, even then, ANC wards cannot keep up, as they all get squashed well below the average.
The DA suffers the same kind of problem, only to a lesser degree. But let us start with its general spread, for all election years (below).
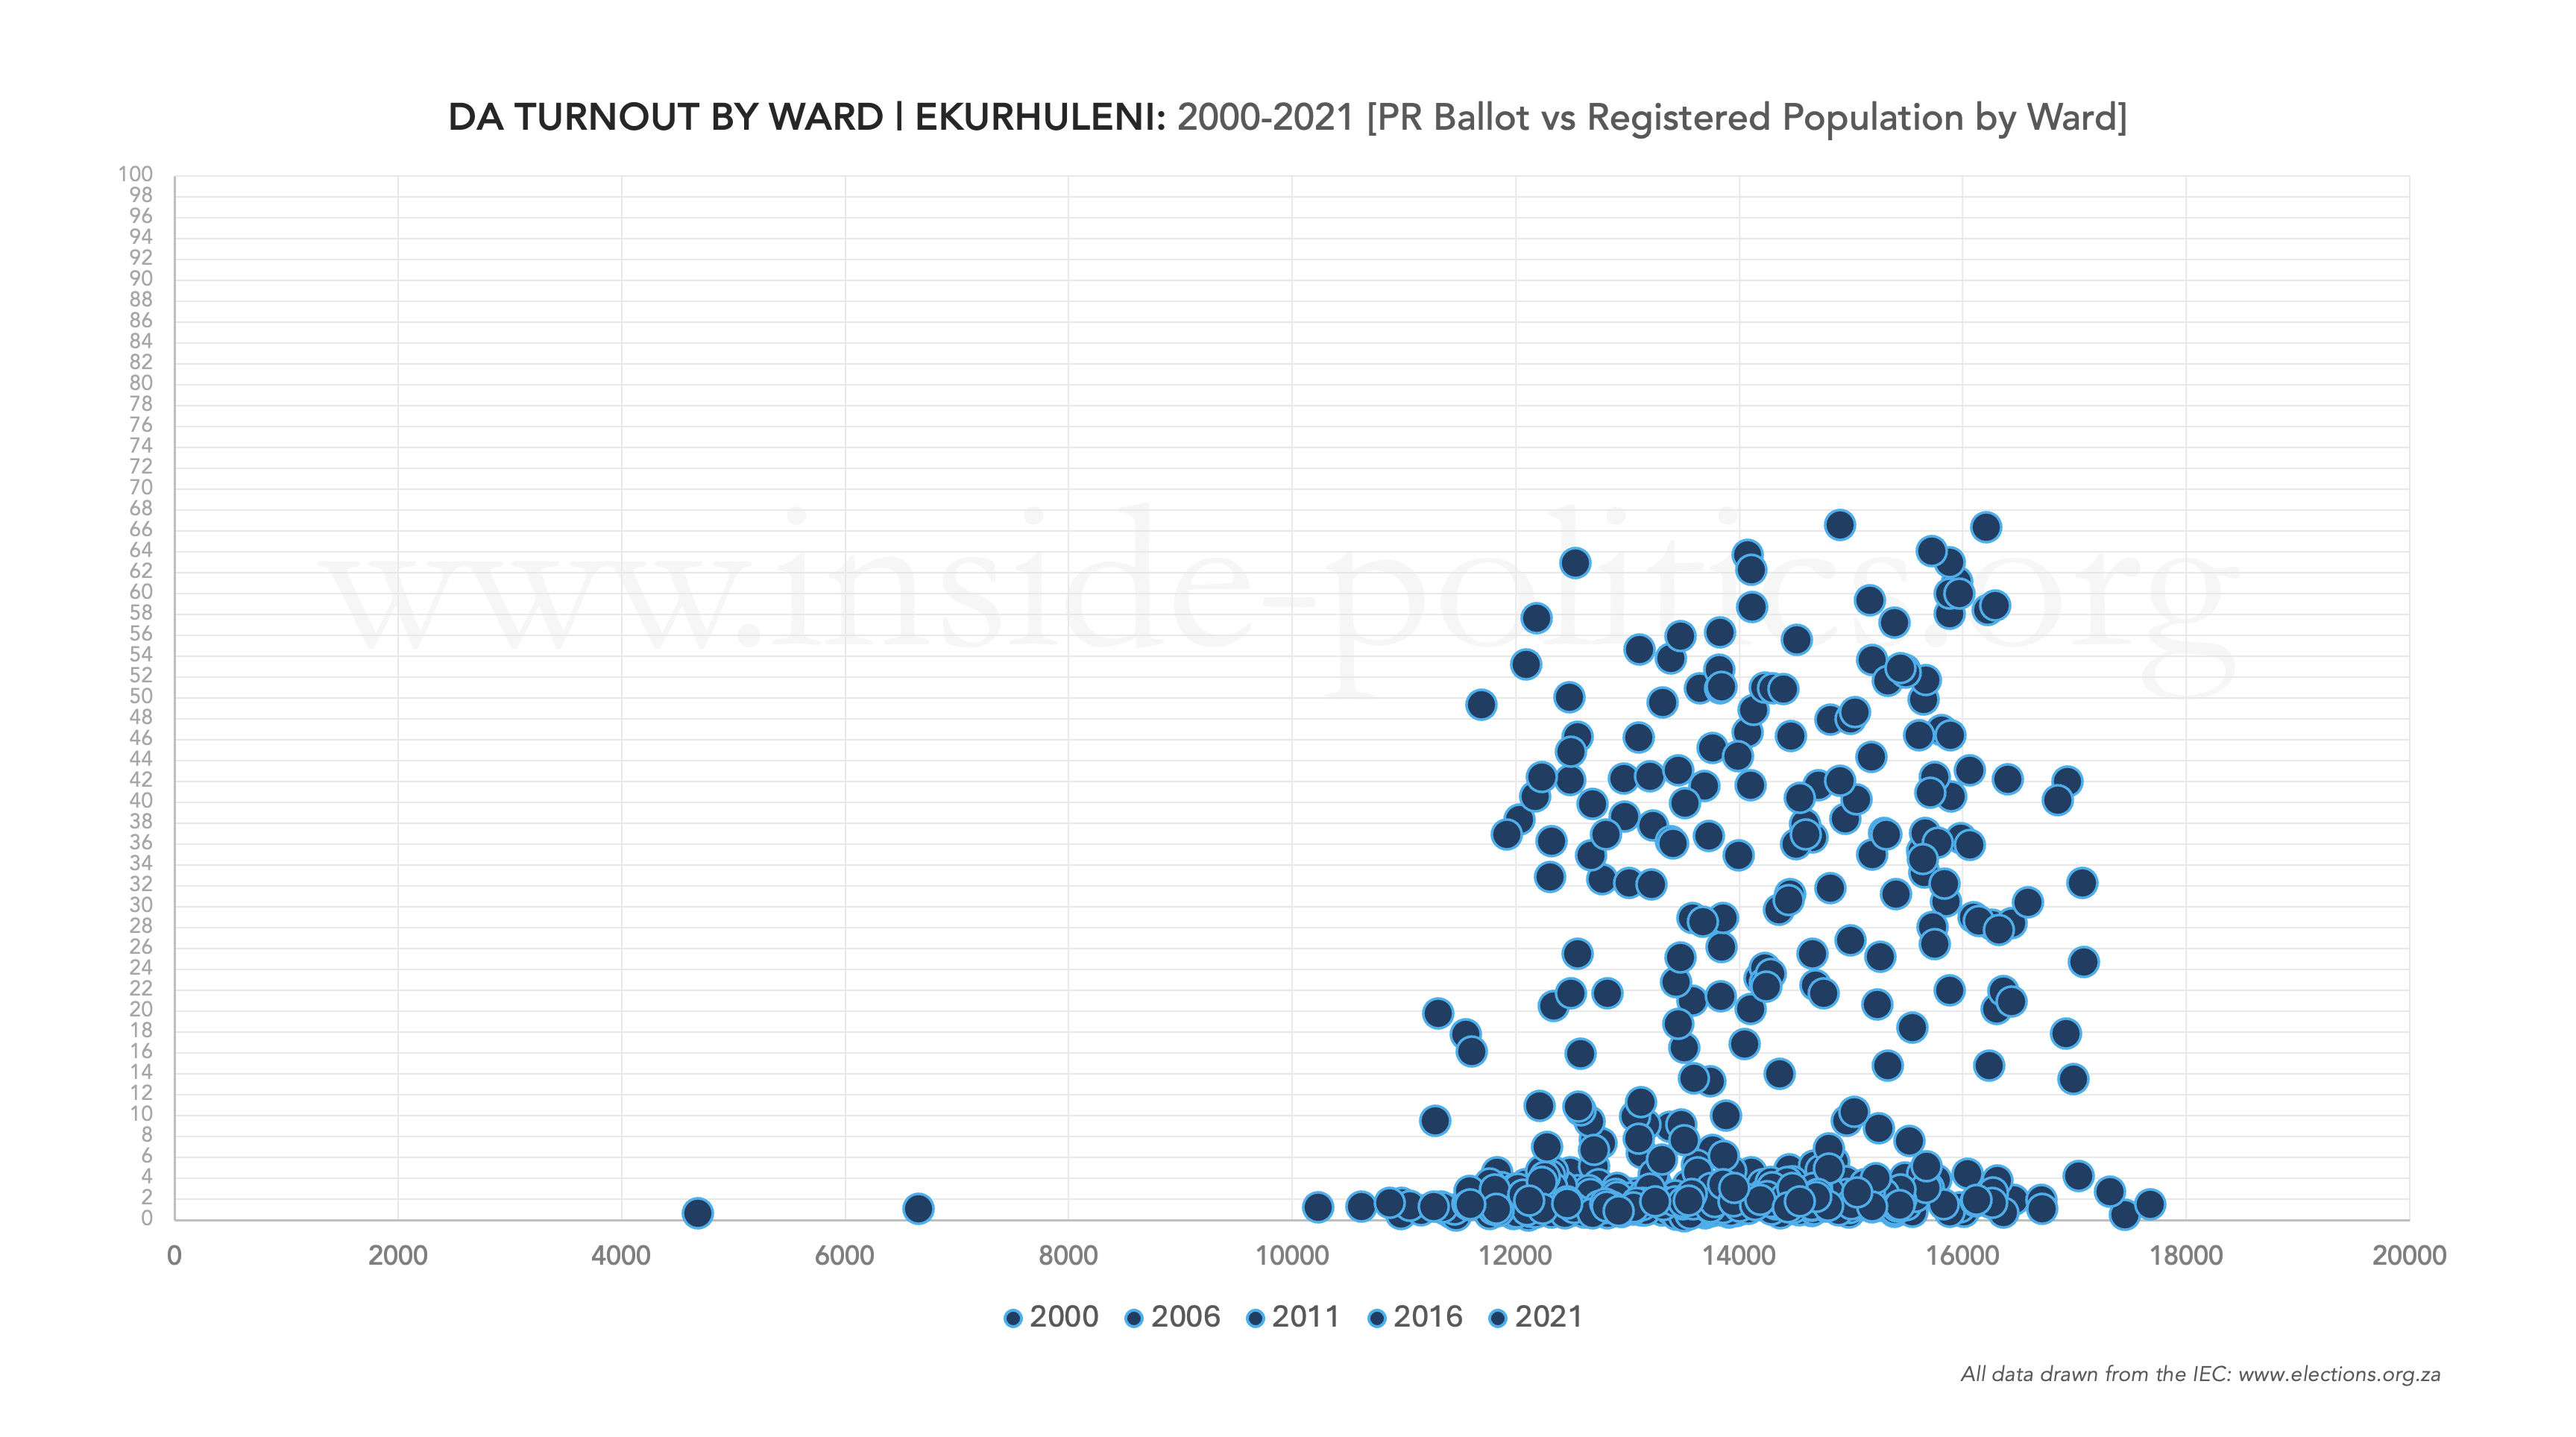
The fundamental difference between it and the ANC is the huge clump of wards at the bottom, lying on or just above the 0% mark. So, as with other Gauteng metros, the DA relies on an above average performance in a select number of strong DA wards to generate its total.
As with the ANC, here is a good (2011) and bad (2021) election for the DA in Ekurhuleni.

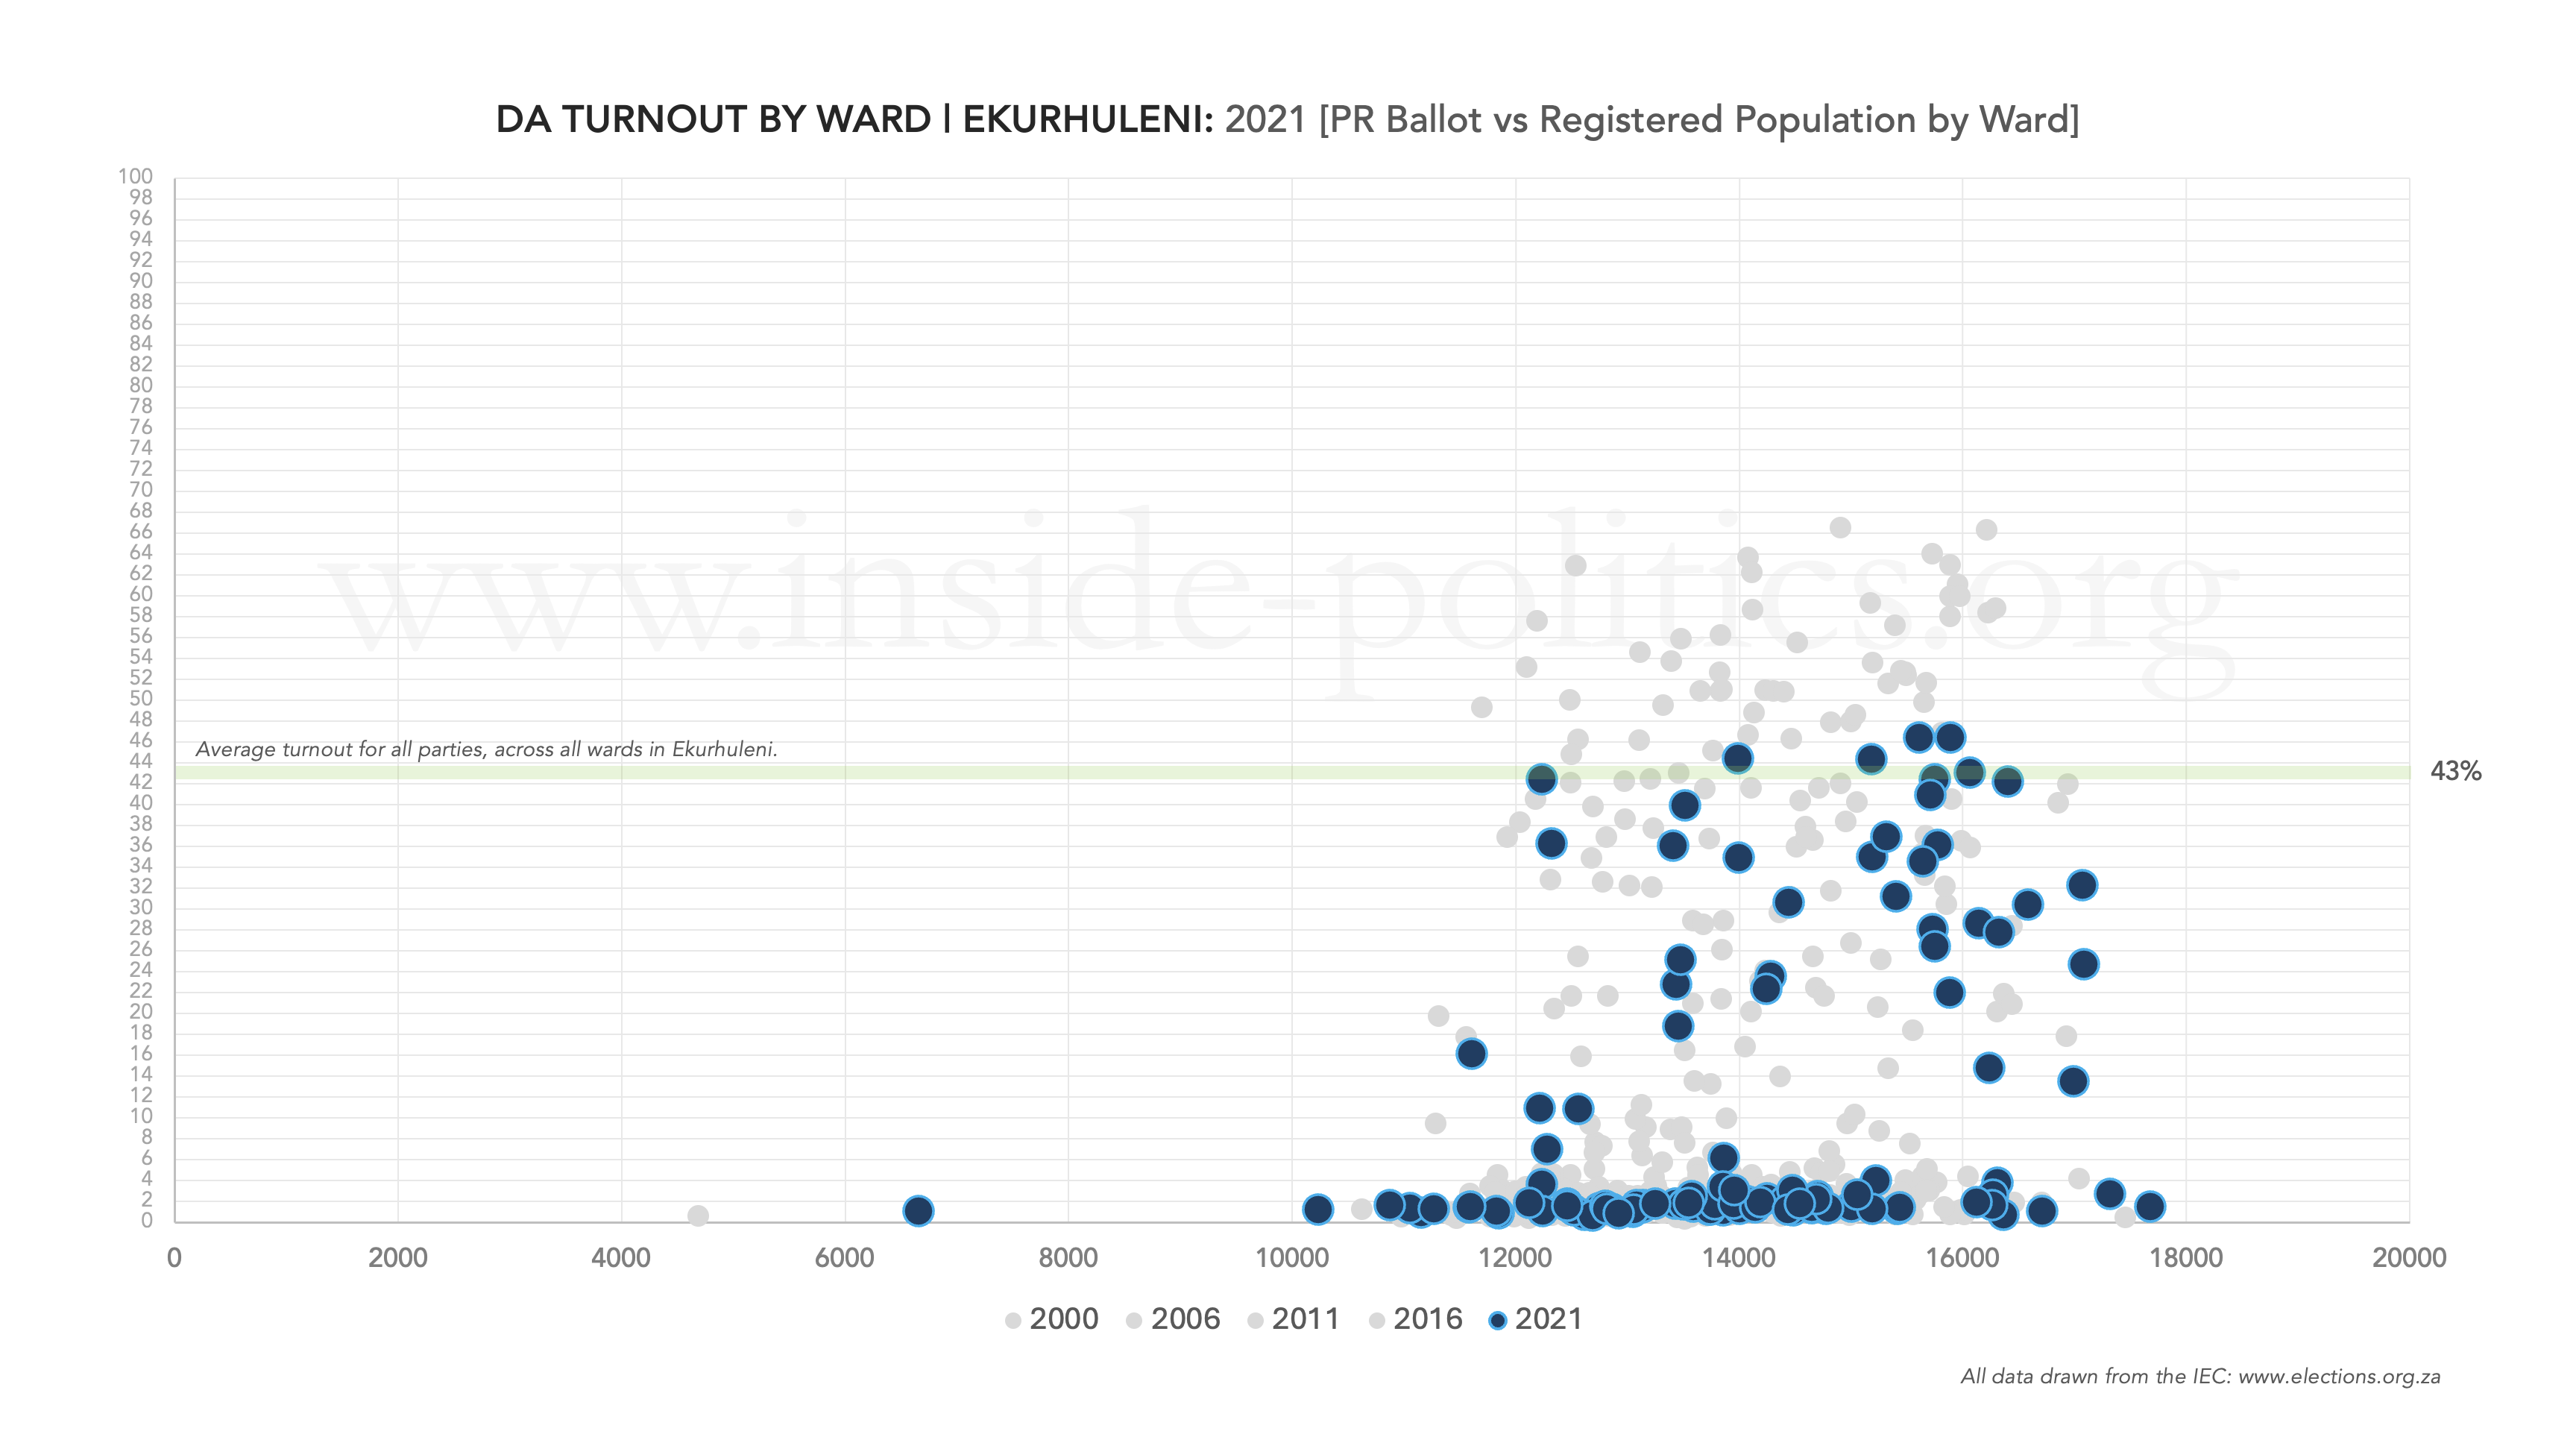
The pattern for both is the same – a number of wards on or about the turnout average – but in 2021 this means much less, because the average itself dropped a staggering 15pts. So lower turnout hurt the DA almost as much as it did the ANC.
Trade-offs
There is one final way of demonstrating good and bad elections for both the ANC and the DA. And that is to see how the votes of each party are affected by the performance of the other. If ANC votes go up, do DA votes go down?
To do this we again need to plot every ward as a dot on a grid. But, in this case, each dot represents the change in support. If the ANC did well in the ward, the dot moves up. If the DA did well, the dot moves to the right. In this way, we can split the chart into four quadrants:
- Q1 (top left): ANC up, DA down
- Q2 (top right): ANC up, DA up
- Q3 (bottom left): ANC down, DA down
- Q4 (bottom right): ANC down, DA up
So, from the ANC’s perspective, a good election is when a large number of dots are in Q1 (ANC up, DA down). From the DA’s perspective, a good election is when a large number of dots are in Q4 (ANC down, DA up). And from both parties’ perspective, the place you don’t want to be is Q3 (ANC down, DA down).
Because wards change, we can’t run this for all election years (you need consistent wards between elections to see the change), but we can run it for 2000 to 2006 (88 identical wards in both), 2011 to 2016 (101) and 2016 to 2021 (112). If we do that, we get the following three graphs:

2006 represents a good election for both the ANC and the DA, with a significant number of wards in Q1 (ANC up, DA down) and Q4 (ANC down, DA up).
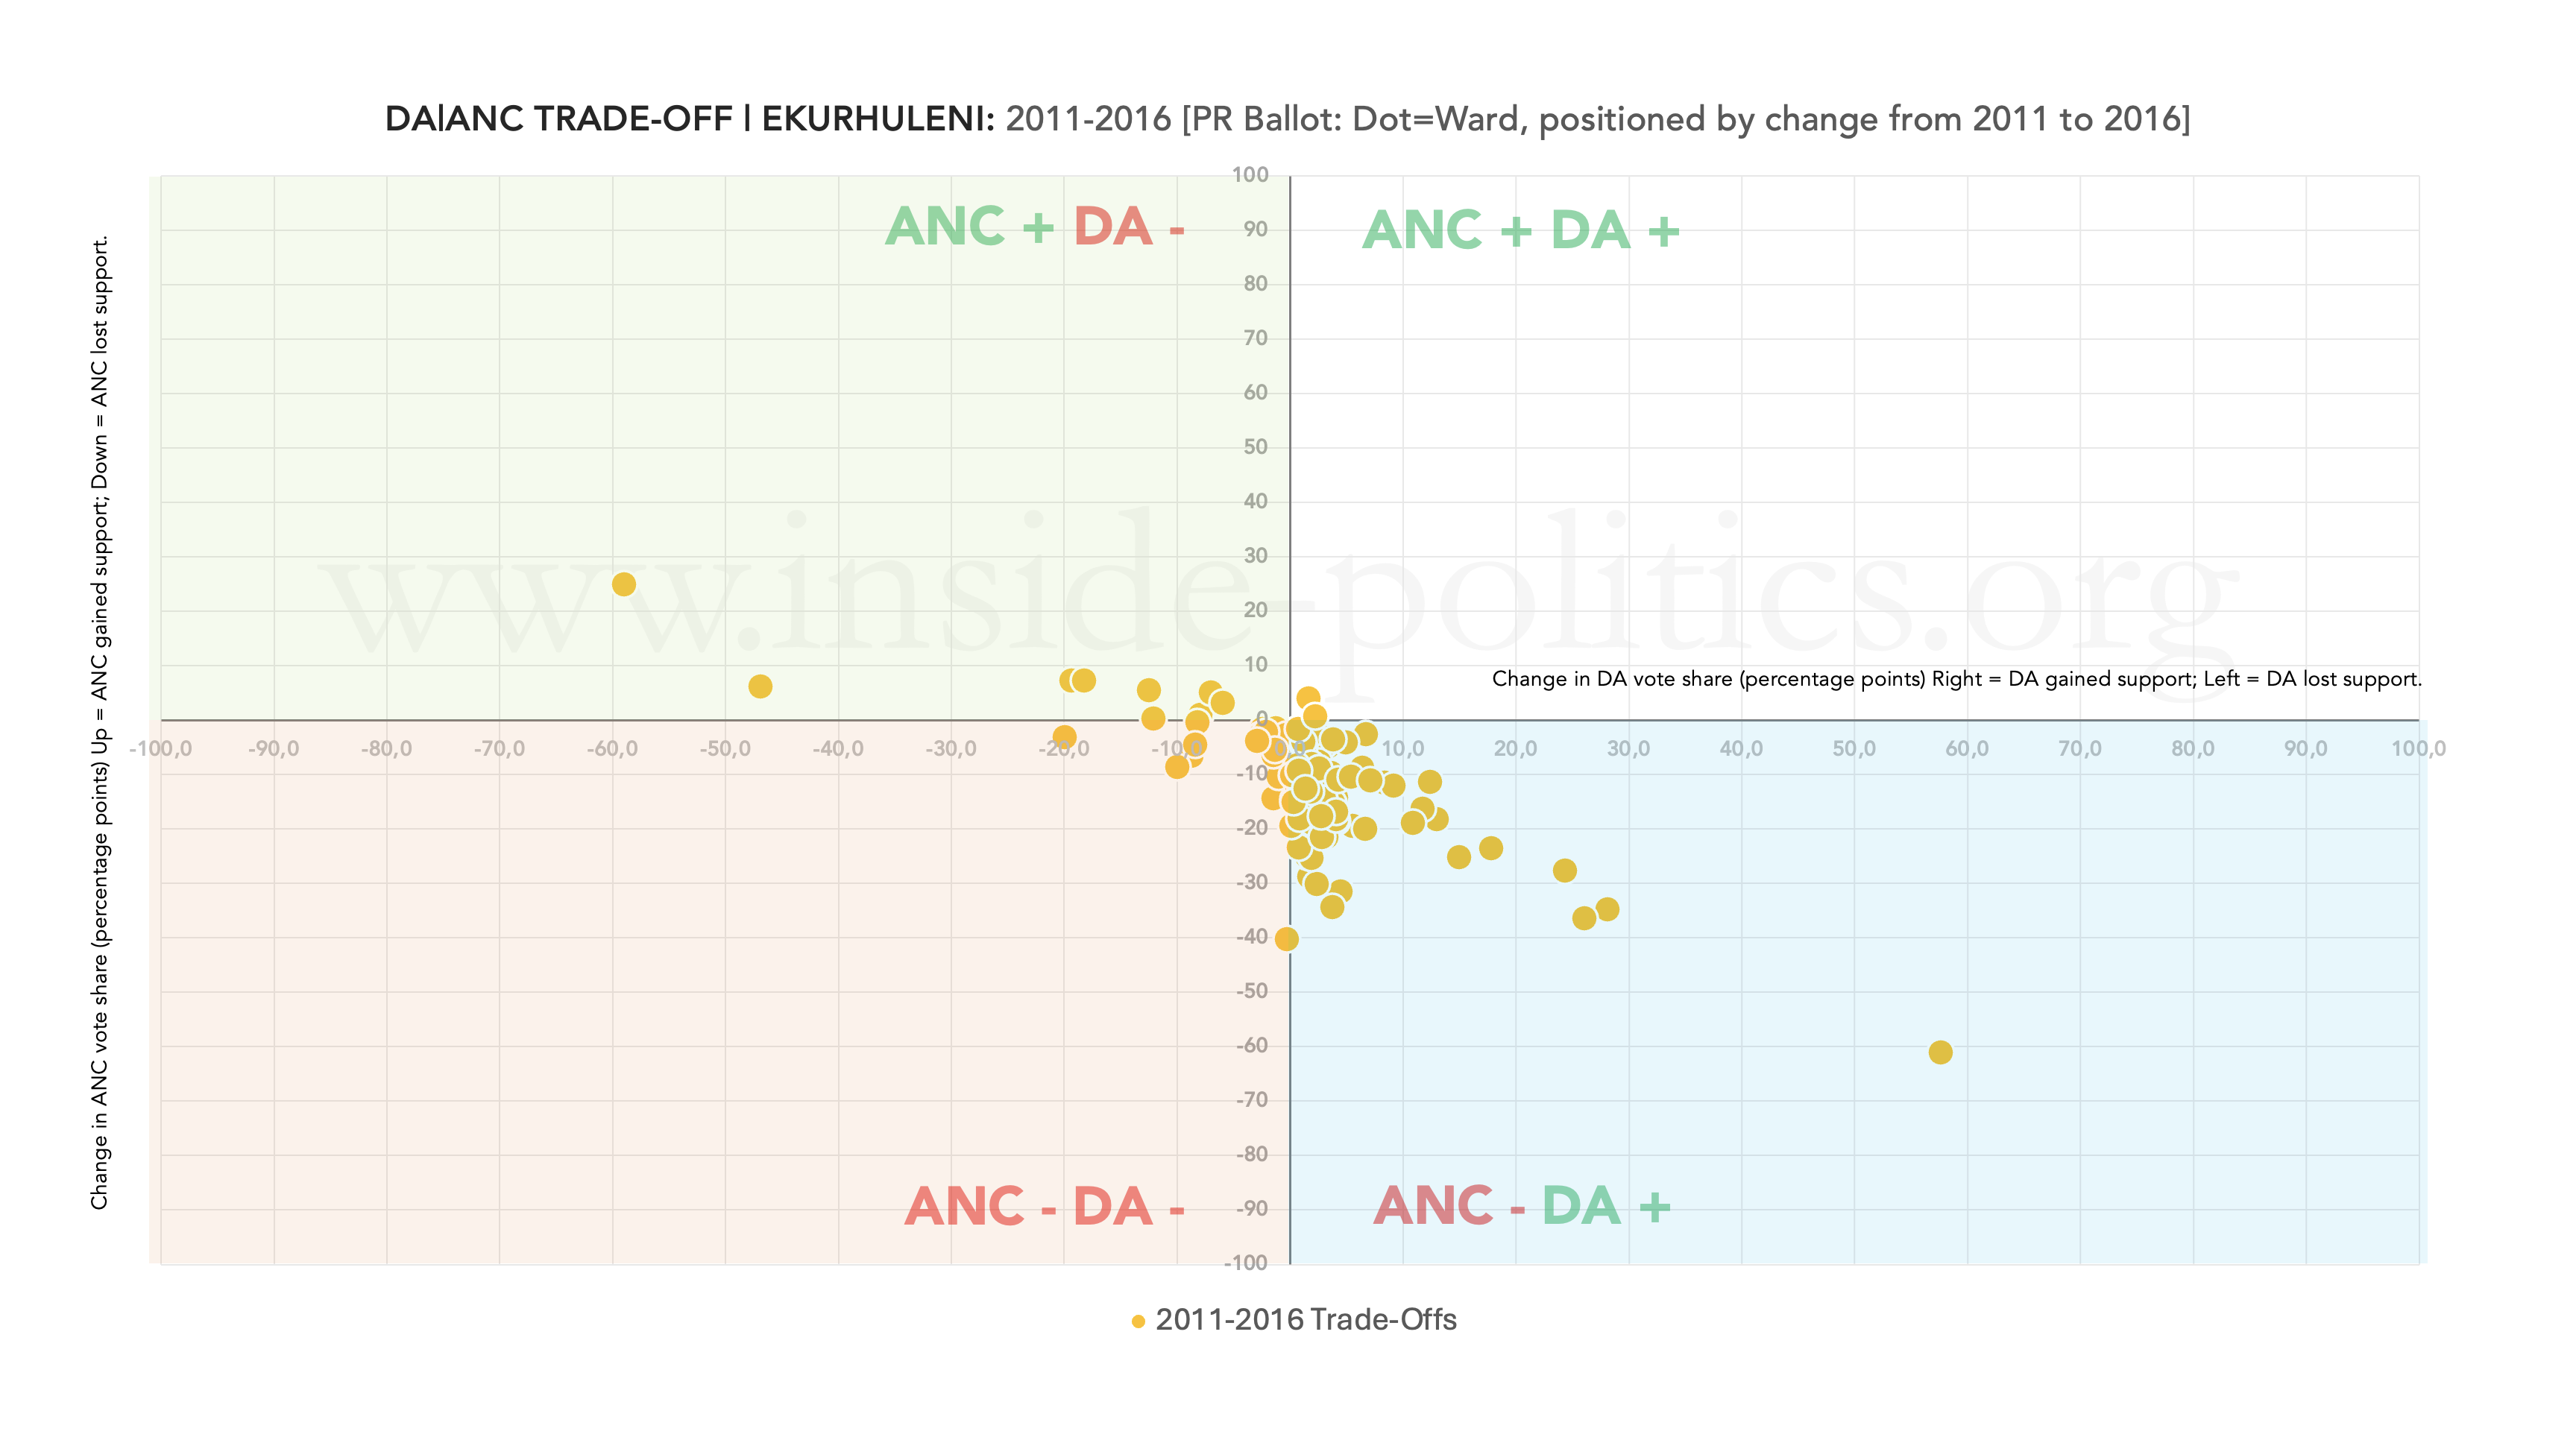
2016 represents a stable election for both the ANC and the DA, with most dots hovering in the centre, illustrating no real change.

2021 represents a bad election for both parties, with a significant number of wards in Q3 (ANC down, DA down).
Conclusion
The trends that define Ekurhuleni are similar to those that define Johannesburg and Tshwane: a marked decline in turnout, a significant decline in ANC support and the plateauing of the DA local election performance in 2021, reducing its ability to take full advantage of the ANC’s implosion.
However, there are several distinctive insights:
- There are several indications that the ANC’s decline in Ekurhuleni is now exponential not steady. Of these, the decimation of its provincial support in 2024 is the most significant. It leaves the ANC with a greatly reduced core support base in the metro, and the prospect of even lower turnout to come.
- Despite a decline in the vote share for both parties, the DA did retain something of a local election “bump” in 2021. Given the ANC’s exponential decline, if it can manage something similar, even if small, it will make a profound difference to its prospects.
Ekurhuleni was, for a long period, the ANC’s urban stronghold in Gauteng. But, it seems to have cracked and, not just partially, but wide open. There are, as with the other metros, other factors at play – other political parties like the EFF in particular, and MK, which has yet to be tested at local level – but whatever else has impacted on the ANC’s vote share, one thing is certain: Ekurhuleni, once a fortress, is now an open field.
This essay is the 3rd in an on-going series on Election 2026/7, for all other editions of this series, please click here: Election 2026/7
Discover more from inside politics
Subscribe to get the latest posts sent to your email.

http://www.directdemocracy.org.za