
Election 2026/7 [4] Turnout, eThekwini, the ANC and DA
by The Editor

A comprehensive look at turnout trends in eThekwini, with a focus on the ANC and DA. eThekwini is arguably South Africa’s most dramatic metro: broad competition, huge swings in support and thus, a very volatile political landscape. And it is in the middle of exactly such an upheaval with, it seems, much more to come.
Turnout, eThekwini, the ANC and DA
By: Gareth van Onselen
Follow @GvanOnselen
14 October 2025
This essay is the 4th in an on-going series on Election 2026/7, for all other editions of this series, please click here: Election 2026/7
Introduction
This is the fourth essay in a series of in-depth, statistically driven analytical essays on the upcoming local government elections (to be held at some point between November 2026 and January 2027). Following our look at Johannesburg, Tshwane and Ekurhuleni, this essay focuses on eThekwini.
Ultimately, we will look at all eight metros, before moving on to some consolidated national analysis. Next we will look at Mangaung.
eThekwini is the most complex, and volatile, of all the metros. Three factors contribute to this. First, competition is at its peak here, with several substantial parties. Second, flowing from this, it is incredibly dynamic, with dramatic shifts in the landscape. Third, newer parties – particularly MK and, to a lesser degree, the EFF – are wholly or relatively untested at local level, making comparative analysis difficult.
To this end, as with the other essays, this particular analysis will focus on the ANC and DA. I will explore all these other factors in separate essays, at a later stage. For now, we want to establish a series of consistent, core baseline statistics for South Africa’s two biggest political parties across all eight metros.
A final introductory note: I have created a “Resources” page for the 2026/7 elections. It contains all the key indicators covered in these essays, and will be greatly expanded upon down the line. With time, I hope it will become a very powerful and substantial archive of election material for the public, as we seek to understand the upcoming local government elections. Give it a look and see what you think.
Turnout: eThekwini
The graph below sets out the provincial and local election turnout results for eThekwini. It is a pattern we are now familiar with, with dramatic shifts between provincial and local government election turnout. In turn, as with other metros, local turnout is in decline, down from 59.1% in 2016 to 41.5% in 2021 (a staggering 17.6pt drop).
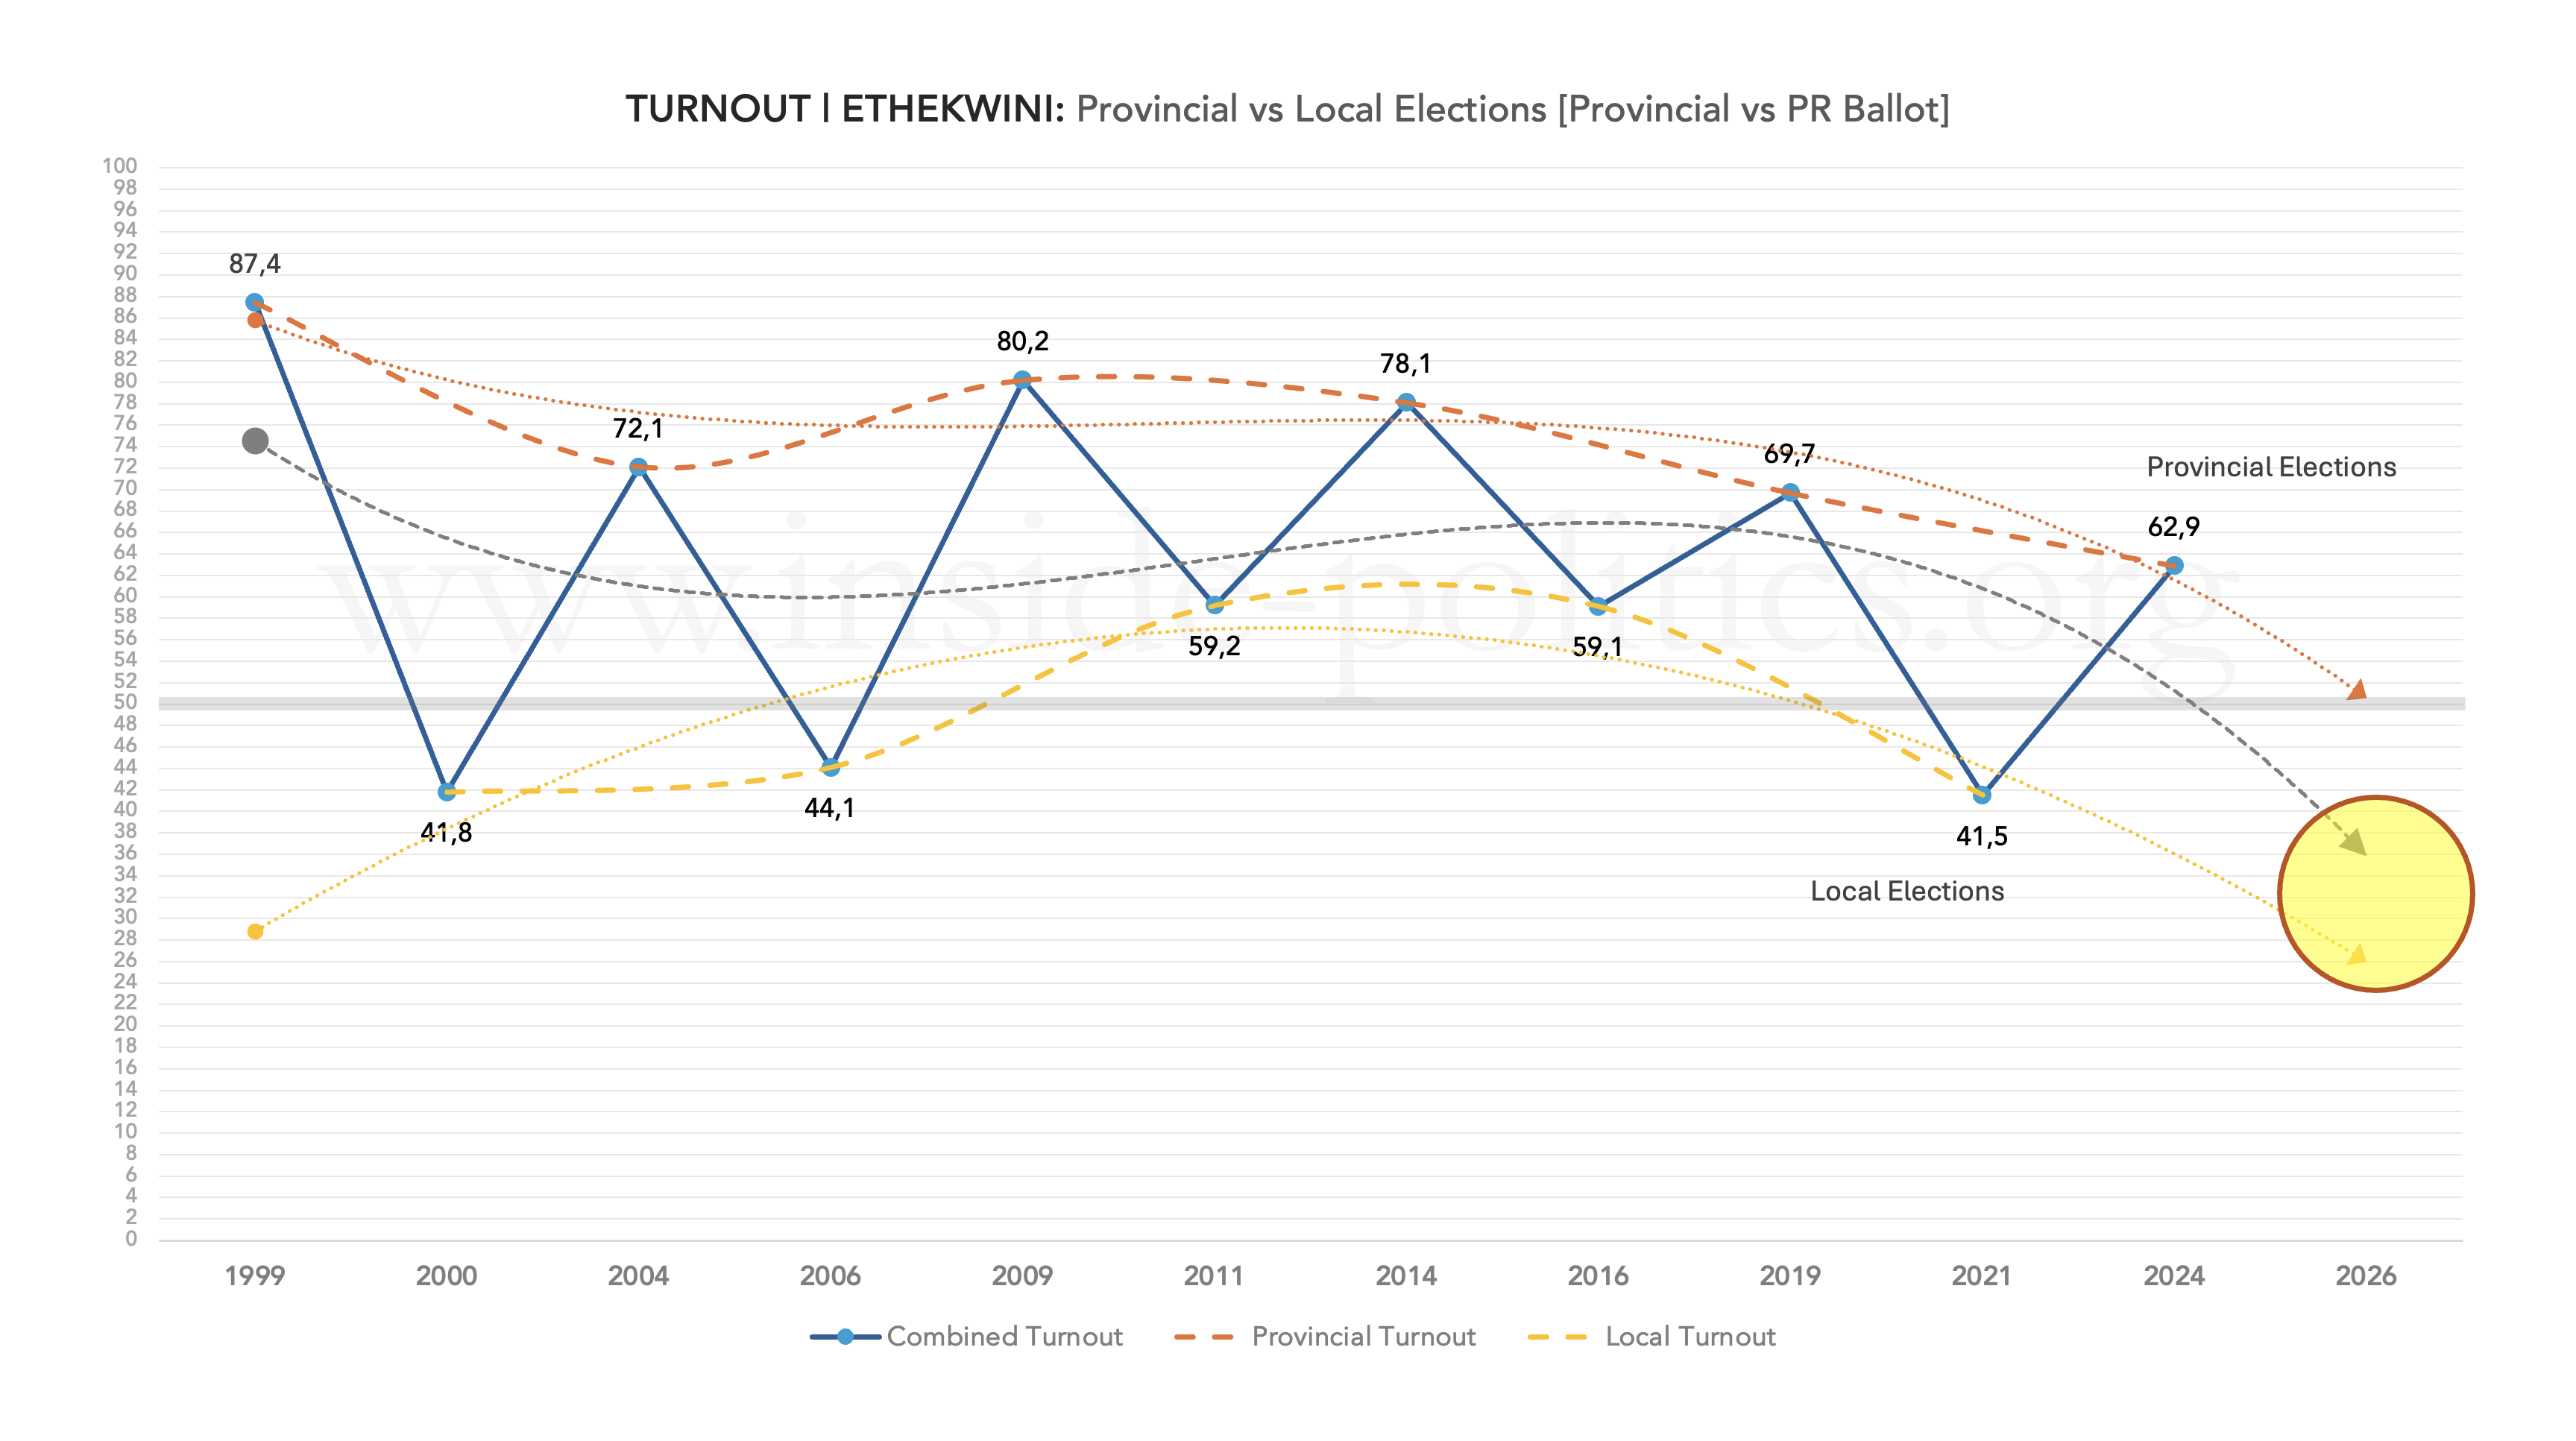
Both the general (combined provincial and local) and local elections specific trendline suggest a further drop in 2026/7, towards the 30–40% bracket range. 41.5% was already an all-time low for the metro, and so that record too, looks more likely than not to be beaten, and significantly so.
As before, this is a significant problem for the ANC’s performance which, as the biggest political party, is intricately linked to general turnout trends. But, unlike other metros, that particular problem is now a mere afterthought for the ANC in eThekwini, to the extent that it is almost redundant. The ANC’s primary problem, amidst a raft of crises, is MK — in 2024, it almost wiped the ANC off the map in eThekwini, as the graph below illustrates.

That is one of the most dramatic graphs you will see in this series. For an ANC vote share that tends to change as if wading through molasses, it is truly remarkable: total and instantaneous collapse. The ANC is now smaller in eThekwini than it is in Cape Town, and that is saying something. Its decline, from a peak of 66.3% in 2009, to an all-time low of 14.4% in 2024, represents a drop of 51.9pts.
It is distinctive in another way. If you look at the dot at 2021, where the ANC’s green vote share meets the blue turnout line, from that point onwards the two diverge like a gaping jaw, the blue shooting up, and the green shooting down. In all Gauteng metros, the ANC line moves up, closing the jaw, and reducing the gap. In eThekwini the ANC is now so far removed from turnout that it might as well be a start-up party, the fundamental goal of which is just to exist, rather than worry about such things as differential turnout.
(As a side note: it might well be possible for the ANC bounce back somewhat from its 2024 performance, but it will most likely be on the margins if it does. Regardless, this represents a fundamental brand problem for the ANC, as much as it does a practical power one. The ANC has always relied on being “big”, in messaging, tone and posture. Now it is indisputably small — uncharted territory for the party; we shall have to see if it can adapt).
The graph below – a cumulative combination of ANC metro performances – puts the ANC in eThekwini into its full perspective.

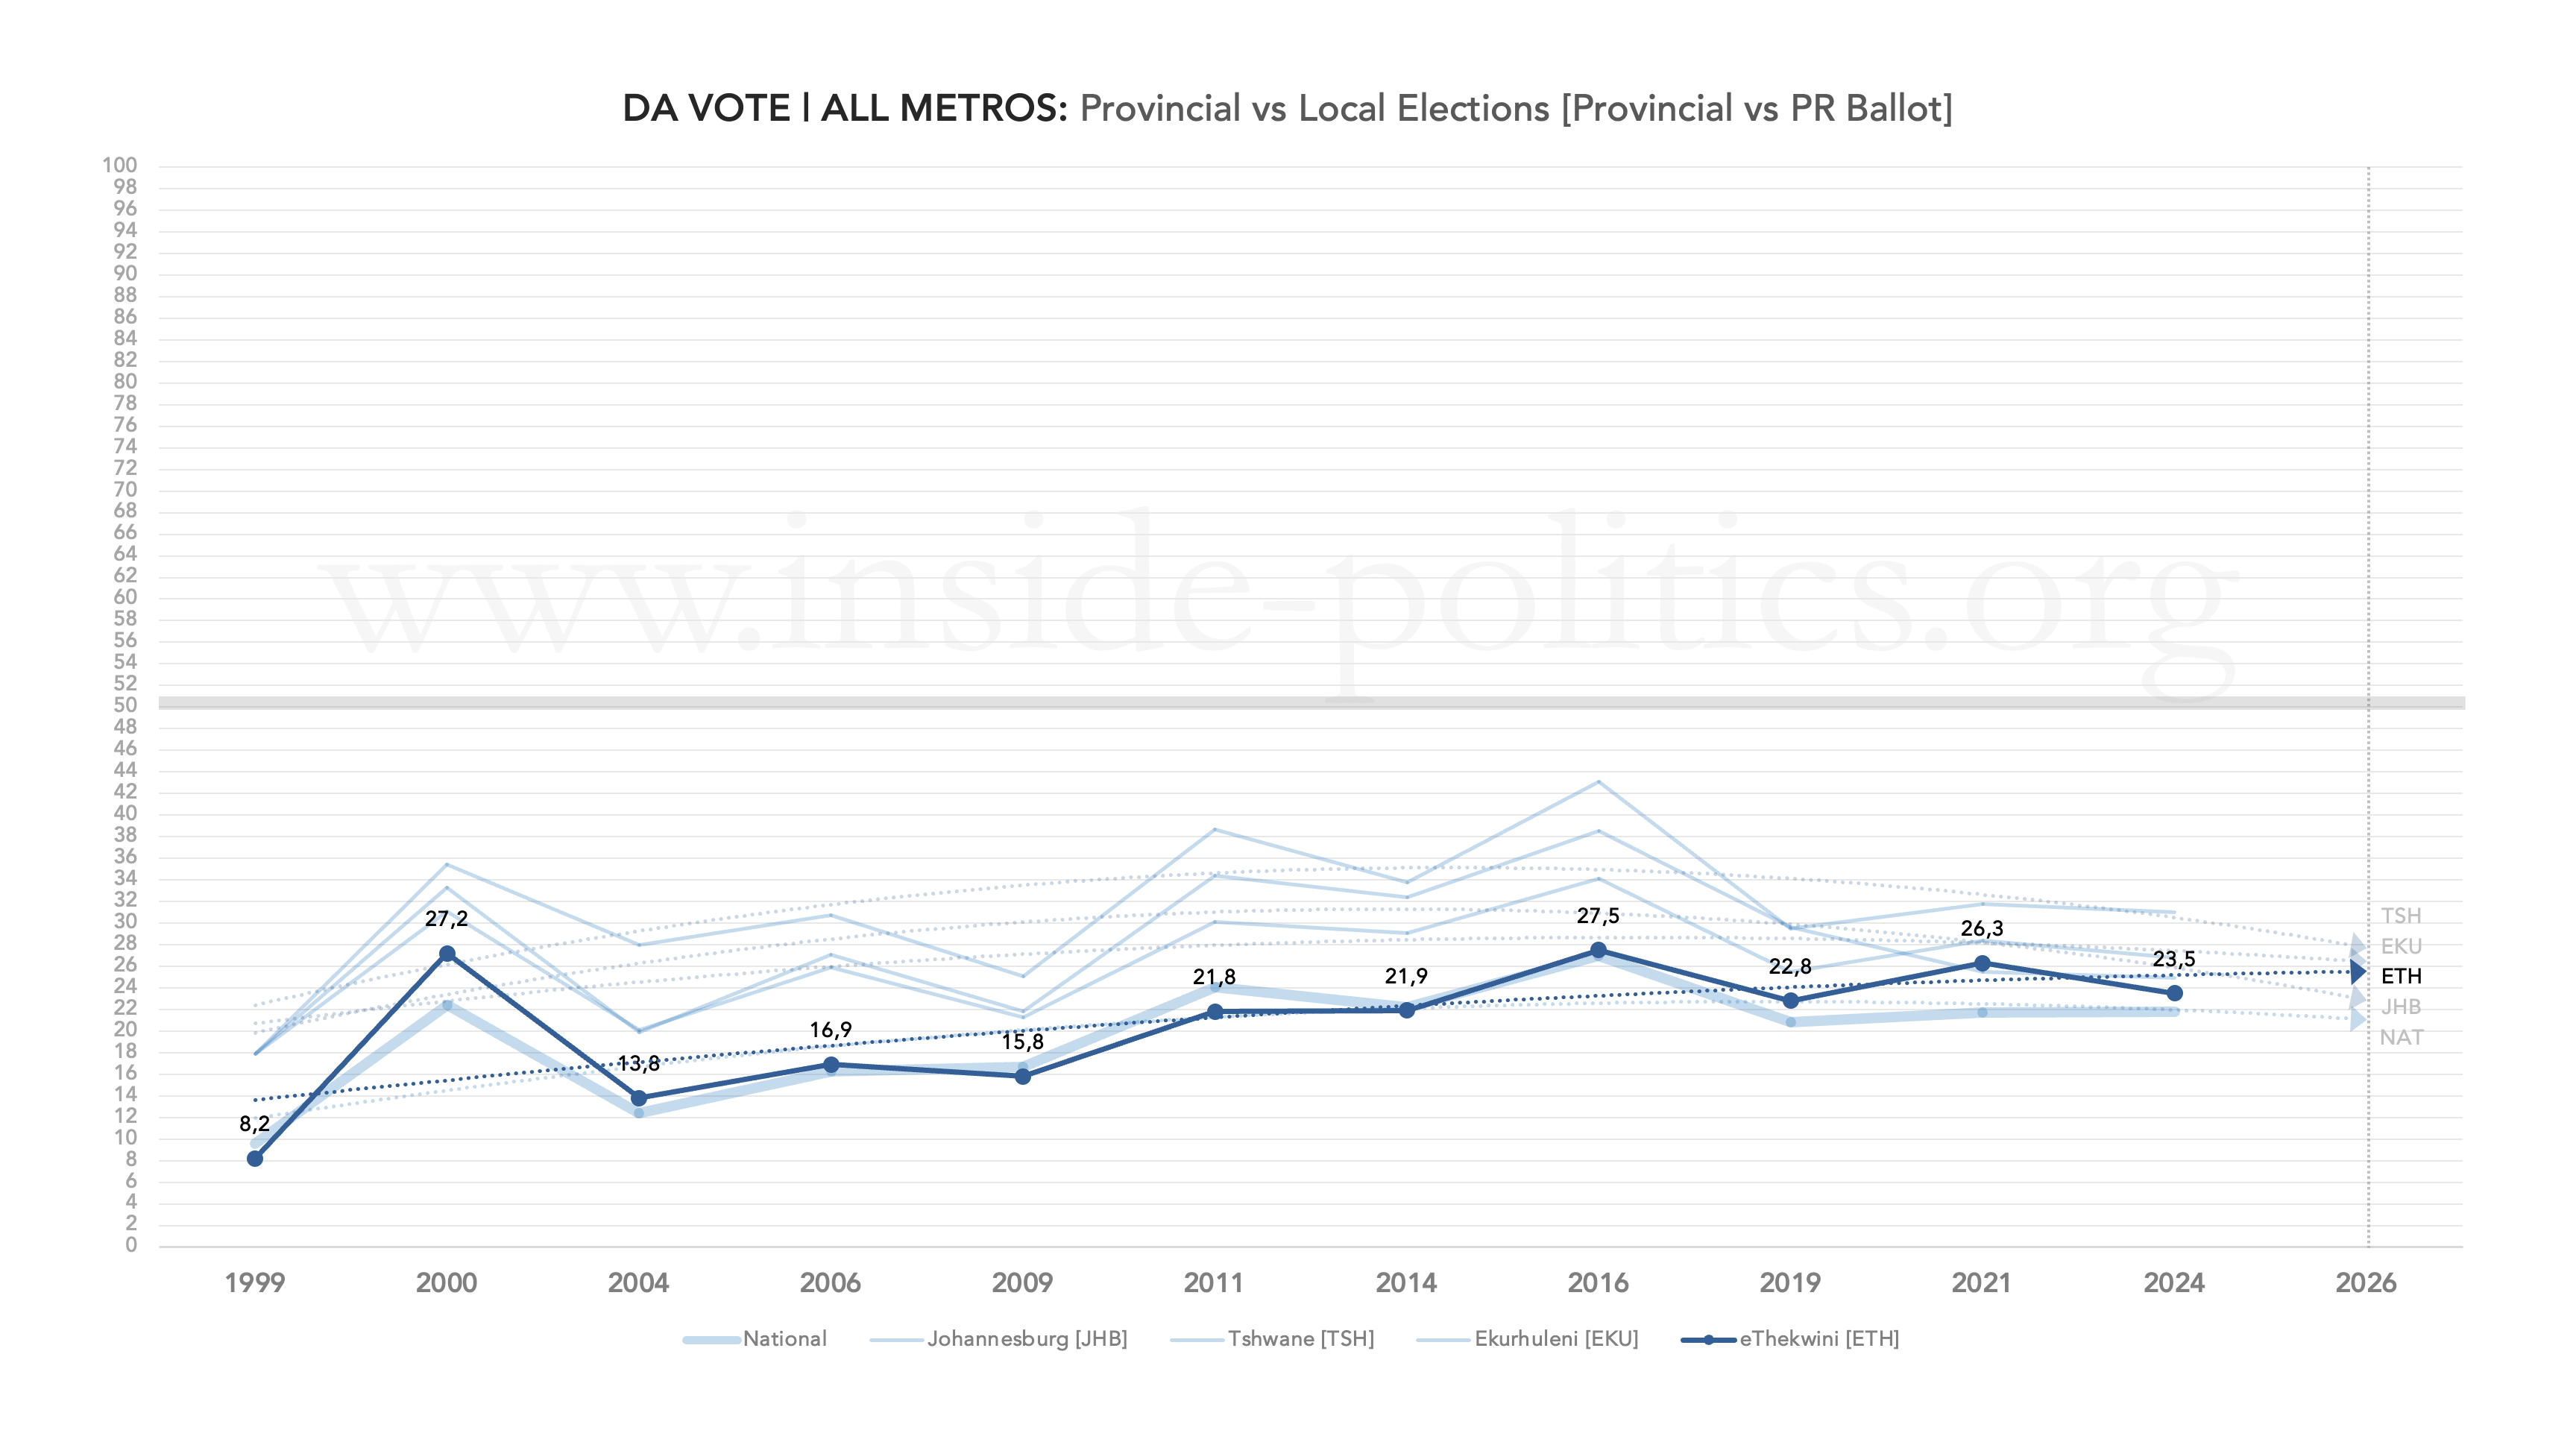
Turning to the DA, in the graph below. Its vote share represents a steady but gradual improvement over time. Since 2004, it has grown from 13.8% to 23.5% in 2024. A hard-fought average of 0.5pts per year. It is currently below its peak performance (of 27.5% in 2016) and although it dropped marginally in 2021, to 26.3%, that 1.2pt decline represents a far better performance than any of the Gauteng metros (where it is down 13pts in Johannesburg from 2016 to 2021; down 11.3pts in Tshwane, and down 5.7pts in Ekurhuleni).

The DA has also managed a consistent but small set of local election “bumps” (the blue circles) as it has capitalised on disproportionate turnout in local elections.
- 2009–2011: gained 6.0pts
- 2014–2016: gained 5.6pts
- 2019–2021: gained 3.5 pts
That “bump” is declining in size, but is still bigger than in any Gauteng metro (-4pts in Johannesburg in 2021, 2.3pts in Tshwane, 2.9pts in Ekurhuleni) and if the DA can replicate it, it will pull even further away from the ANC.
Setting out all the DA’s metro performances we have covered to date (below), it is remarkable what a tight band they all form, suggesting a very particular – and perhaps narrow – electoral market, in which the DA operates.
The graph below sets out the turnout differential (between the provincial and PR ballot) for the ANC and the DA. While it doesn’t account for the ANC’s 2024 implosion, its yawning decline in local elections is already evident.

Plotting both the ANC and DA vote share in eThekwini on a single graph (below) reveals not only that the ANC is below the DA (and MK, which doesn’t feature here) but that 2024 left a significant gap between the two: 9.1pts. The ANC’s first recovery objective will be to, at least, become the second biggest party in eThekwini. But it is a very tall order. Turnout is against it, as is the DA’s general performance over time (and which has been less affected by lower turnout than in Gauteng).

A ward-by-ward view of eThekwini turnout
Let us now turn to a more granular look at the ANC’s turnout performance in eThekwini over time. What follows below are a series of five scatter graphs that shows ANC turnout (the ANC’s PR vote divided by the total registered voting population) in every eThekwini ward, starting with a combined graph and then one for each of the last five local elections – 2000, 2006, 2011, 2016 and 2021 (every dot is a ward). The ANC’s turnout percentage runs up the Y-axis, and the size of the ward (in terms of registered voters) runs along the X-axis. So, what you want as a political party are dots up and towards the right-hand corner (big ward/high turnout).
However, rather than set out each graph individual, as I did in previous essays, I have turned them into a Timelapse, which saves space and which you can pause on any given year (also, the individual graphs are all available on the Resources page).
Those five graphs tell quite story: a surge in ANC support, in 2006 and 2011, as the dots move up and towards the right, then a plateau of sorts in 2016, before they move dramatically downwards in 2021. Both 2011 and 2016 were extremely good elections for the ANC. Very high turnout (59%) and a significant number of dots on or about the average turnout line. But 2021 was a relative disaster, ANC ward turnout collapsed well below the turnout average – which was significantly down itself – resulting in the party dropping a dramatic 16.6pts, and losing its majority (and remember, 2024 was still to come).
If we turn to the mirror graphs for the DA (below) a couple of points distinguish them from the party’s performance in Gauteng. First, in the DA’s most successful local elections, in 2011 and 2016, its ability to turn out strong DA wards typically results in a significant number of blue dots on or above the average turnout line. This is not the case in eThekwini.
That is not to say 2011 and 2016 were bad elections for the DA (2016 was its most successful yet) but it does suggest that the strongest DA wards in this metro are not as strong as their equivalents in Gauteng. The party has to work far, far harder here, and in a general environment where turnout is in decline, that makes capitalising on disproportionate turnout so much harder in turn.
2021, when turnout tanked for all political parties, does not reveal any fundamental collapse on the DA’s part (unlike the ANC), its spread represents it more or less the same pattern, but it is suppressed and it has to turn that around if it wants to grow significantly in 2026/7.
Trade-offs
Finally, looking at the relationship between the ANC and DA vote. If ANC votes go up, do DA votes go down?
A reminder: to do this we again need to plot every ward as a dot on a grid. But, in this case, each dot represents the change in support. If the ANC did well in the ward, the dot moves up. If the DA did well, the dot moves to the right. In this way, we can split the chart into four quadrants:
- Q1 (top left): ANC up, DA down
- Q2 (top right): ANC up, DA up
- Q3 (bottom left): ANC down, DA down
- Q4 (bottom right): ANC down, DA up
So, from the ANC’s perspective, a good election is when a large number of dots are in Q1 (ANC up, DA down). From the DA’s perspective, a good election is when a large number of dots are in Q4 (ANC down, DA up). And from both parties’ perspective, the place you don’t want to be is Q3 (ANC down, DA down).
Because wards change, we can’t run this for all election years (you need consistent wards between elections to see the change), but we can run it for 2000 to 2006 (100 identical wards in both), 2011 to 2016 (103) and 2016 to 2021 (110). If we do that, we get the following three graphs:

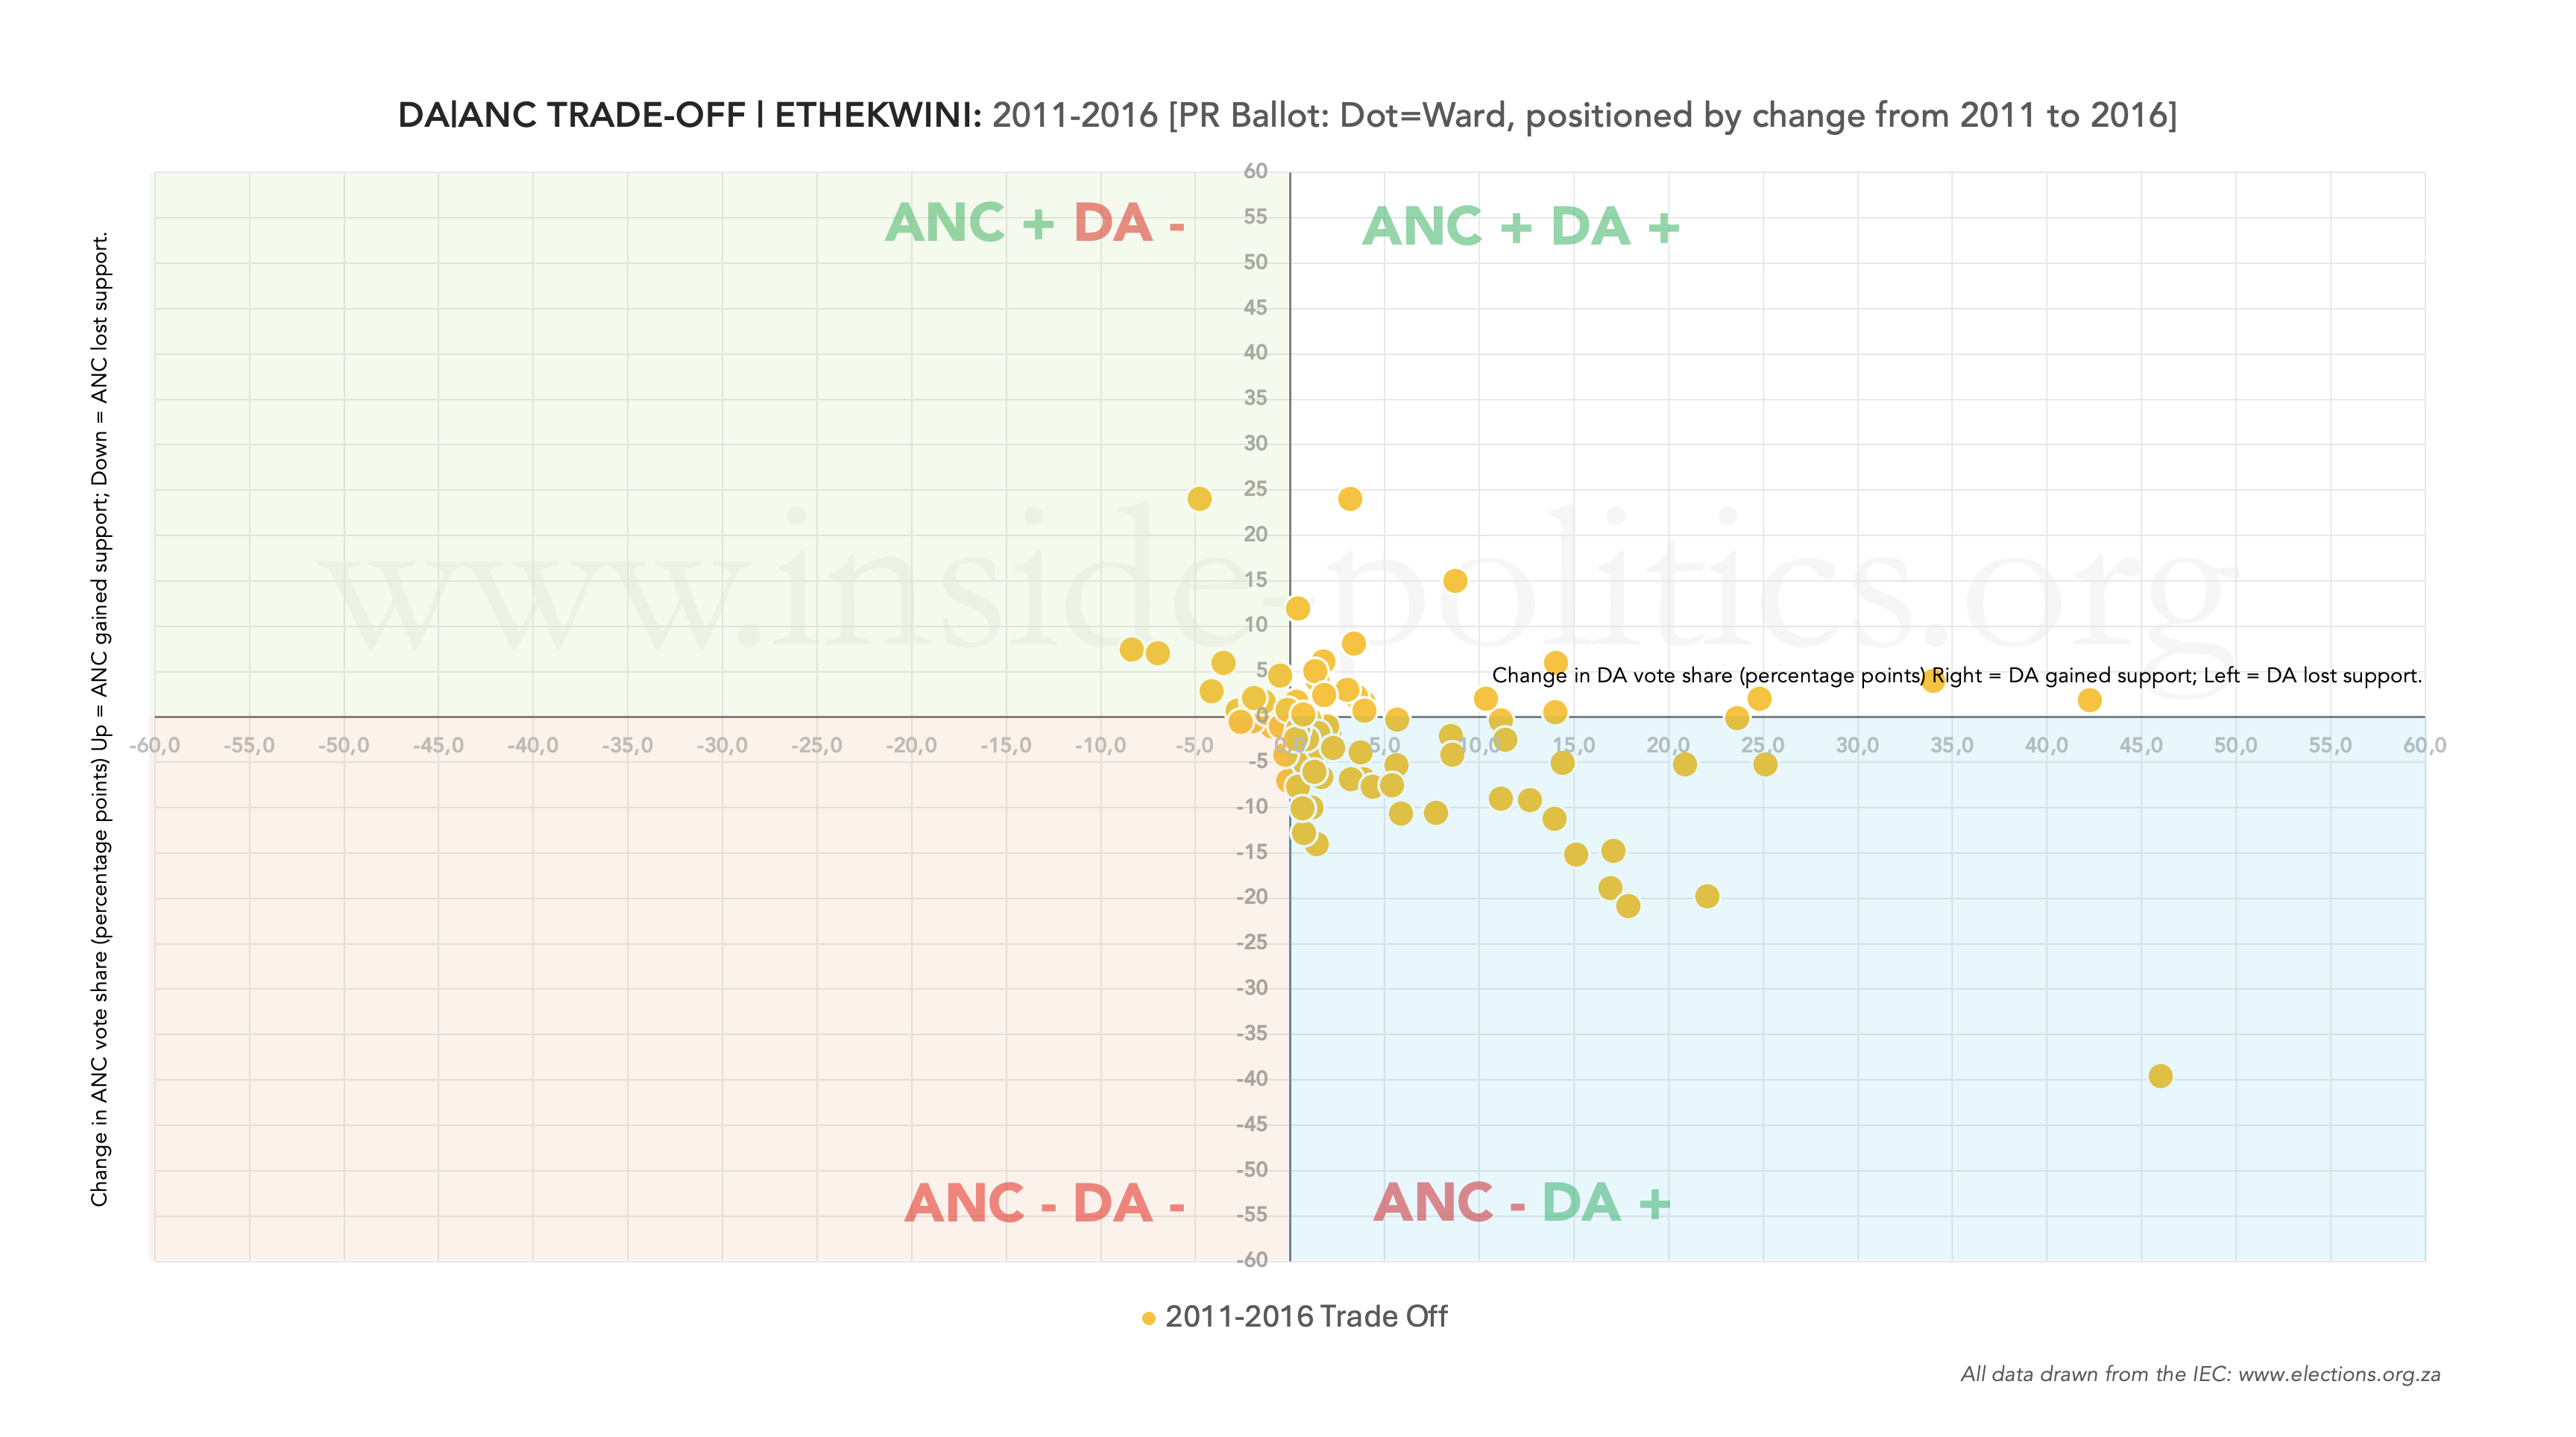
The relationship between ANC and DA votes here is weaker than for the Gauteng graph, because there are unseen forces at play (the IFP for 2000–2006, which was much weakened by the ANC, and the EFF for the latter too). Nevertheless, it does demonstrate that in 2006, as you can see, the surge in ANC support that would dominate for the next decade began to materialise.
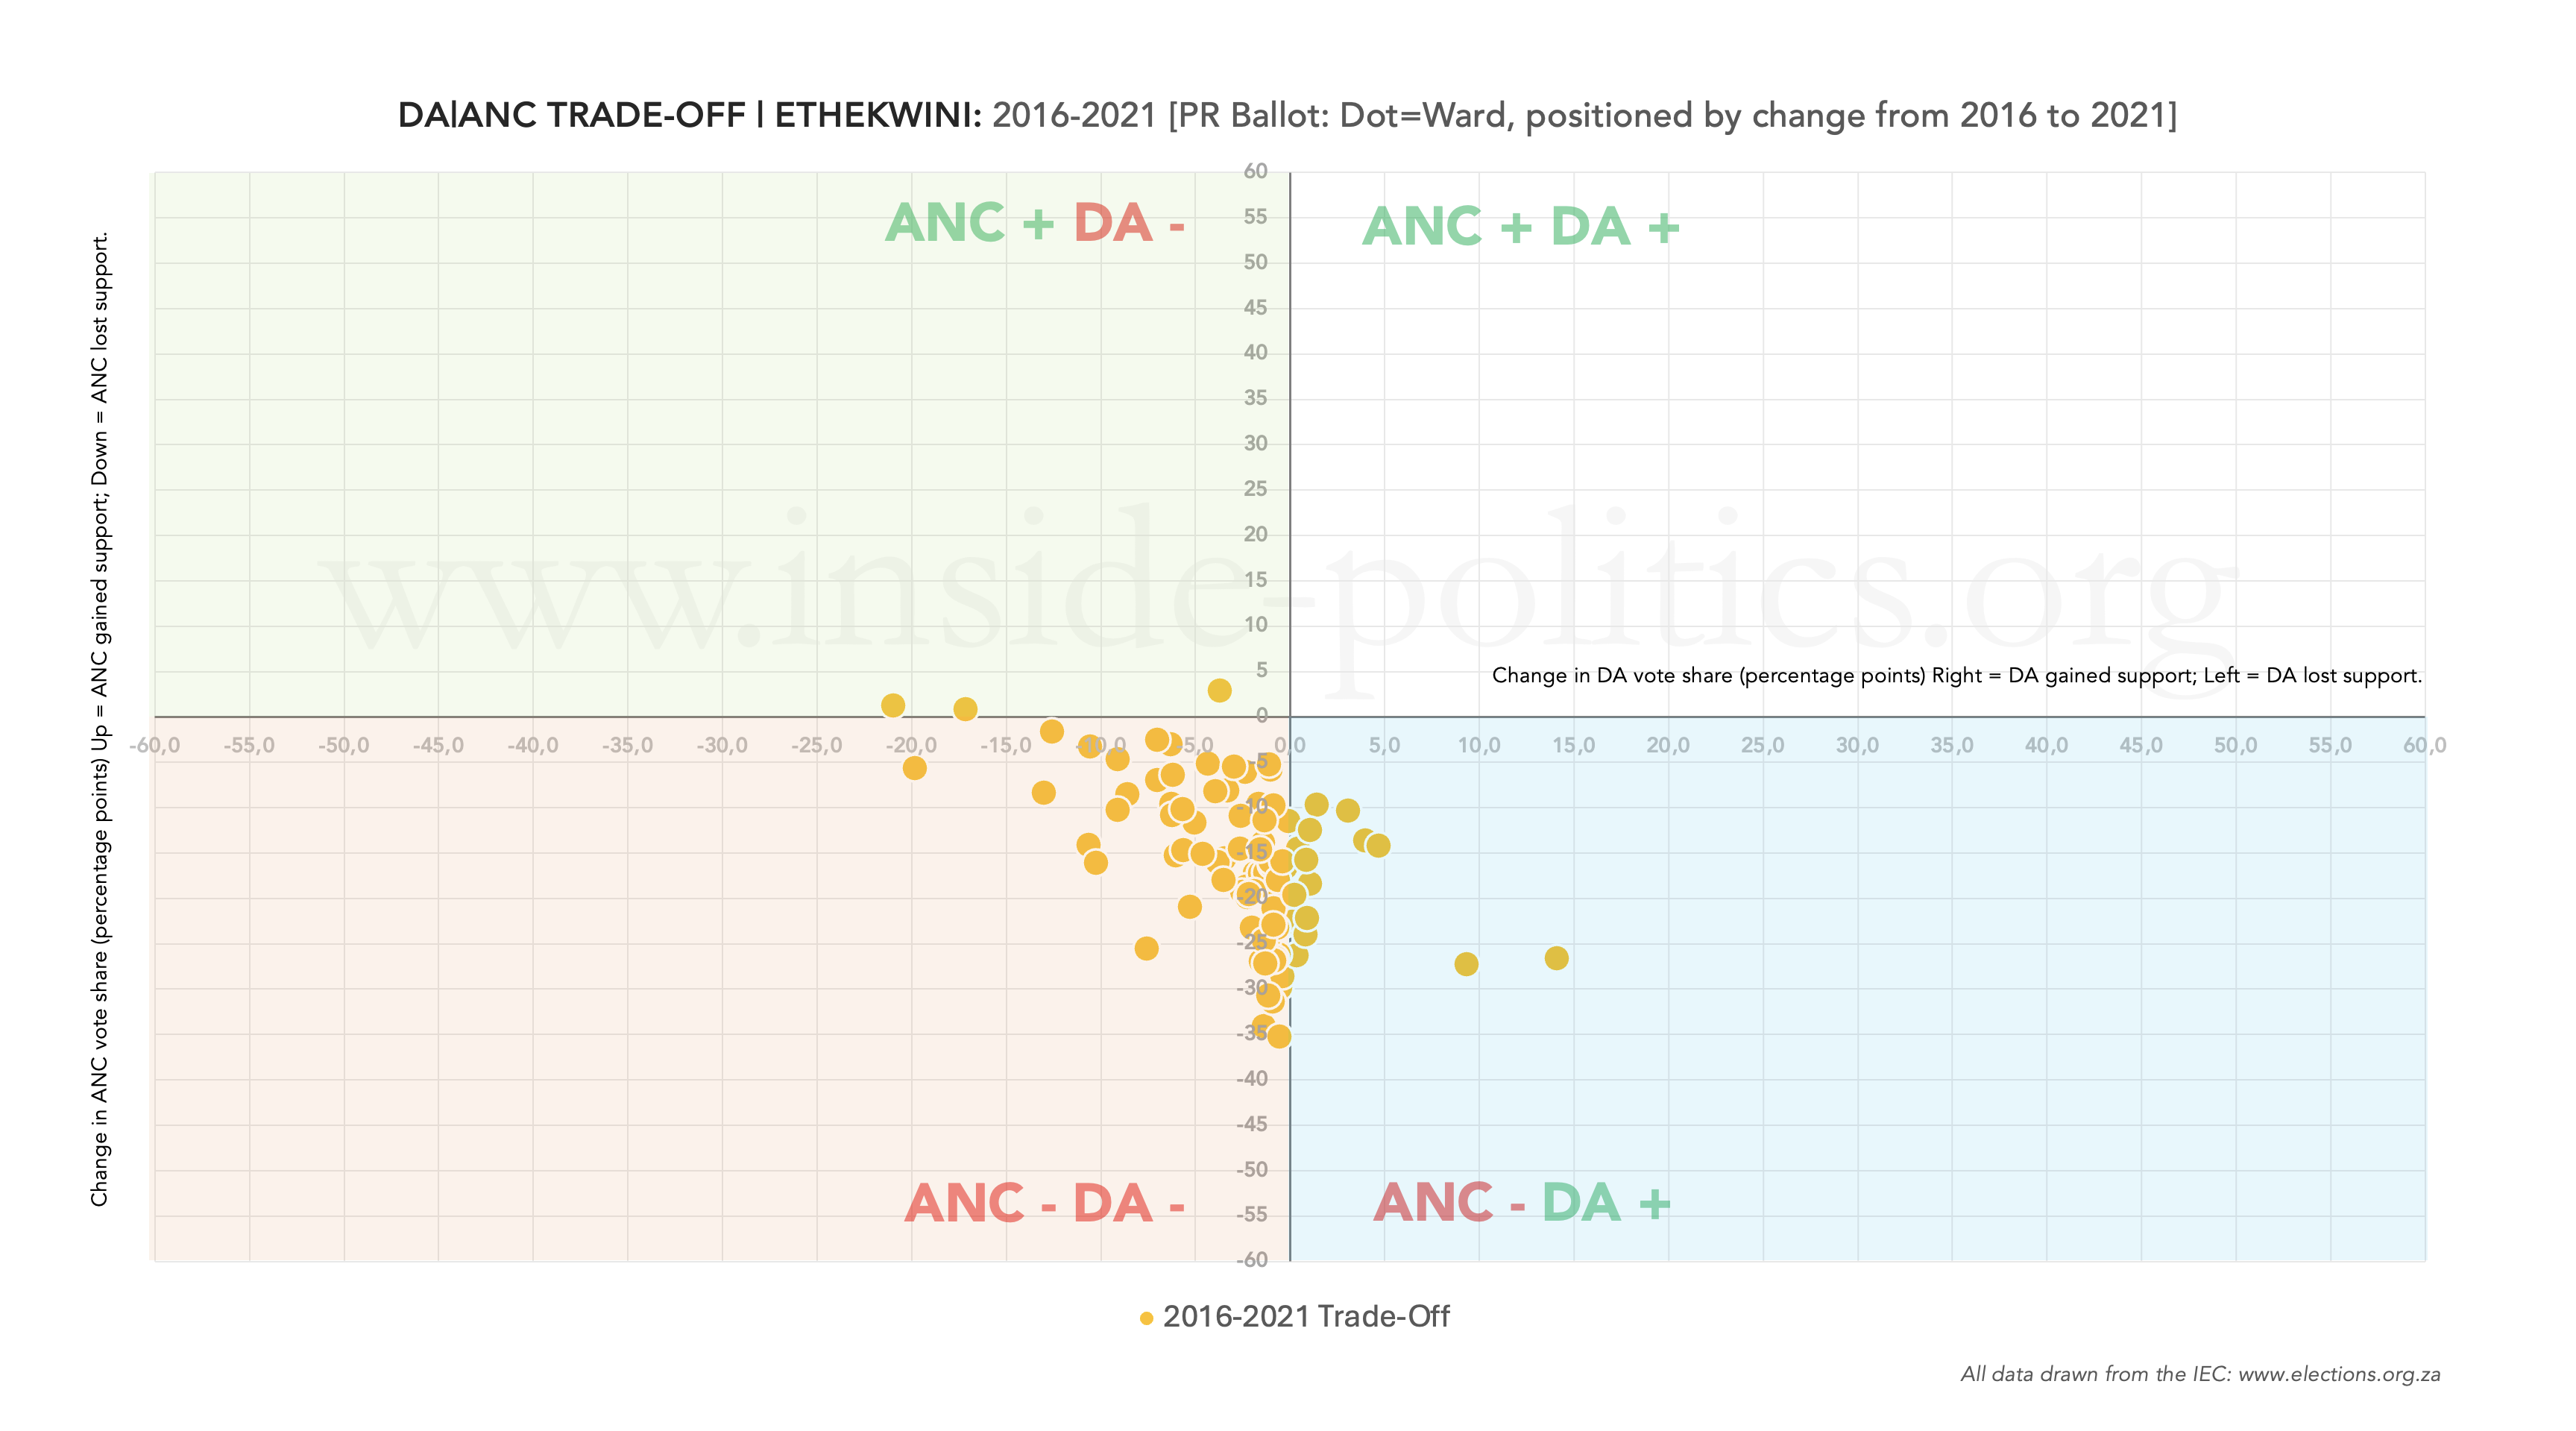
By 2016 that was starting to reverse. The DA had a very good election and the ANC’s ability to win or even retain support (which would see the majority of dots in the centre) was weakening. 2021 was a bad election all-round, with all dots falling in Q3 – the worst possible quadrant to be in – as both parties bled support.
Conclusion
The ANC finds itself in the worst possible position in eThekwini. Before 2024 and the advent of MK, it faced the following challenges:
- Declining turnout in its strongholds (a negative differential of -11.6pts from 2019 to 2021)
- Rapidly declining local support (16.6pts from 2016 to 2021)
- Generally declining turnout, across all parties
Then MK arrived on the scene, and evaporated most of what was left of the ANC’s support in the metro (down from 42.5% in 2021, to 14.4% in 2024).
Combined with the ANC’s pre-existing challenges with the effect of MK and it seems, even if the ANC is able to recover some support in the metro, its best hope – barring the collapse of MK – is to overtake the DA, and regain second position in the metro.
That is easier said than done. For one, as we have seen from the Western Cape and Cape Town, the moment the ANC gets into opposition, it tends to decline even further. Opposition is where the ANC goes to die. It simply cannot function effectively as an opposition party, it does not know how to disaggregate its messaging from national, it cannot drive local issues, and an inability to accept or process rejection means it never learns or demonstrates the humility necessary to introspect and start from the ground up.
eThekwini is a bit different. The ANC still controls the administration, and to the degree that ethnic (Zulu) nationalism drives politics in the province, you feel any party with the right kind of populist ‘big man’ leader can thrive. But even on that front, the ANC larder is bare.
In the background, the DA has quietly but steadily grown and, as of 2024, is 9.1pts clear of the ANC in second place. Like the other metros discussed so far, good differential turnout will deliver for the party an exponential jump in the province, but the measure of that will come more against MK, than it will the ANC.
MK, the IFP and EFF will feature in a separate essay on eThekwini. There is so much to understand and weigh in this metro. It is exceptionally volatile and complex. But also exciting. It is the metro most alive with political competition — which is a good thing — and, as a result, boasts many potential combinations and pathways to power in 2026/7. Rarer still, the ANC is now, and for the first time in our democratic history, on the fringes. That in and of itself is a strange new world indeed.
This essay is the 4th in an on-going series on Election 2026/7, for all other editions of this series, please click here: Election 2026/7
Discover more from inside politics
Subscribe to get the latest posts sent to your email.

You must be logged in to post a comment.