
Election 2026/7 [7] Turnout, Buffalo City, the ANC and DA
by The Editor

A comprehensive look at turnout trends in Buffalo City, with a focus on the ANC and DA. Historical data suggests Buffalo City is the one metro where the ANC has a credible path to 50%. That is not to say it is a likely path, but a path none-the-less. Its enemy here is apathy, as it is everywhere, only the DA is far less of a concern.
Turnout, Buffalo City, the ANC and DA
By: Gareth van Onselen
Follow @GvanOnselen
14 October 2025
This essay is the 7th in an on-going series on Election 2026/7, for all other editions of this series, please click here: Election 2026/7
Introduction
This is the seventh essay in a series of in-depth, statistically driven analytical essays on the upcoming local government elections (to be held at some point between November 2026 and January 2027). Following our analyses of Johannesburg, Tshwane, Ekurhuleni, eThekwini, Mangaung, and Nelson Mandela Bay, this essay looks at Buffalo City. Ultimately, we will look at all eight metros before moving on to some consolidated national analysis. The final essay on turnout will be on Cape Town.
Buffalo City is the ANC’s strongest metro and has been for some time. It is also the place where the ANC’s majority (if not an outright 50% share, then at least a clear plurality) seems safest. Of course, as with every metro, that does not mean the ANC has been able to resist the forces of apathy and alienation that have suppressed its vote share everywhere, but it does mean this metro is one of the rare places where the ANC can realistically look to keep its 50% majority.
Turnout: Buffalo City
While turnout patterns in Buffalo City mirror those elsewhere (up in provincial elections, down in local government elections), only once—in 2021—has turnout dipped below 50%. Most metros saw early dips below 50% in 2000 and 2006 and, generally speaking, 2011 and 2016 were when urban turnout was at its strongest before plunging again in 2021. But Buffalo City bucks that trend and, similar to Mangaung, reflects a metro with historically high ANC support.
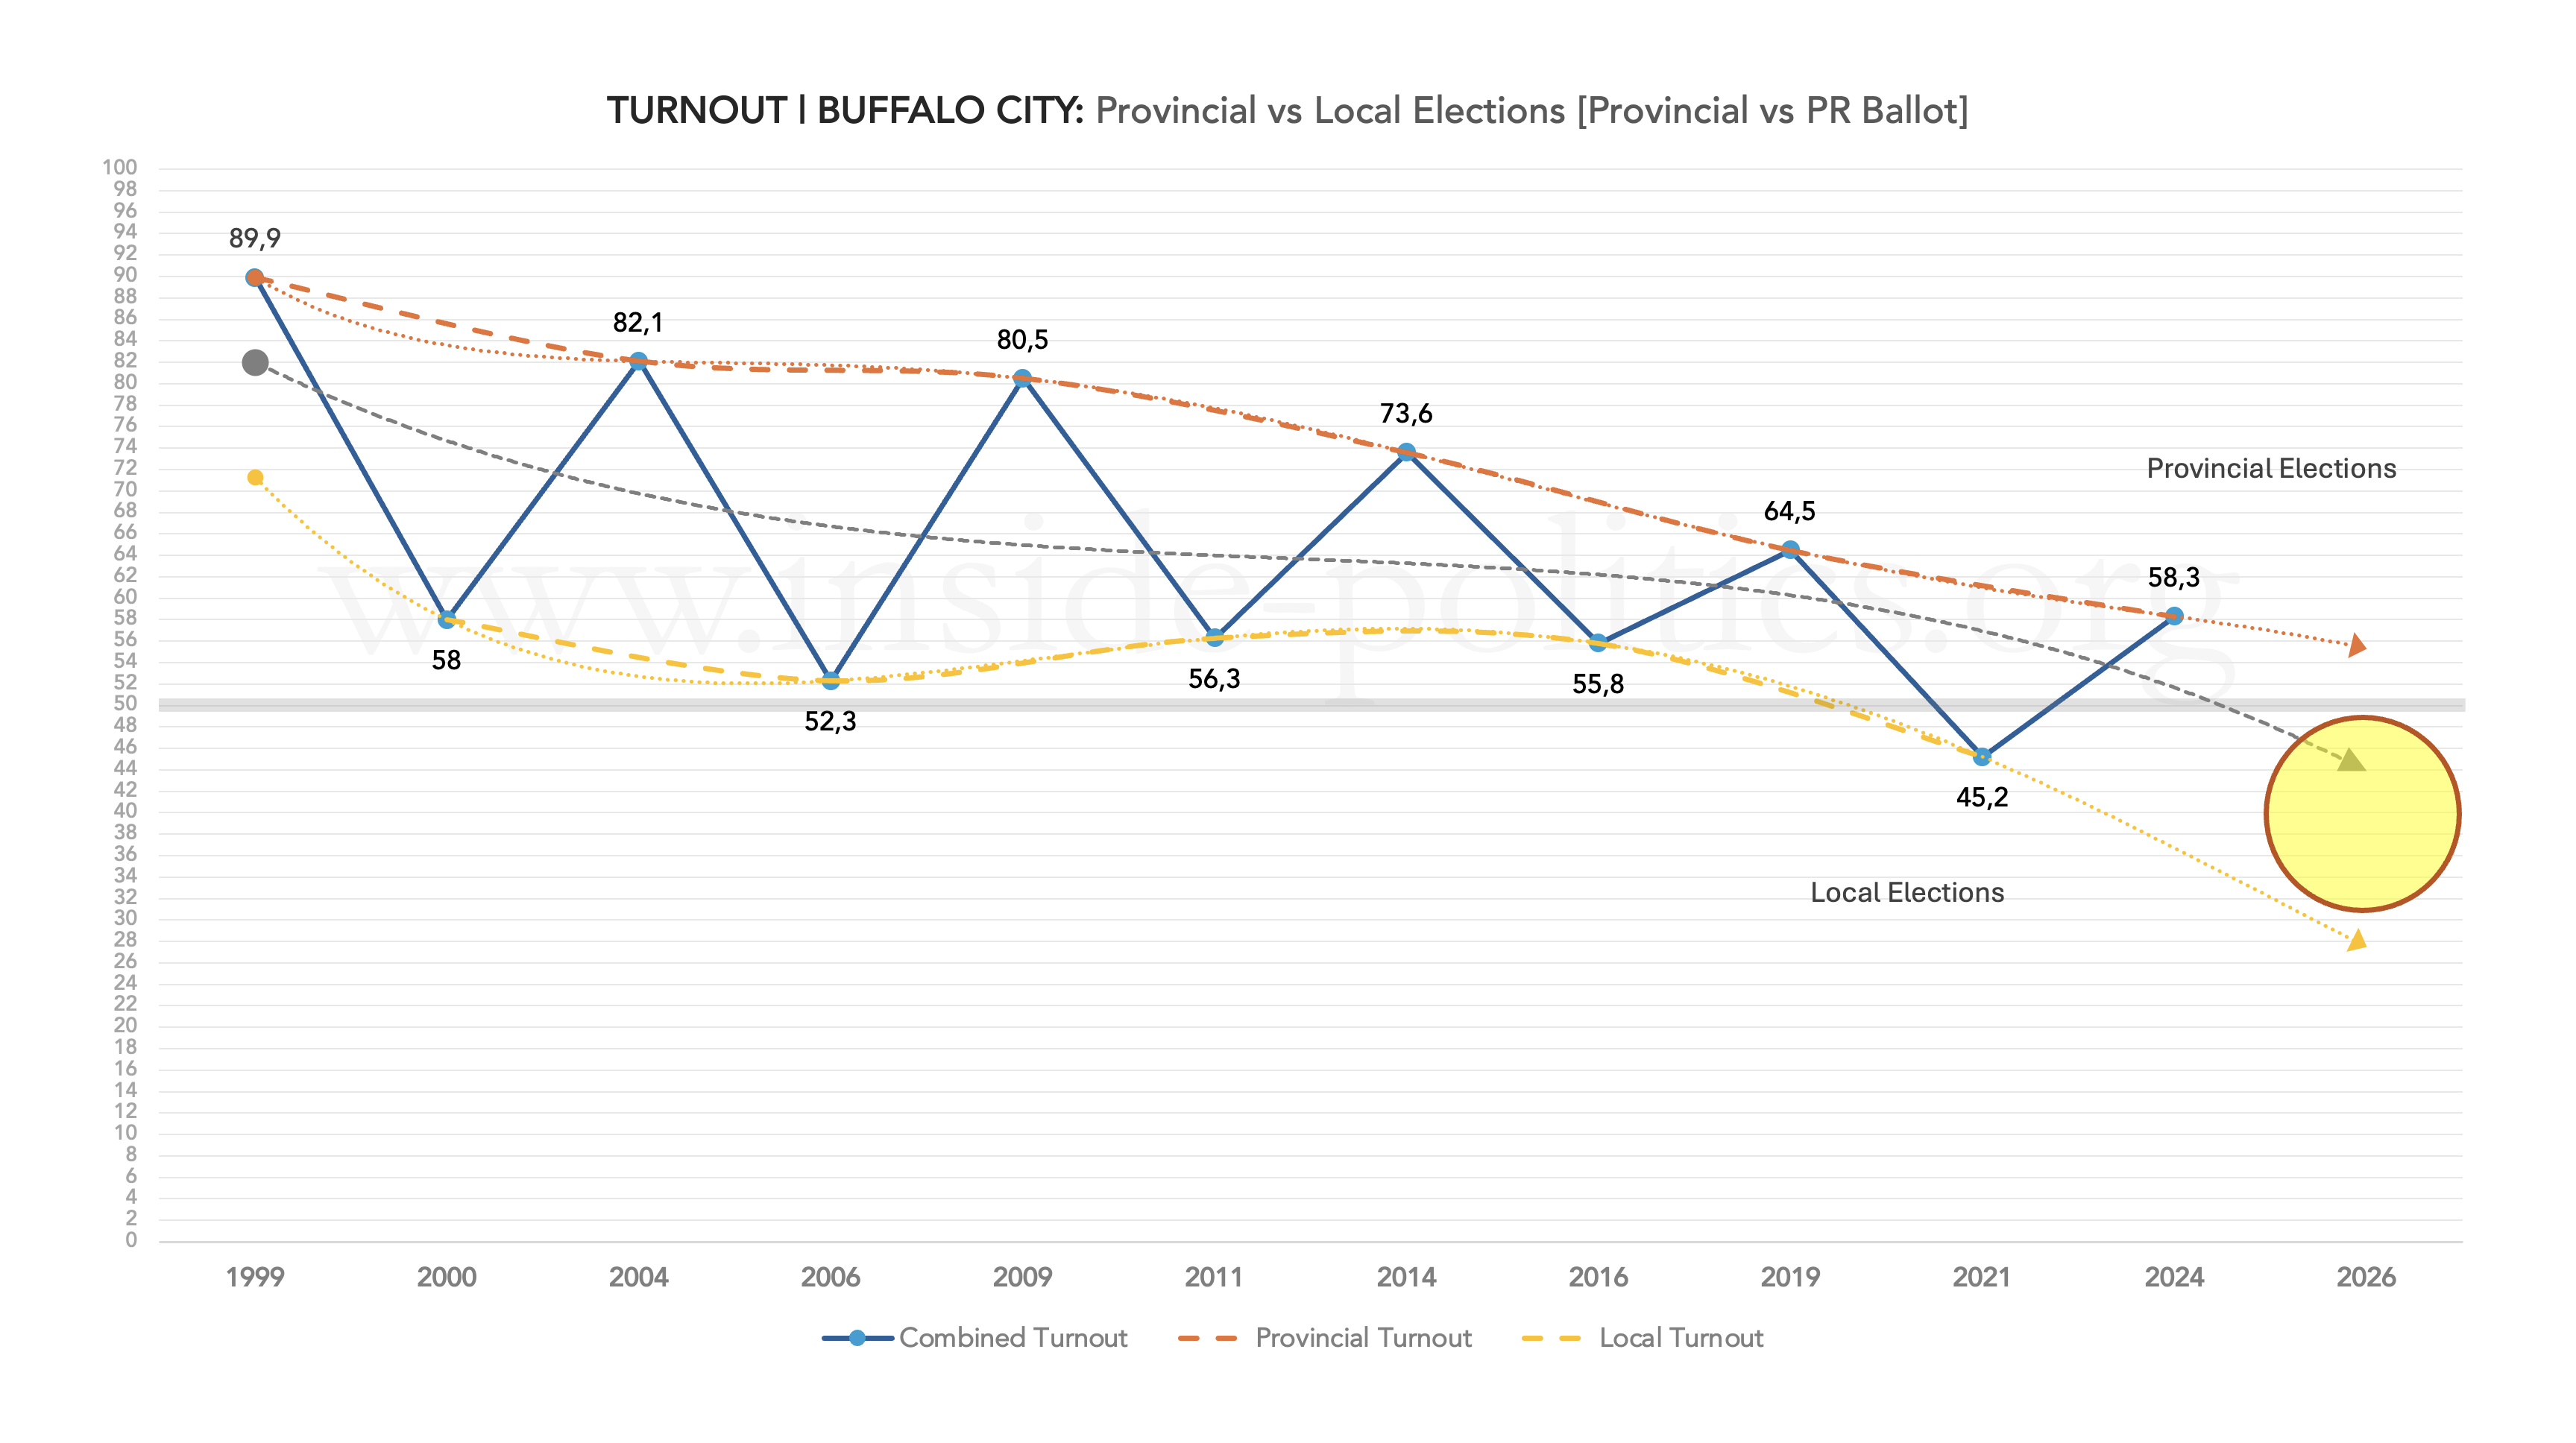
The local elections trendline suggests turnout is headed for well below 50% in 2026/27, but in reality, it will probably not drop as dramatically—down for sure, but more toward 40% than 30%.
We have long since established the relationship between turnout and ANC support, the two being co-dependent. But here too Buffalo City bucks the trend: the recent decline in turnout is not reflected in the ANC’s support. In most metros, the ANC’s support has dropped so rapidly over the last 15 years that it has departed from the turnout trend completely. But in Buffalo City, the two remain in lockstep.
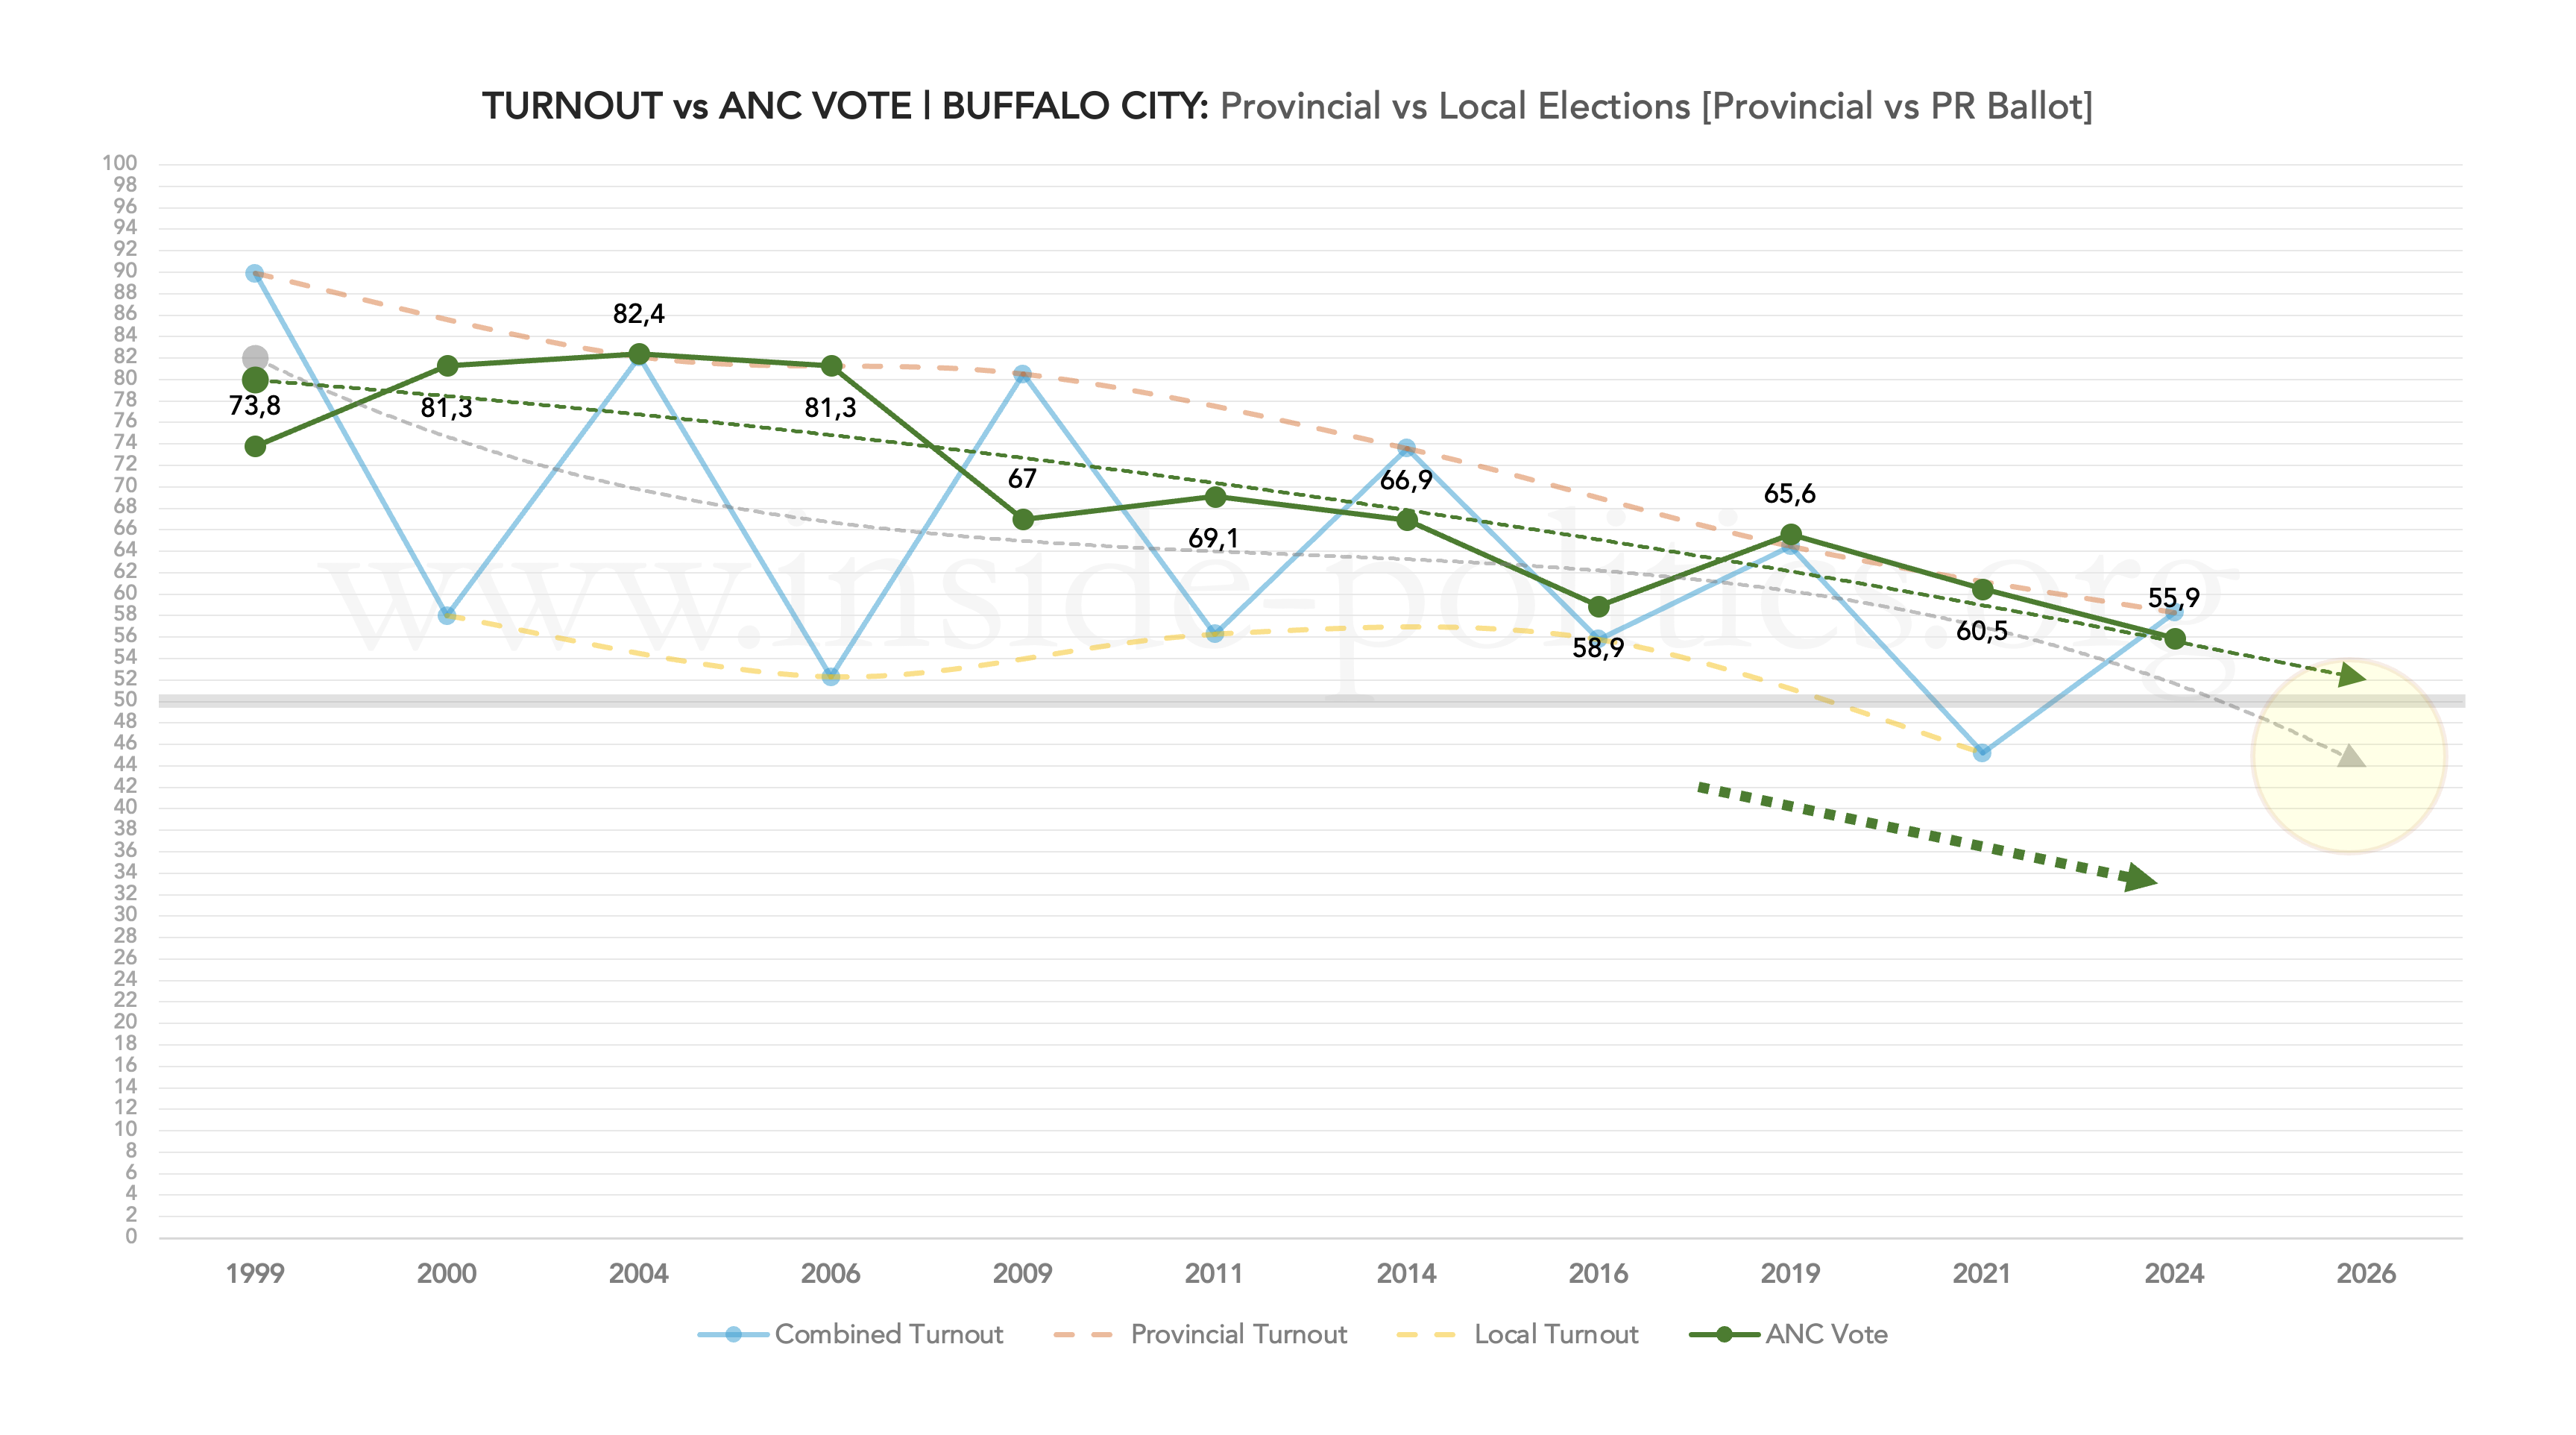
Not just in lockstep, but the ANC’s support line is right at the top of the turnout trendline. It has stayed there thanks in large part to the party’s 2021 performance (60.5%), which set it apart from its urban counterparts. It is true that its support dropped in 2024, and currently only 6 points separate it from the 50% line, but the ANC has more in reserve in Buffalo City than in any other metro—most of which suggest a descent toward bankruptcy.
Because national trends will, to one degree or another, manifest everywhere—even in strongholds like Buffalo City—one way of understanding this metro is as a political time capsule, locked five or ten years behind the rest of the country.
The trendline suggests the ANC will retain its 50% majority here but, as stated elsewhere, the ANC’s decline can be gradual or exponential. In the big picture, the ANC is struggling. Its days of a “super majority” (2000, 2004, and 2006, when it managed 80%+) are long gone. It has lost 26.5 points since its all-time high of 82.4% in 2004.
In some places, the ANC has already fallen off the cliff (eThekwini); in others, it is slowly marching toward the edge. There is no way to tell where the precipice is in Buffalo City, only that the ANC is getting closer to it. The 2026/27 elections will reveal all.
If we look at our consolidated graph of ANC metro performances, its strength in Buffalo City is immediately apparent.
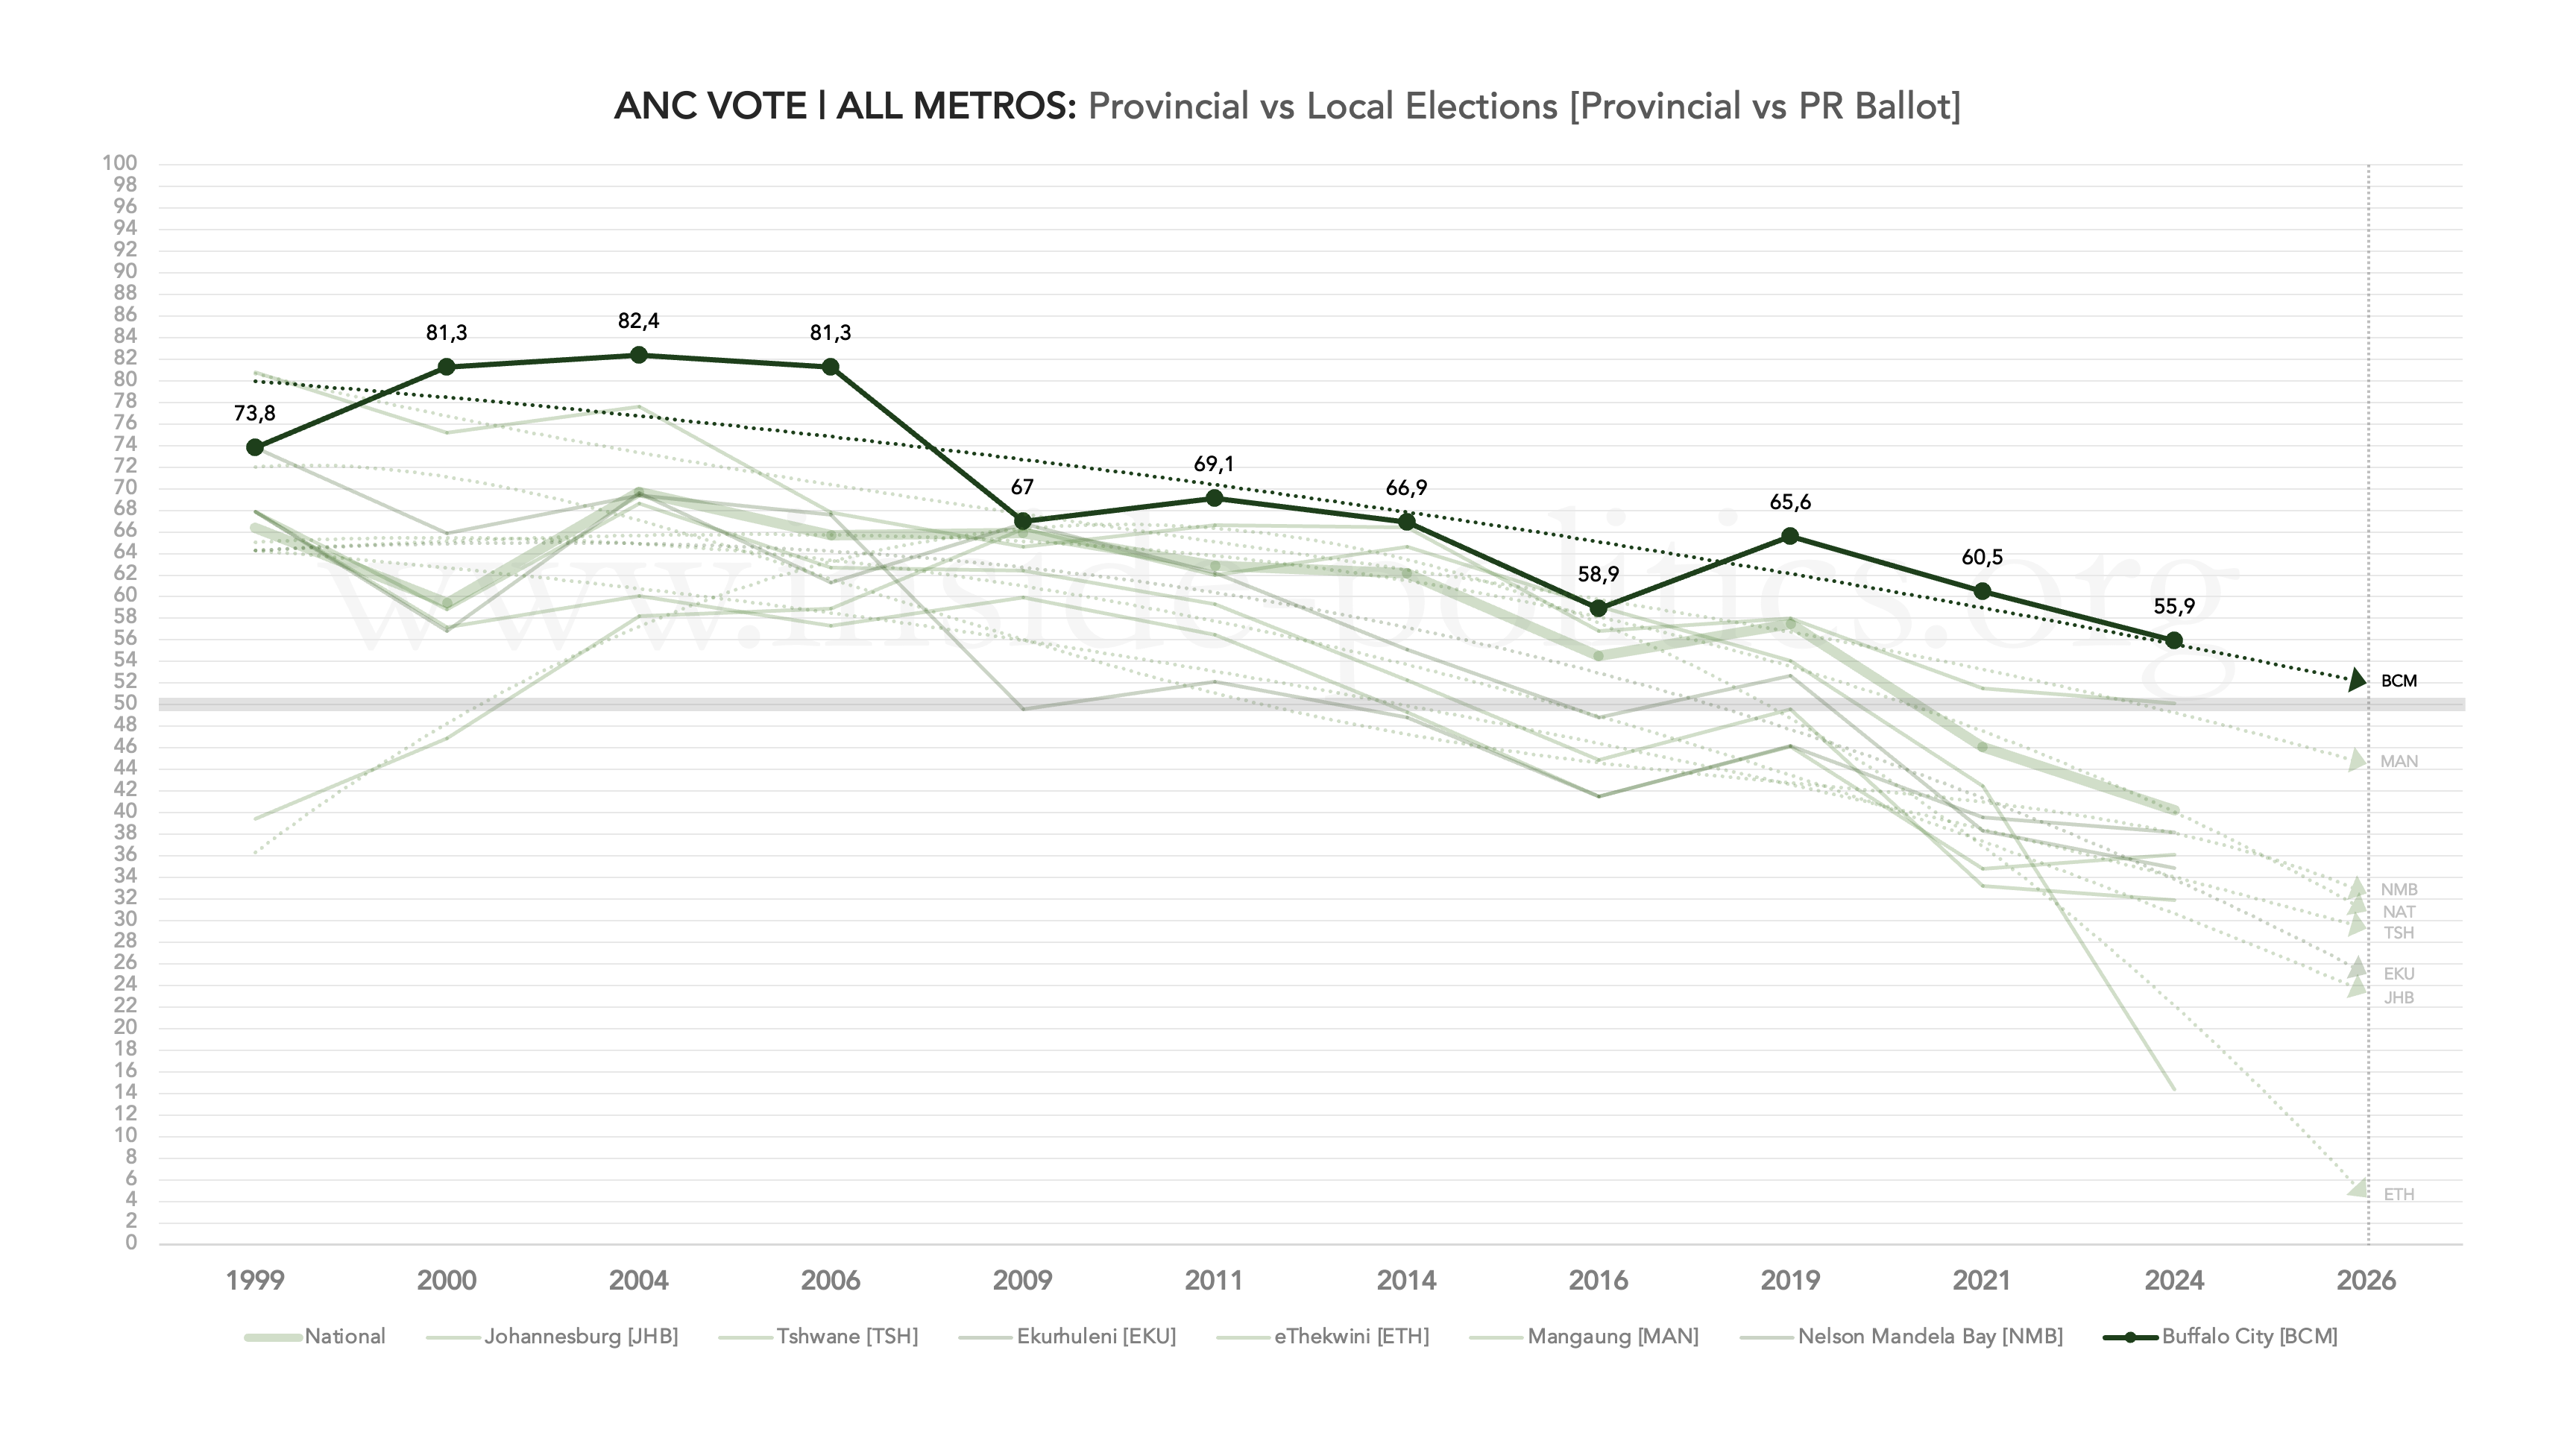
As of 2024, in Mangaung the ANC sits at 50%; everywhere else it is well below that. But Buffalo City is different. If its decline continues, 50% will be a hard-fought battle but is perfectly doable if the party can inject even a small amount of enthusiasm. As for new—and untested—forces at local government level (MK, for example), Buffalo City would seem an ideal target. If any other party can take just 5% off the ANC here, it will be well placed to force the party into a coalition.
Turning to the DA: its support over time is shown below, mapped against turnout.
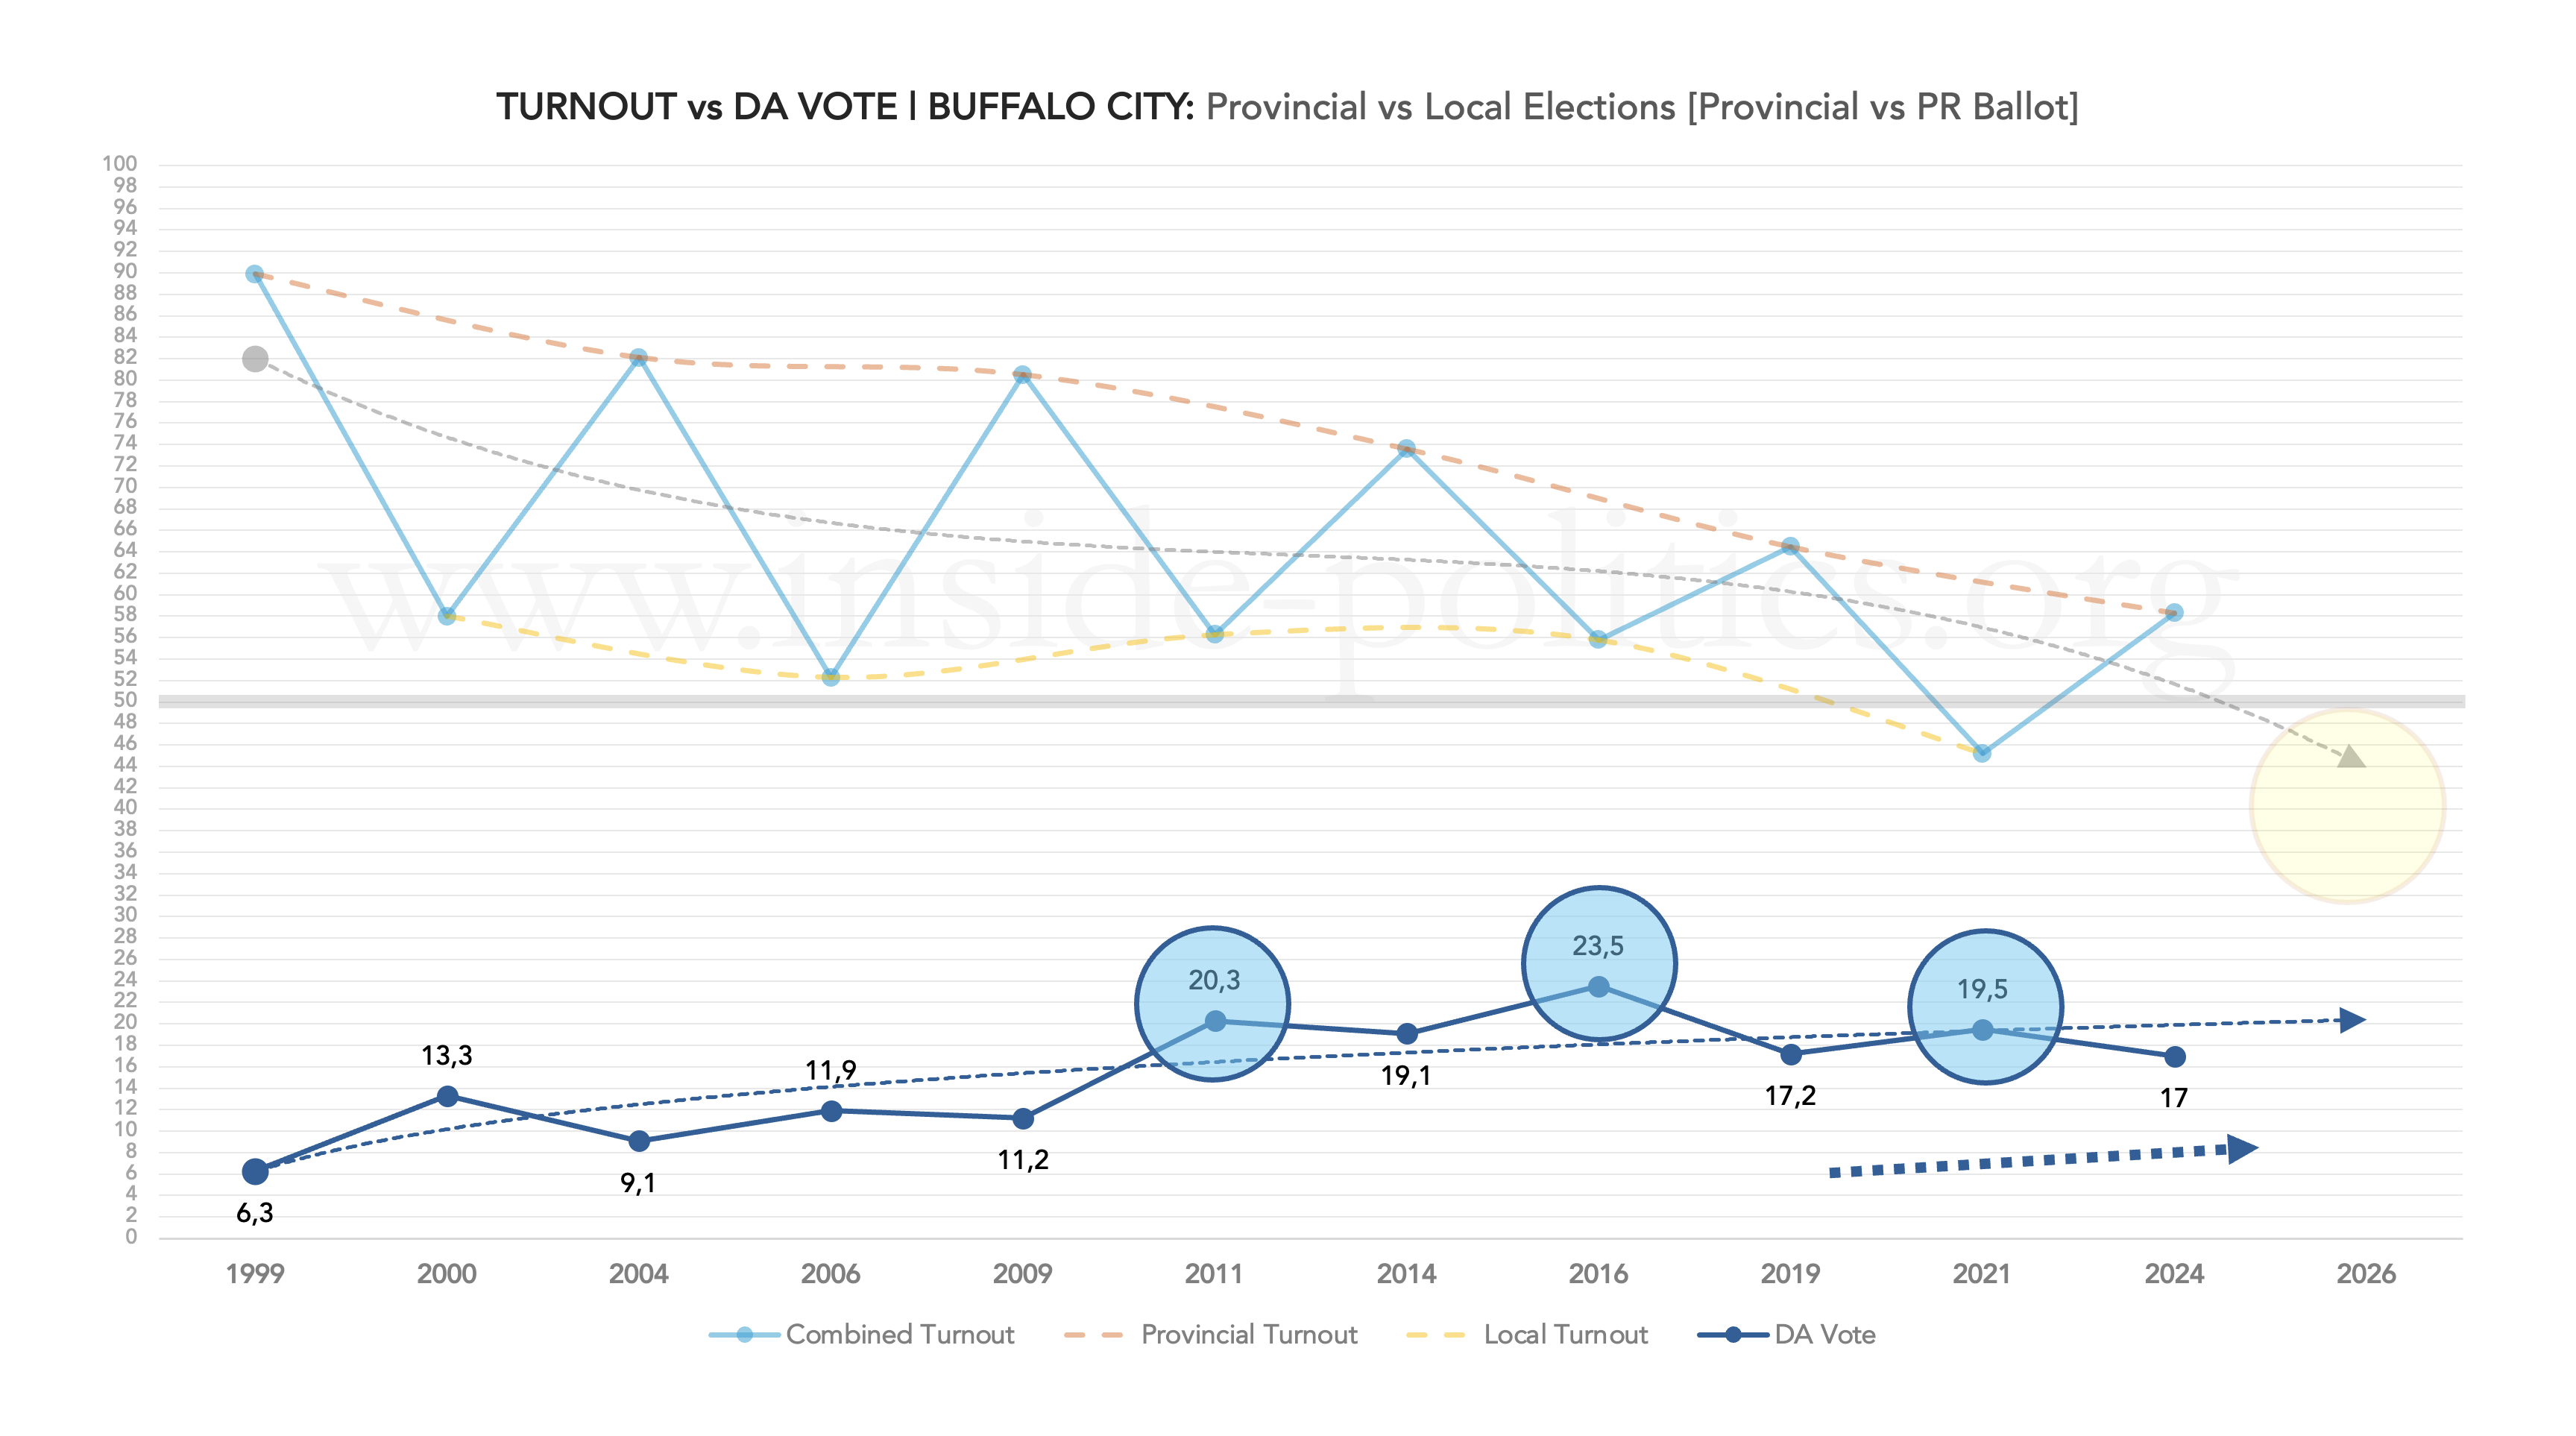
It is a relatively disappointing showing, but that is largely due to its provincial ballot performance (2014, 2019, and 2024) rather than its local government results. Indeed, the party’s traditional local elections “bump” is evident here—three times (2011, 2016, and 2021) it reached around 20% or above—only to be dragged back down in each subsequent provincial election. In 2024 it dropped to 17%, its lowest point since 2009.
So the DA in Buffalo City is a bit like Sisyphus: painfully pushing itself above 20% in local government elections only to fall back down again. The result is a relatively even trendline since 2011, falling between 17% and 22% for the past six elections.
In turn, Buffalo City represents the inverse of the ANC’s consolidated set of metro results (below), running along the bottom of all DA metro performances.
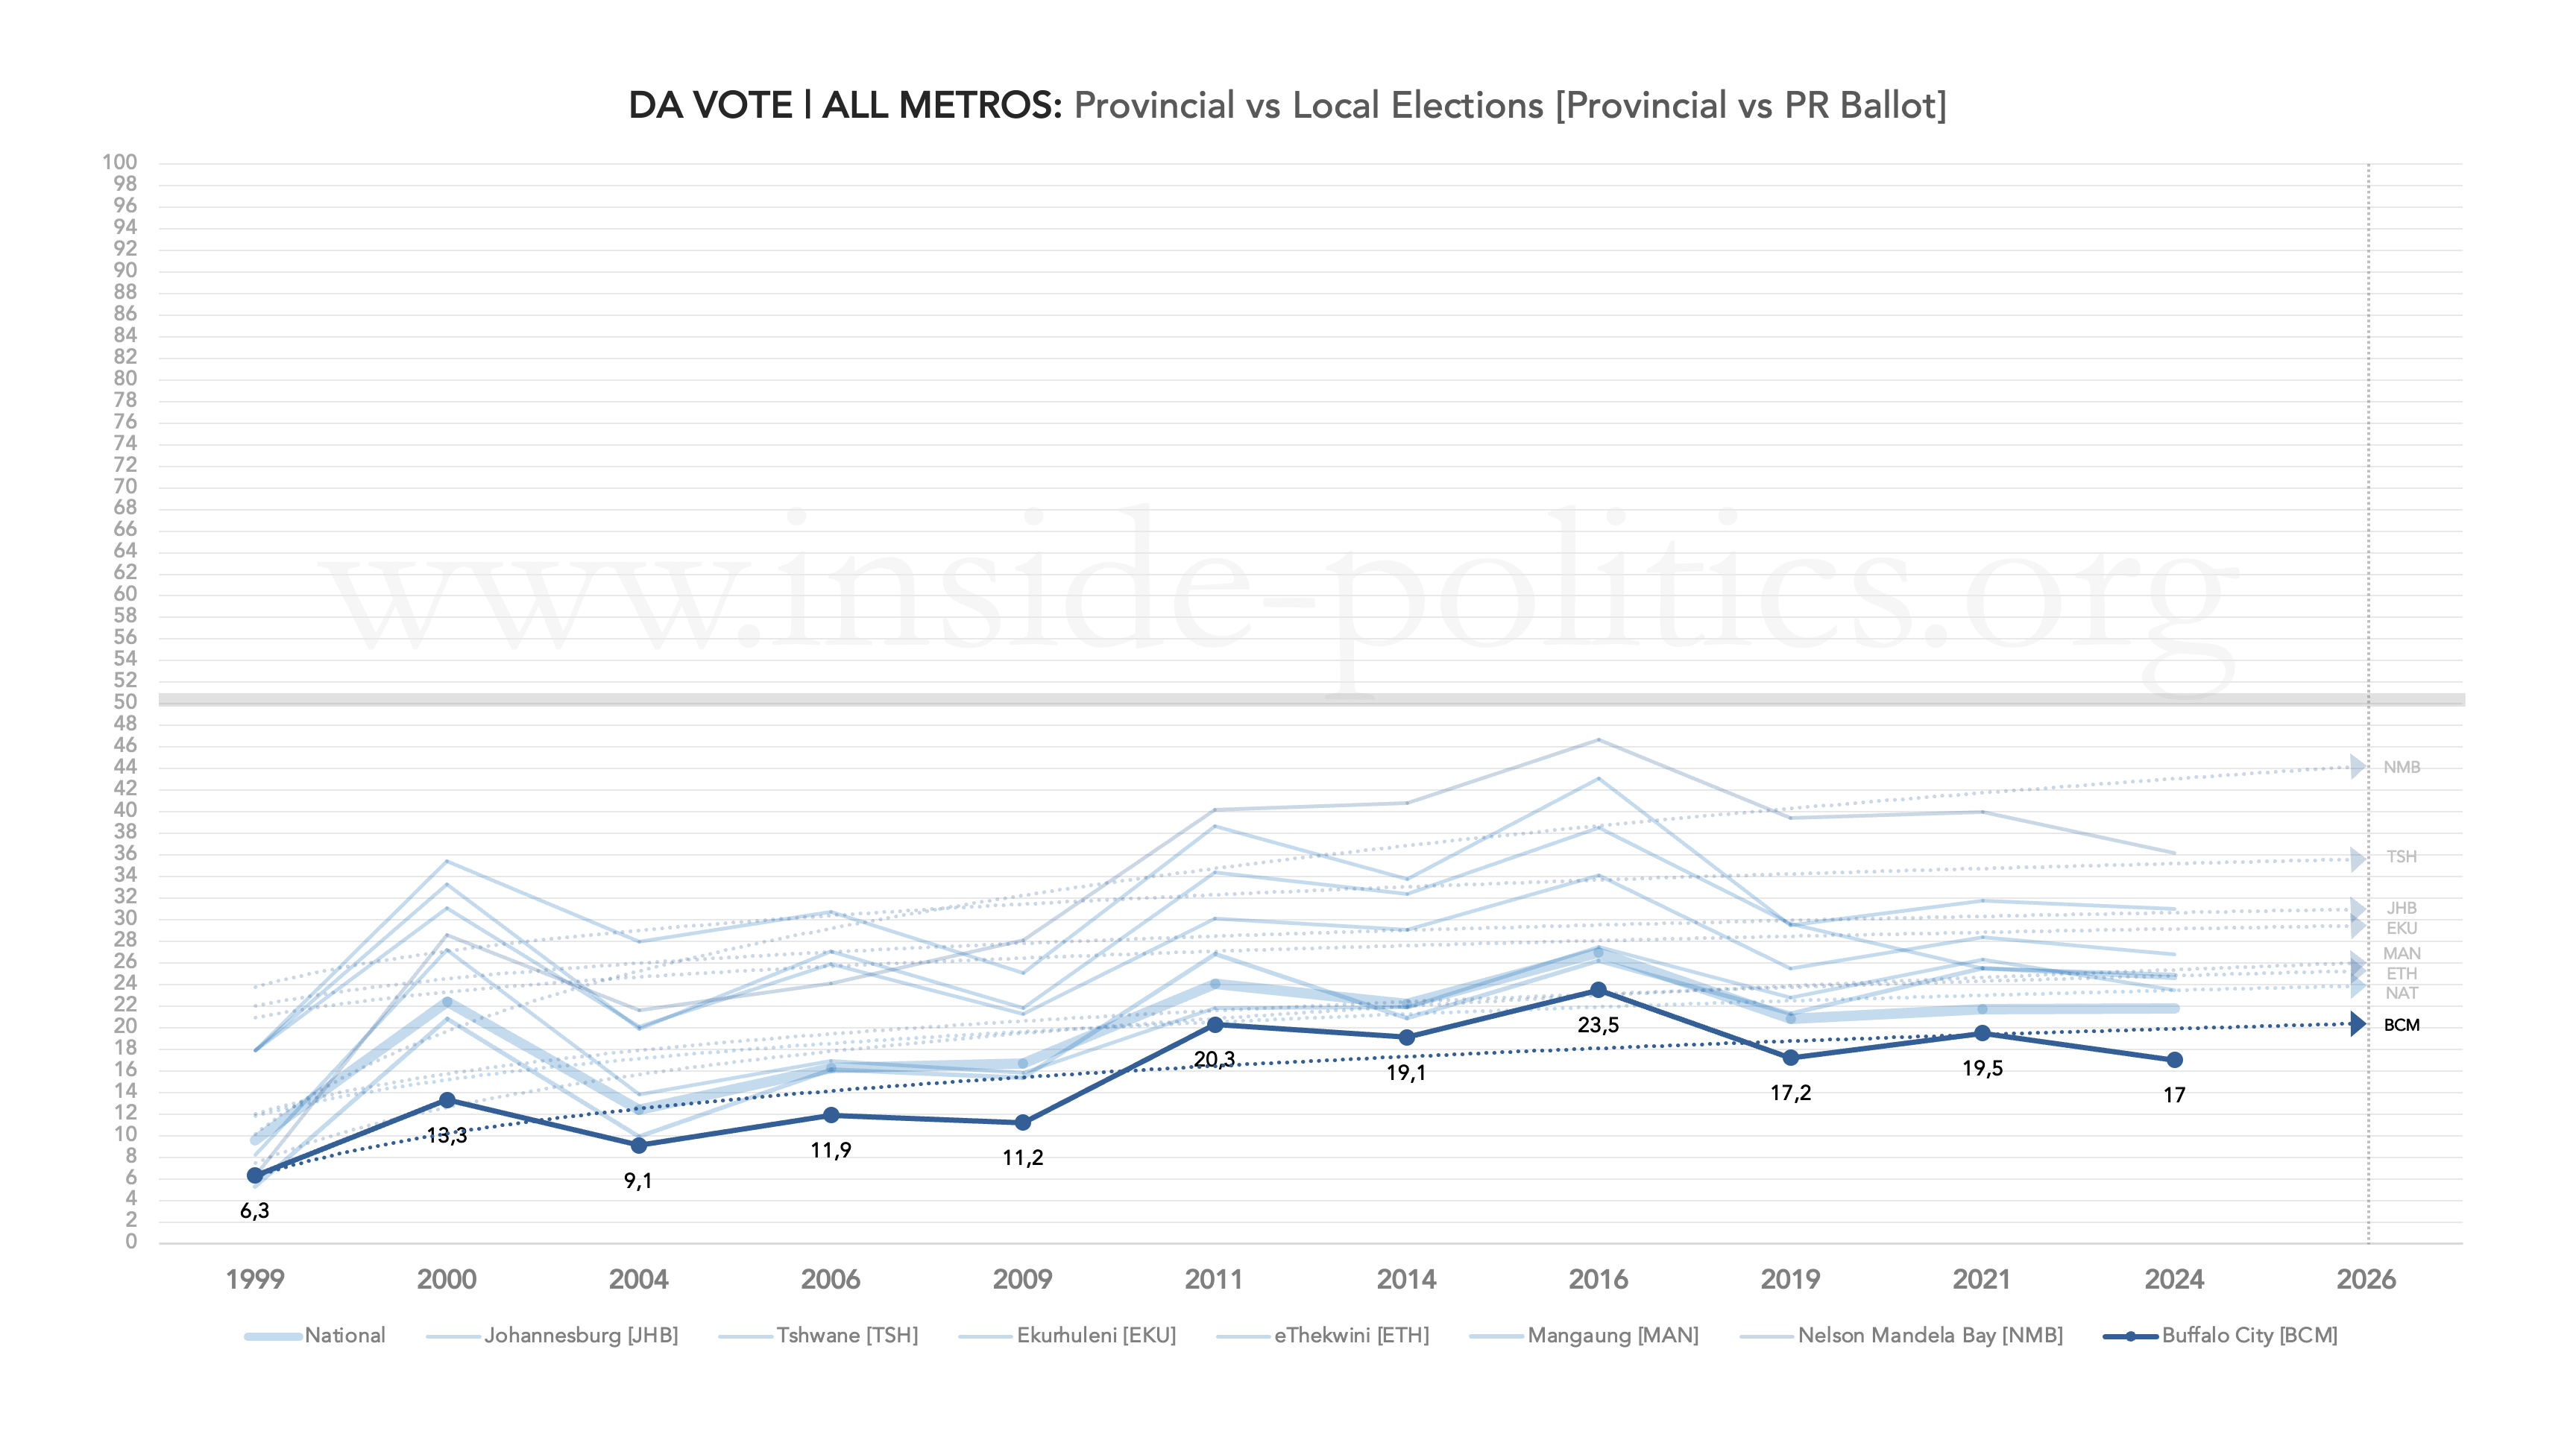
Buffalo City is the only metro where the DA’s support line falls below its national average. Mangaung, to a lesser degree, demonstrates the same characteristic—reflecting a rural rather than urban landscape where the ANC thrives—but Buffalo City represents the most hostile urban environment for the DA. Even if the party does well in 2026/27 and once again breaches the 20% bracket, history suggests that the real test of meaningful success will be the next set of national and provincial elections.
Bumps and Slumps
Let us look at the ANC/DA turnout differentials (the difference between each party’s provincial and local government performances), below.
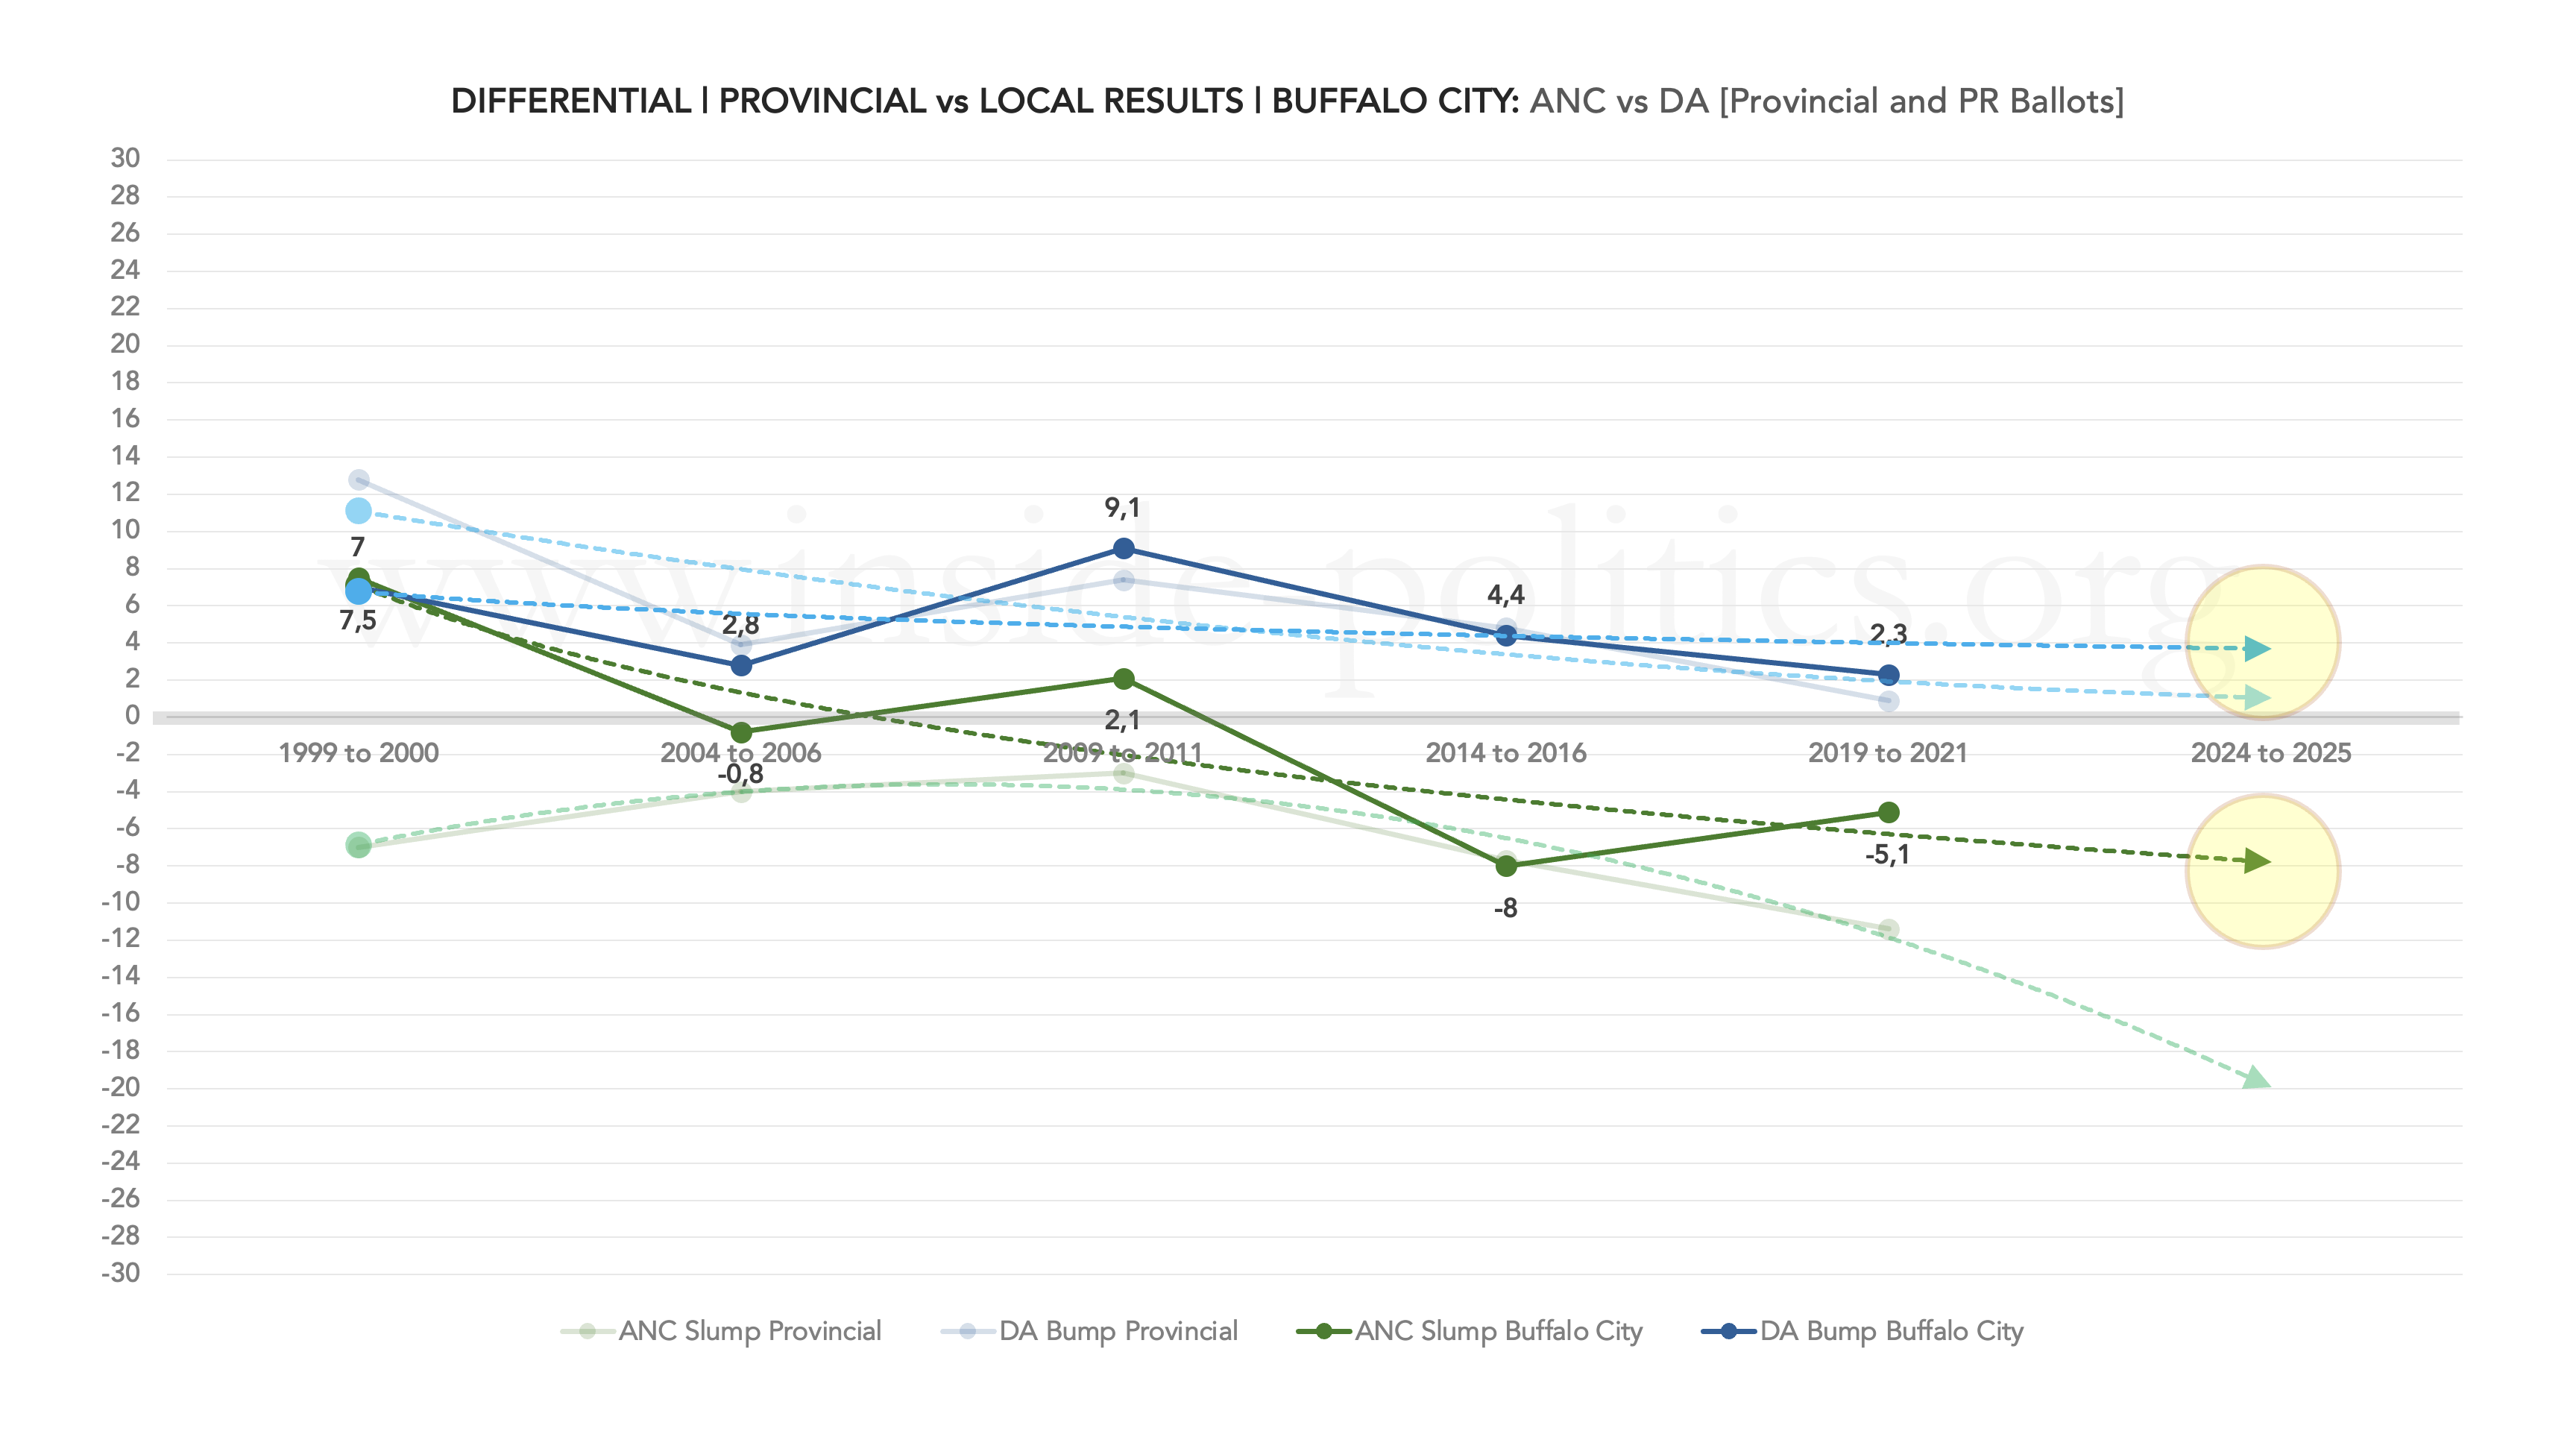
For the last three full election cycles (2009–2011, 2014–2016, and 2019–2021), each party fared as follows:
ANC:
- 2009–2011: +2.1 points
- 2014–2016: −8.0 points
- 2019–2021: −5.1 points
DA:
- 2009–2011: +9.1 points
- 2014–2016: +4.4 points
- 2019–2021: +2.3 points
The ANC managed a positive differential in 2011 (+2.1 points) but has gone negative since. If ANC support declines by the same number of points as in 2021, it is set to drop below 50% and, given its general decline, that seems more likely than not. That said, 5.1pts (the ANC differential in 2021, is an improvement from 2016, and it did close the gap significantly on the DA as a result.)
As for the DA, the same problem it faces elsewhere is evident here: a shrinking local government election bump, down from +9.1 points in 2011 to +2.3 points in 2021. With that, its ability to exploit the ANC’s traditionally poor local government performance is declining.
The historical record suggests that the DA’s problem is the 20% bracket: it can break into it, just, but it cannot hold its support there—and even then, it is becoming harder to break meaningfully into it. Its last three local government results demonstrate this: 20.3%, 23.5%, and 17%. Still, given the ANC’s decline, if the DA can manage even a modest bump—3 points, say—it is likely to close the gap significantly in 2026/27.
If we map both parties on the same graph, below, we can see the size of that gap.
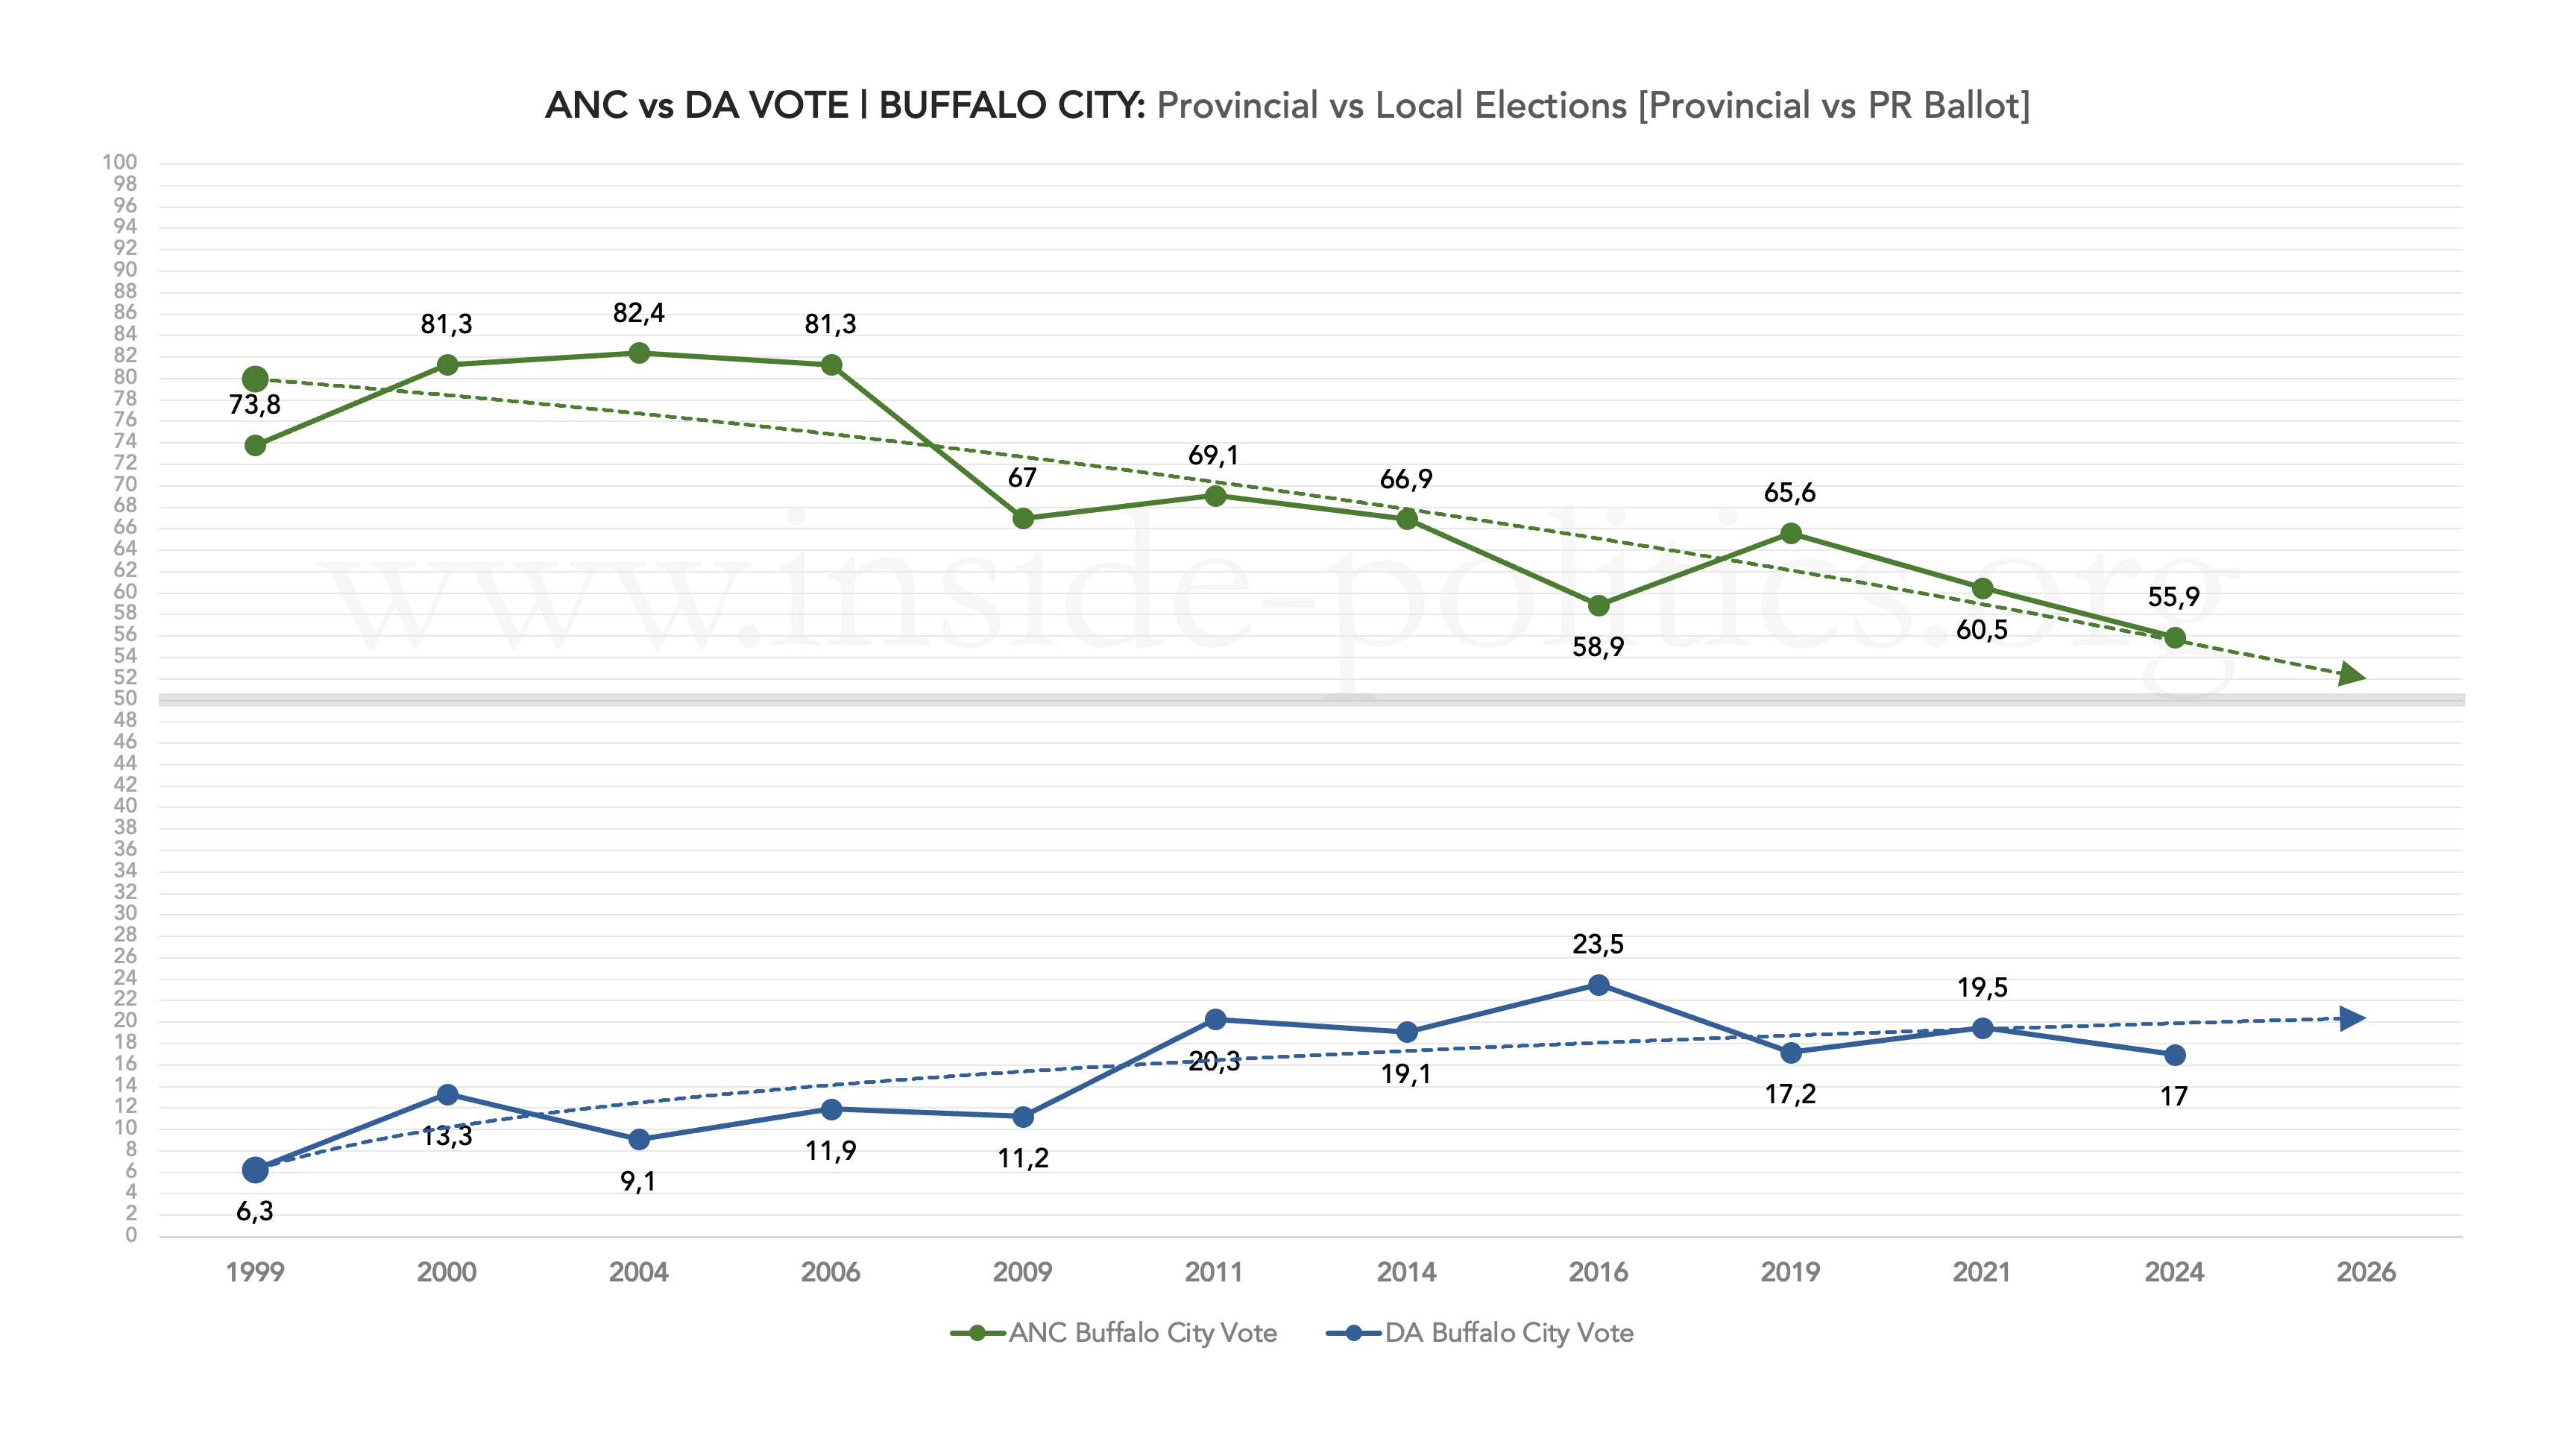
As of 2024, the gap is 38.9 points—the largest in any metro. The closest the two ever came was 2016 (35.4 points). The gap has grown marginally since then. So the discussion in Buffalo City is less about how the opposition might form a coalition if the ANC drops below 50%, and more about whom the ANC might partner with from within its own electoral universe to constitute a majority.
A Ward-by-Ward View of Buffalo City Turnout
As in previous essays, I have condensed each ward-turnout graph into a single timelapse video.
It comprises a series of six scatter graphs that show ANC turnout (the ANC’s PR vote divided by the total registered voting population) in every Buffalo City ward, beginning with a combined graph and then one for each of the last five local elections—2000, 2006, 2011, 2016, and 2021.
Each dot represents a ward. The ANC’s turnout percentage runs up the Y-axis, and the size of the ward (in terms of registered voters) runs along the X-axis. What a party wants, of course, are dots clustered toward the top-right corner (large wards/high turnout).
(The individual graphs are available on the resources page.)
There is no escaping apathy. Despite the ANC’s strong foothold in Buffalo City, the same national pattern is evident: exceptionally high turnout in 2000 and 2006 and strong turnout in 2011; but by 2016 the party’s turnout was starting to decline dramatically, with its best wards falling below the general turnout line. In 2021 it managed to turn out a few wards at the general turnout rate but, given that turnout itself had dropped significantly (down to 45%), its overall performance was heavily repressed.
One difference in Buffalo City is that, regardless of turnout, the ANC typically has no cluster of wards sitting at the bottom (usually DA strongholds). This is a sign that its current and potential support is spread broadly across the metro.
Across all metros, the DA is at its weakest in Buffalo City. Even in local government elections, where it gets a turnout bump, its turnout record (below) shows it relies on three or four wards where it can generate significant numbers.
For the rest, its performance starts from a very low base, and many wards sit firmly at the floor—a sign that its support is narrow and limited. Worse still, as we have seen with its differential turnout, apathy has affected the DA too: its support band is gradually narrowing as general turnout declines over time.
Trade-Offs
As usual, to conclude this analysis: trade-offs and the relationship between the ANC and DA vote. If ANC votes go up, do DA votes go down? To track this, we again need to plot every ward as a dot on a grid, but this time each dot represents the change in support—not the ward itself. If the ANC gained in a ward, the dot moves up; if the DA gained, it moves right. Thus the grid divides into four quadrants:
- Q1 (top left): ANC up, DA down
- Q2 (top right): ANC up, DA up
- Q3 (bottom left): ANC down, DA down
- Q4 (bottom right): ANC down, DA up
From the ANC’s perspective, a good election is when a large number of dots fall in Q1 (ANC up, DA down). From the DA’s perspective, a good election is when many dots fall in Q4 (ANC down, DA up). And for both parties, the worst place to be is Q3 (ANC down, DA down).
Because wards change over time, we cannot run this comparison for all election years—you need consistent wards between elections—but we can run it for 2000–2006 (54 identical wards), 2011–2016 (60), and 2016–2021 (60). If we do that, we get the following three graphs:
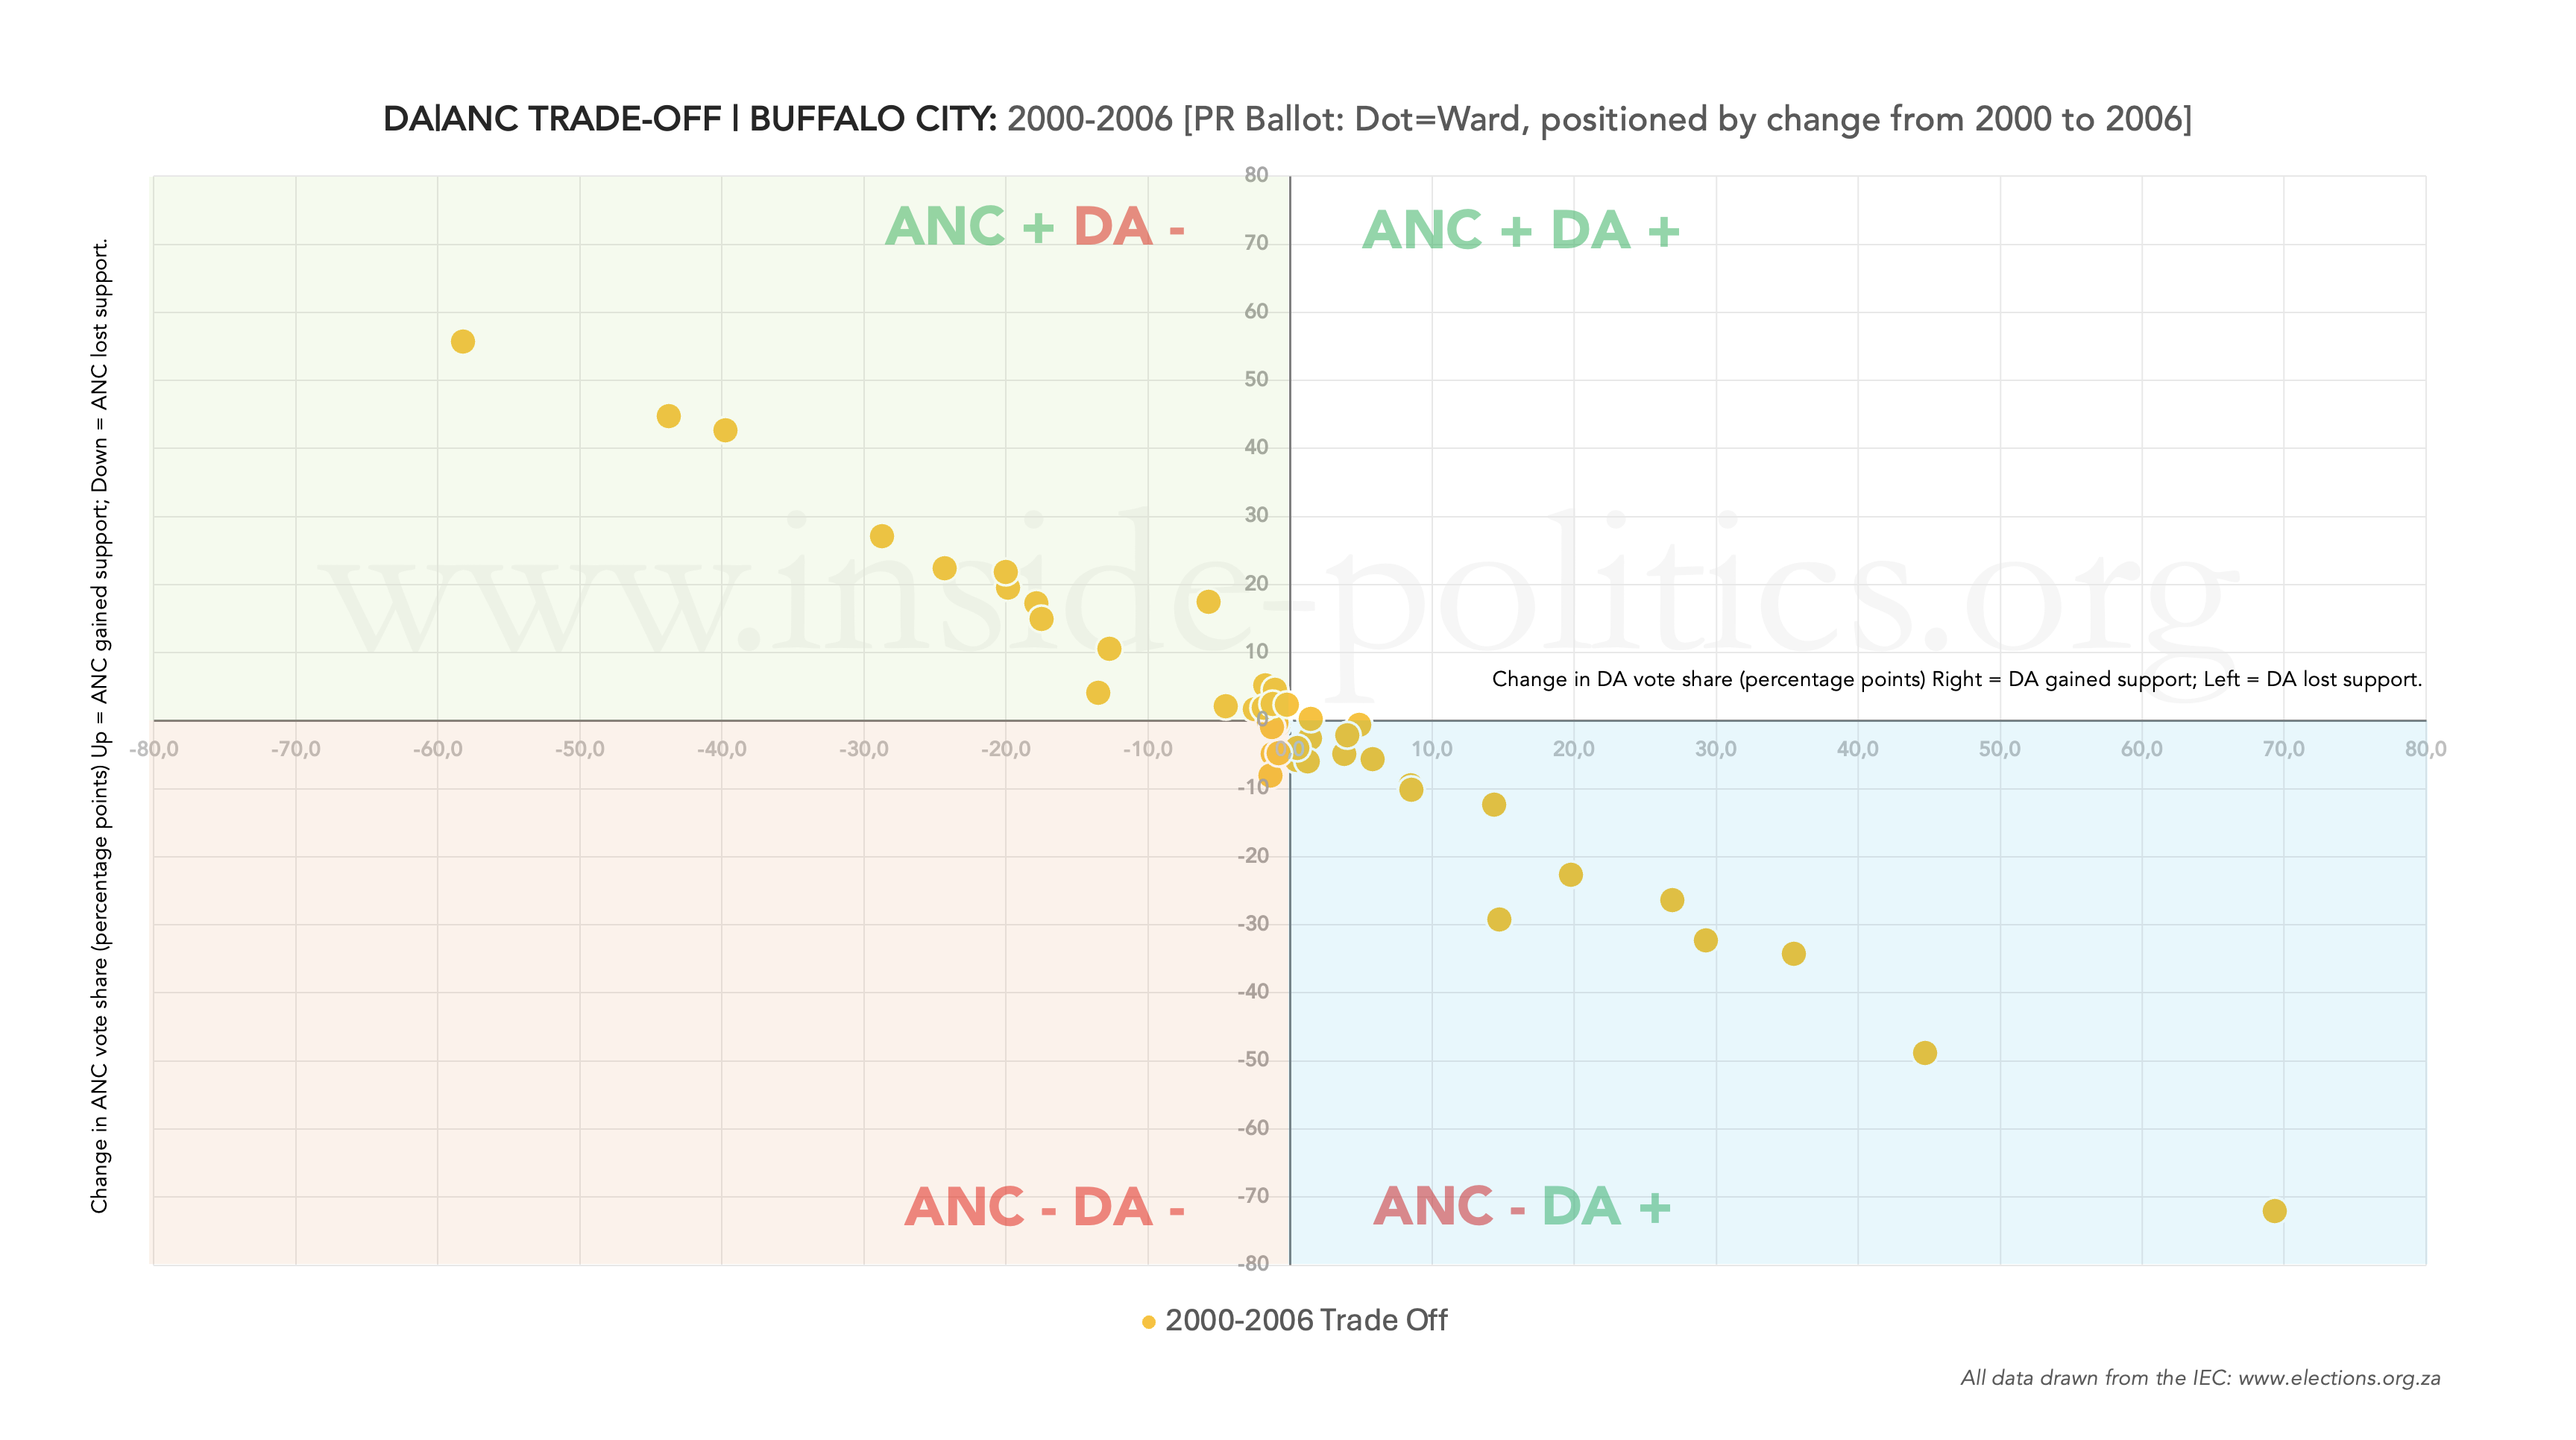
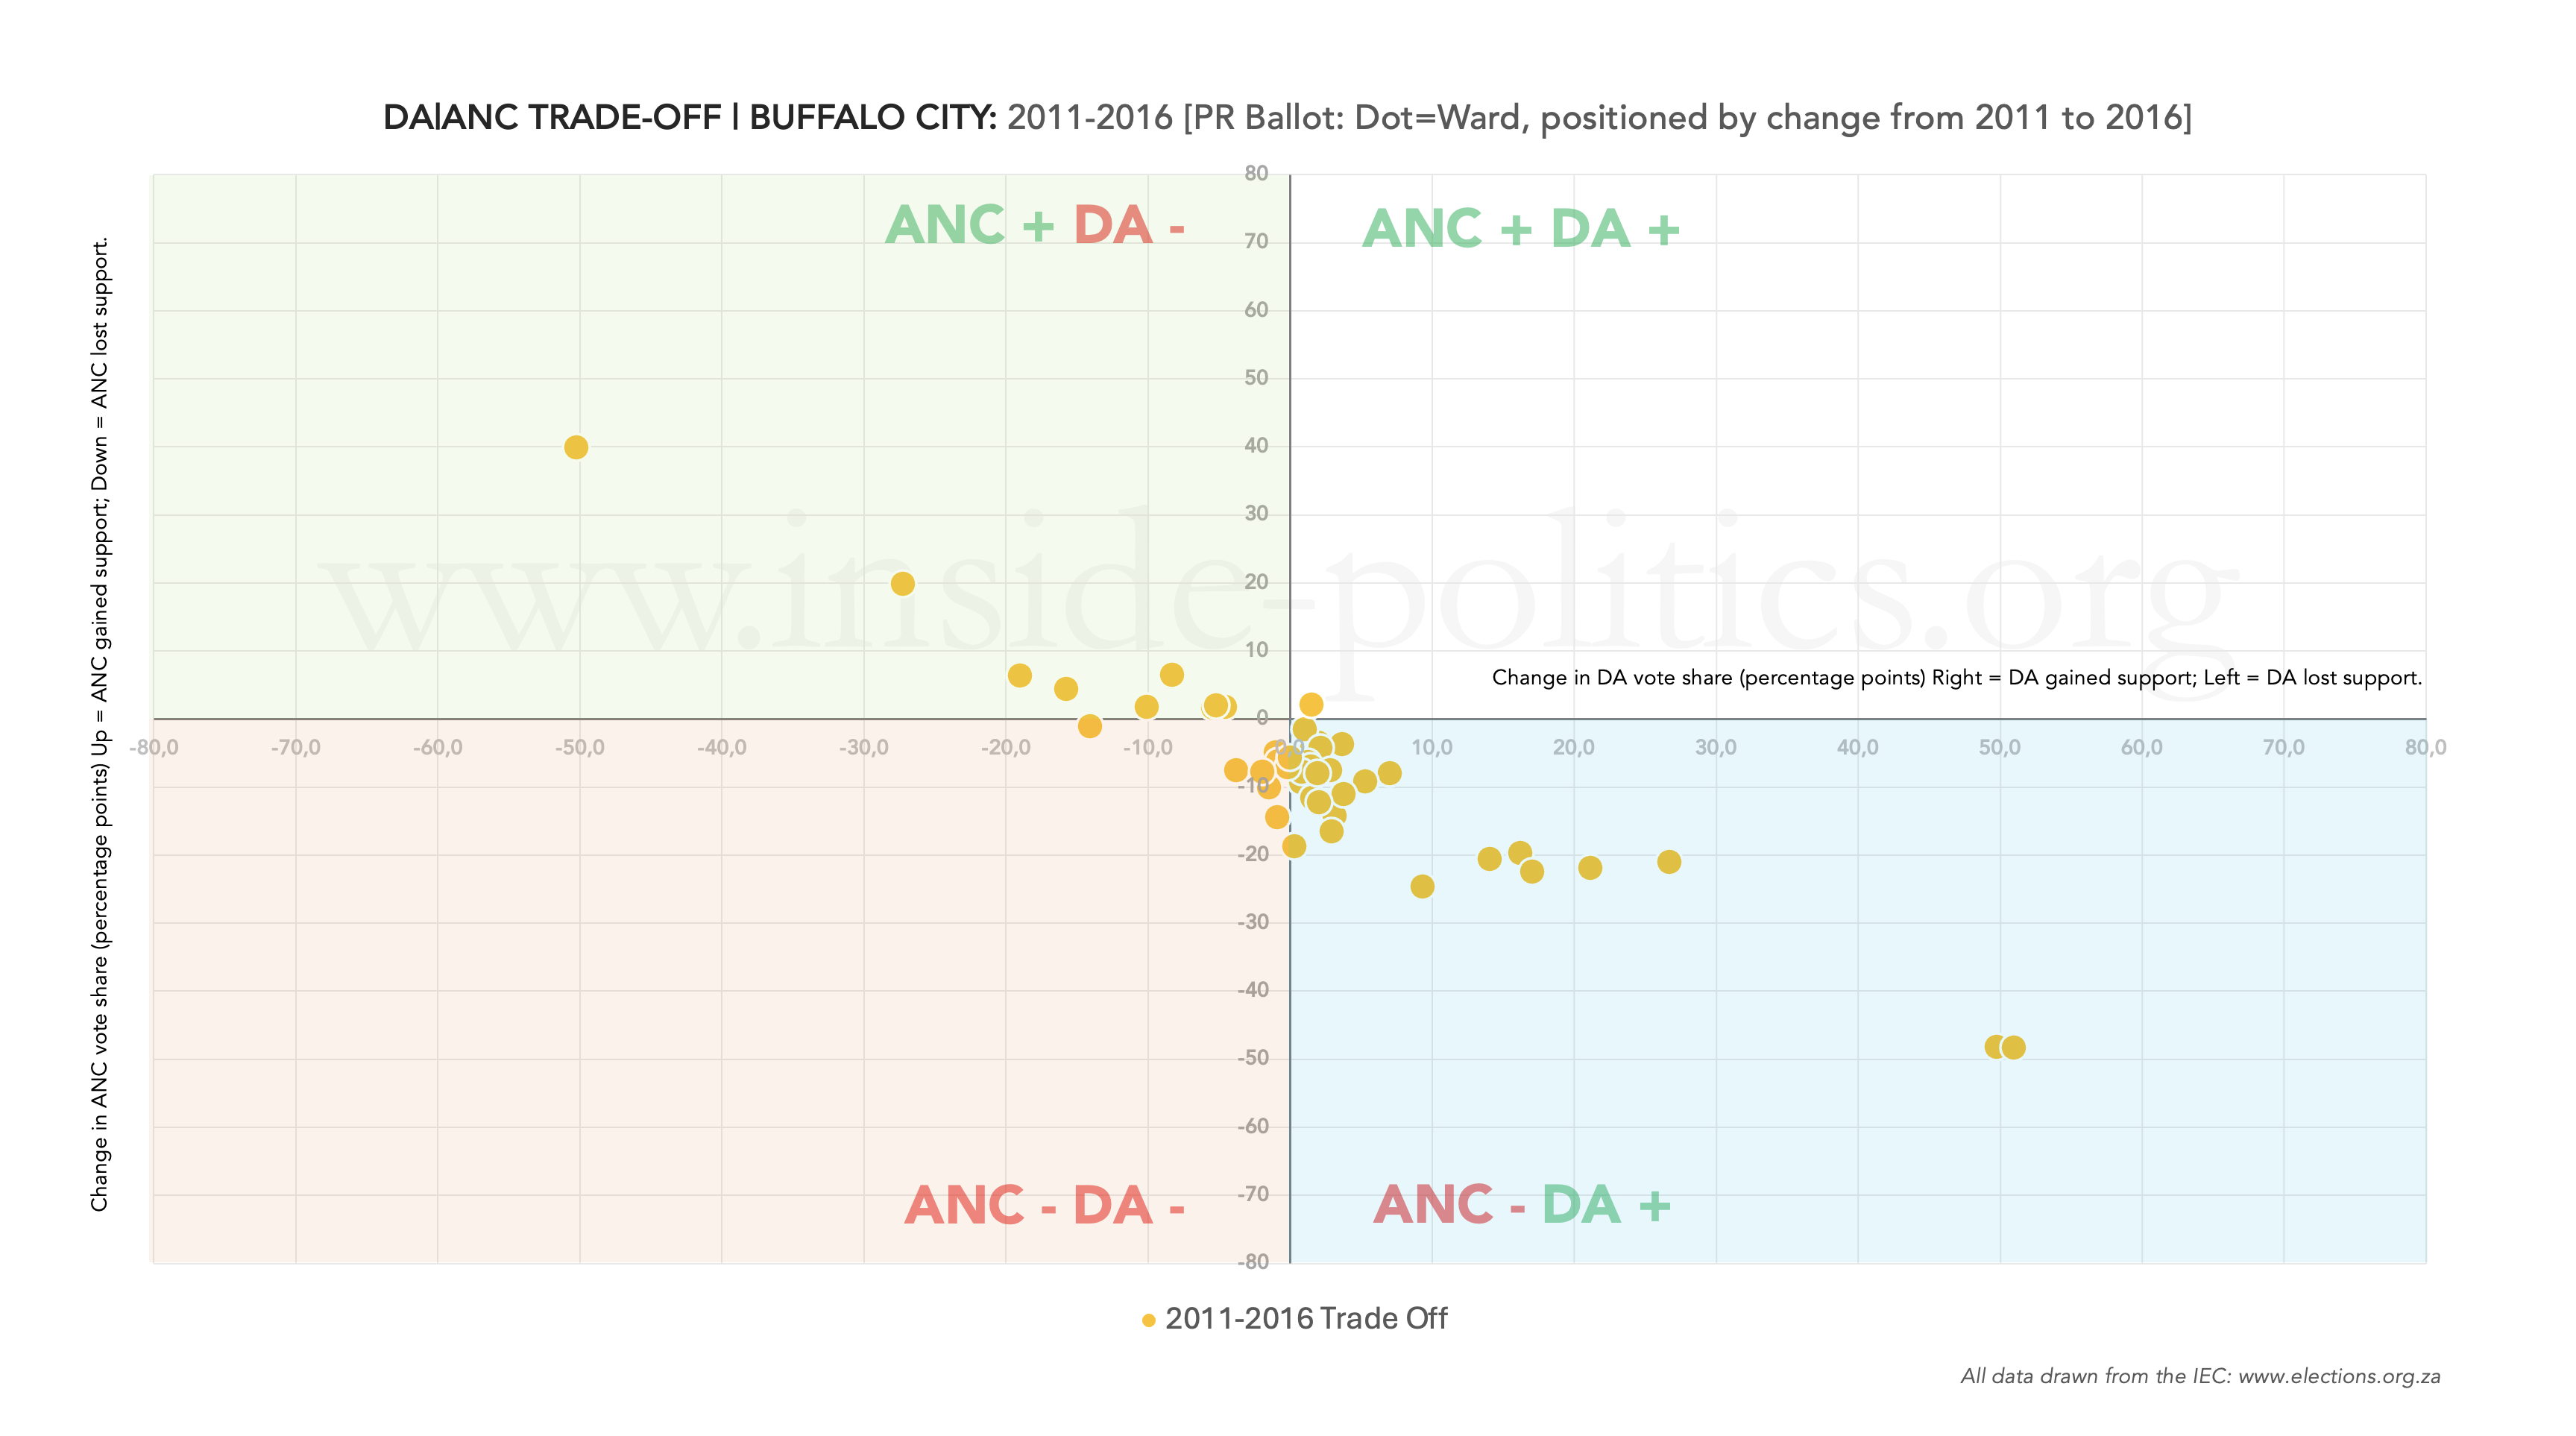
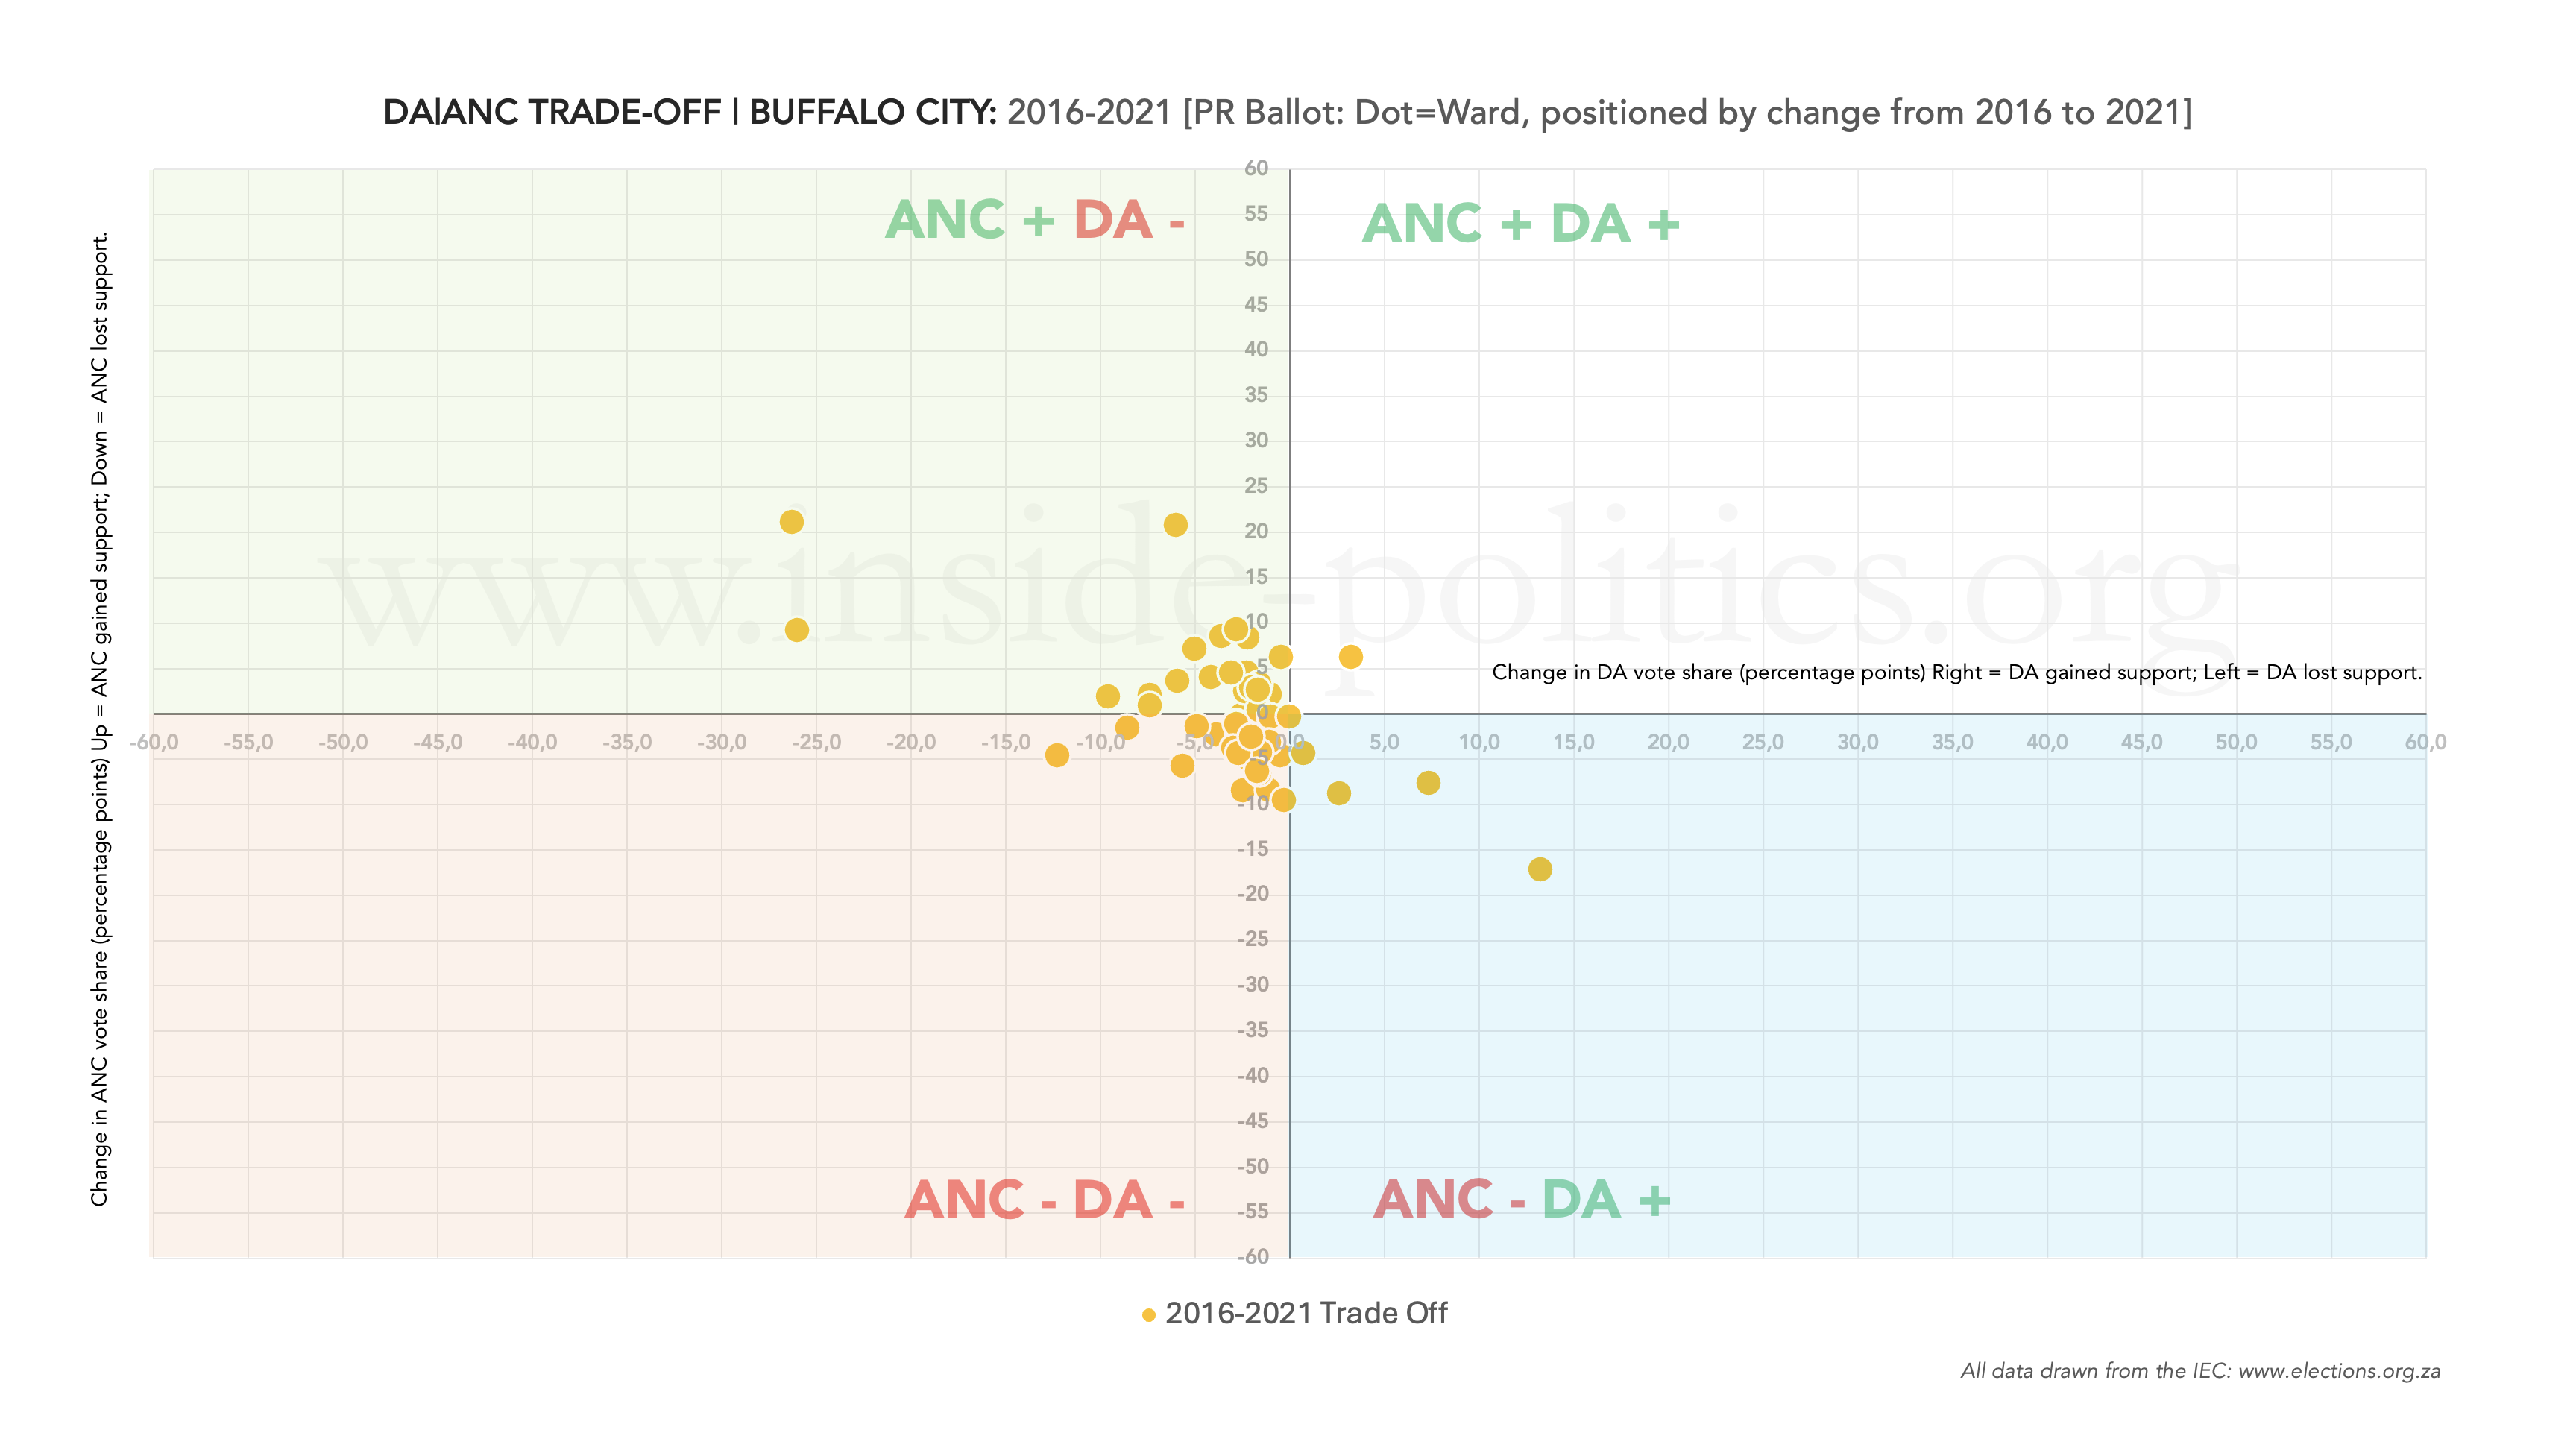
There were many ward boundary changes between 2000 and 2006, which explains much of the volatility in that period. The real story is the overall trend: both the ANC and the DA have systematically consolidated their support bases, with dots increasingly clustering toward the centre by 2021.
This tells us that the only real driver of change in Buffalo City is voter apathy. Both ANC and DA support are shrinking, but both are relatively impervious to shifting voters. People are opting out of voting rather than switching allegiance. The impact of parties like MK remains to be seen.
Conclusion
Buffalo City feels, in many ways, like the ANC’s last stand among the metros. It is the one place where a credible scenario exists in which the party emerges with 51%. That does not mean it is likely—only that it is possible. And that possibility alone sets Buffalo City apart.
The ANC’s majority is also protected by other factors: parties like the EFF and MK struggle in the Eastern Cape. Meanwhile, the DA seems to have reached a ceiling—unable to draw further support from the ANC and increasingly relying on simply turning out enough of its existing base to breach the 20% bracket again.
In this way, Buffalo City demonstrates—perhaps more clearly than any other metro—that the greatest threat to any ANC majority is the ANC itself, and the deepening apathy and alienation within its support base. That dynamic is the most likely cause of the ANC dropping below 50% in Buffalo City and, should that happen, it would mark the first time in democratic history that the ANC falls below 50% in every metro in a single election cycle
This essay is the 7th in an on-going series on Election 2026/7, for all other editions of this series, please click here: Election 2026/7
Discover more from inside politics
Subscribe to get the latest posts sent to your email.

You must be logged in to post a comment.