
Election 2026/7 [9] Johannesburg and the dire state of the ANC and DA engine rooms
by The Editor

An in-depth look at the ANC and DA strongholds in Johannesburg, and how they have performed over time. This essay relies on a series of heat maps, which illustrate ANC and DA support and, mapped over time, demonstrate the role these strongholds have played and where they stand, ahead of the next election.
Johannesburg and the state of the ANC and DA engine rooms
By: Gareth van Onselen
Follow @GvanOnselen
1 December 2025
This essay is the 9th in an on-going series on Election 2026/7, for all other editions of this series, please click here: Election 2026/7
Introduction
Just an update on where we are, in terms of resources. I have started uploading a series of heat maps for Johannesburg. I have been posting these directly to the blog, rather than sending them to the mailing list each time, because it seems to me that every update would become annoying for subscribers. This way, all maps are up for JHB, and you can access them via the resources page. They are an immensely powerful tool, and there is much we can do with them.
Tshwane will be next, following some analytical pieces on JHB.
Using those maps, I want to look at the condition of the ANC’s and DA’s “engine rooms” in Johannesburg. By which I mean the primary collection of ANC and DA strongholds that form the backbone of each party’s support. The maps allow us to easily identify these wards and track their performance.
For visual context, I would recommend looking at the ANC’s support maps for 2011–2024, and the DA’s respective maps for the same period. Both sets of maps show party support fading, especially in 2021 and 2024; so, how the parties’ engine rooms perform in 2026/7 is going to be all-important.
The ANC’s engine room
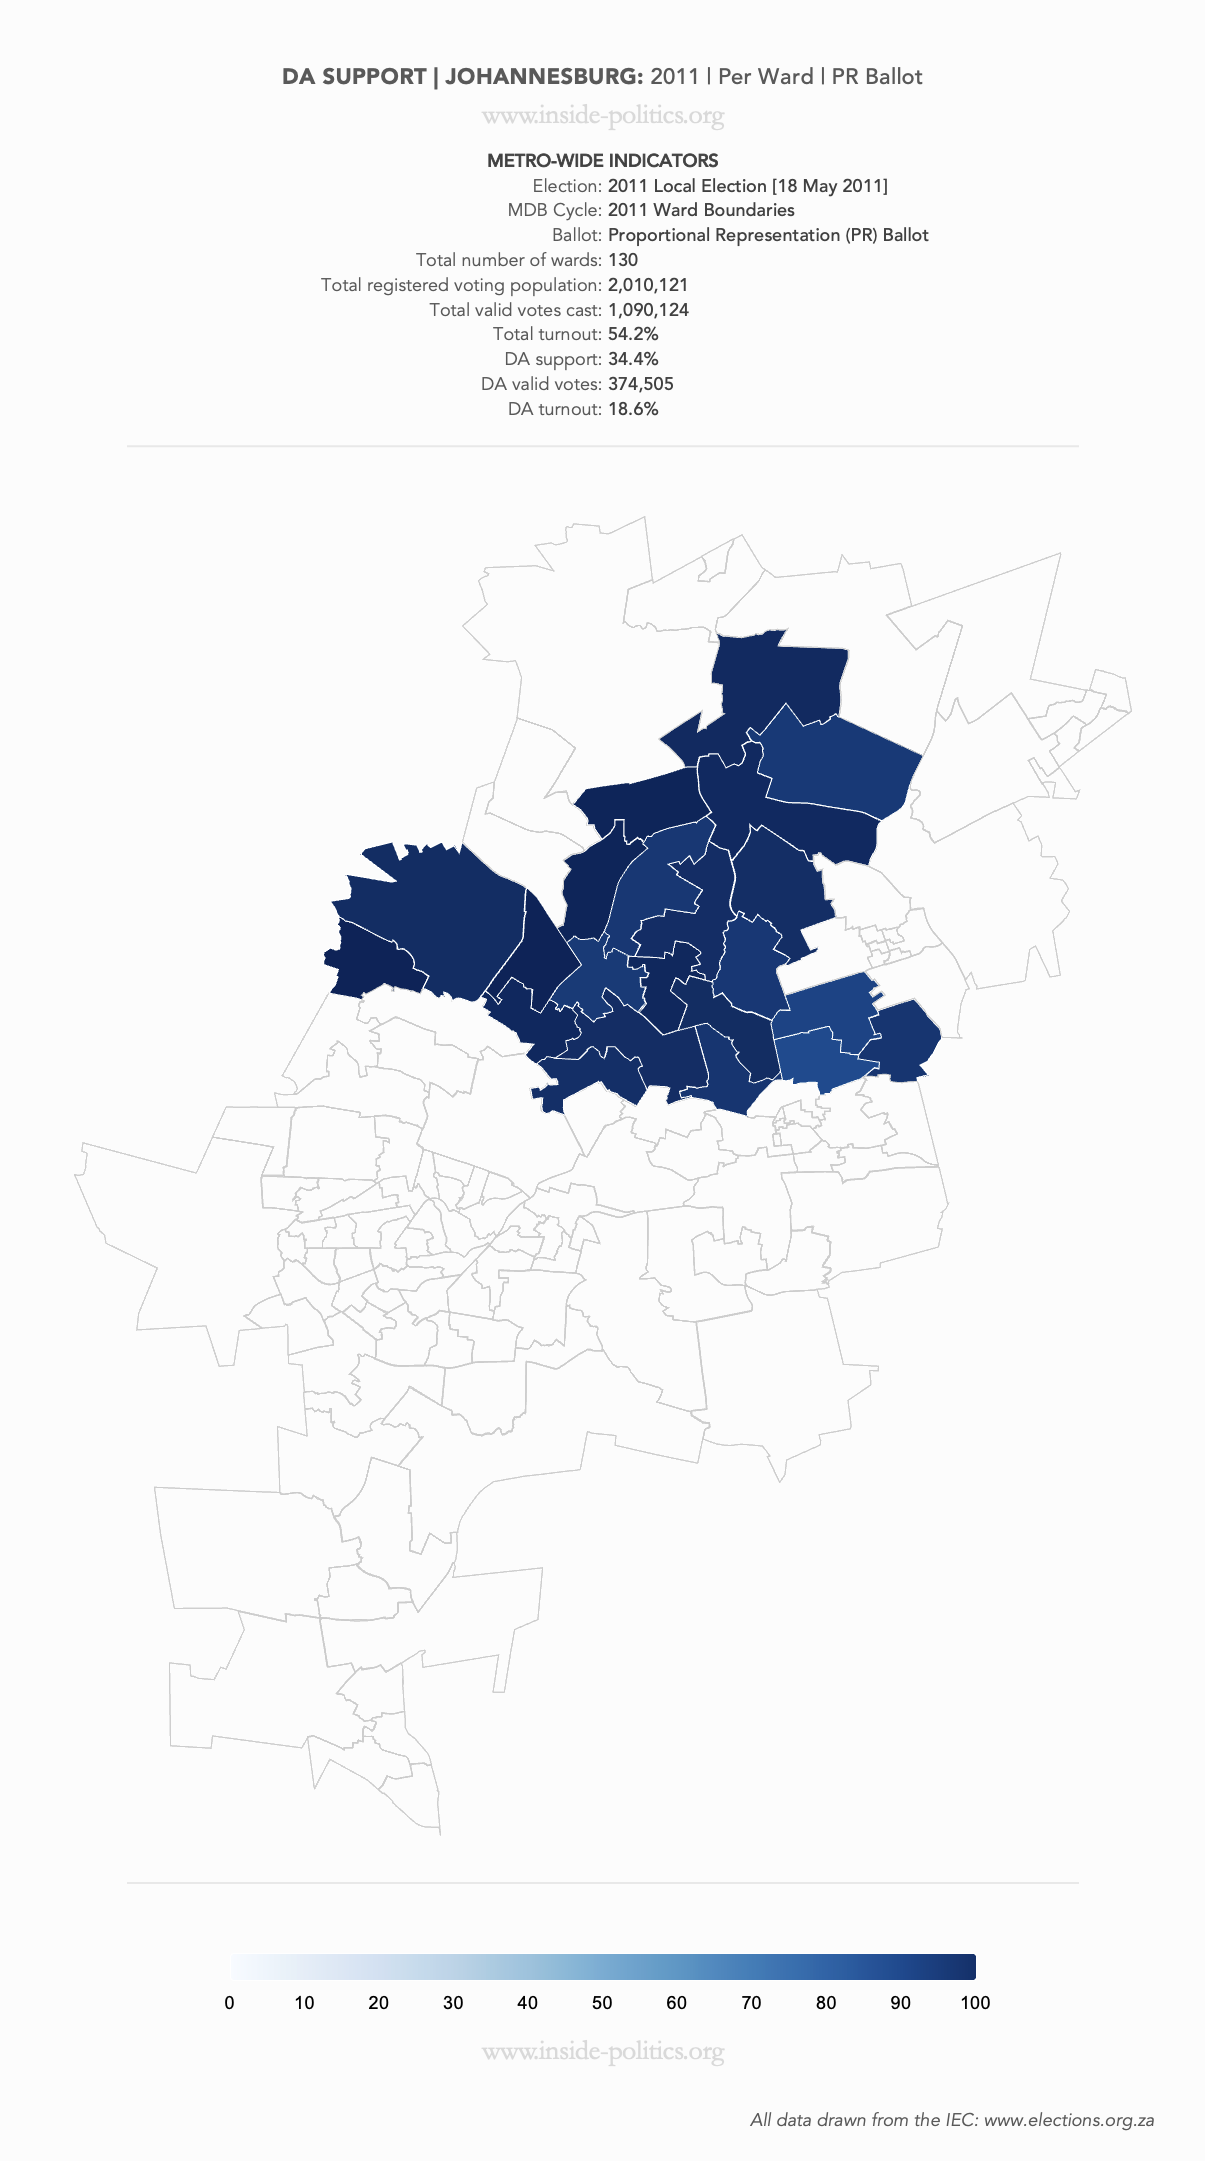
Below is a map of the ANC’s support in Johannesburg, by ward, for 2011.

It was a very good election for the party by local government standards, as it secured 59.3%, and you can clearly see its stronghold: that cluster of wards in deep dark green, around Soweto. The great thing about these maps is that we can isolate those wards, below, and look at them specifically.

Let’s take it a stage further, and crop those wards out, so we can see them clearly, as per below.

In 2011, that cluster comprised 41 wards, which formed the ANC’s engine room. For those familiar with Johannesburg’s political geography, which divides the metro up into regions, these generally fall in Region D (Soweto). For a full list of suburbs included, see here.
Those 41 wards delivered an average ANC support level of 86.8% between them in 2011 – 301,172 ANC votes out of a total of 347,063. The total number of votes in those 41 wards – 347,063 – represented 31.8% of all votes cast in Johannesburg in 2011. But, for the ANC, its 301,172 votes in that region represented 46.6% of all its votes in the metro. Almost half, and much higher than Soweto’s general share (31.8%). Historically, Region D has been a staggeringly powerful vote machine for the ANC.
So, let’s see how the ANC’s engine room performs over time. Here are six graphs that track that particular cluster of wards from 2011, through 2014, 2016, 2019, 2021, up until 2024. I have transformed them into a time-lapse, to save space.
Below is the graph you will see for each year in the time-lapse.

So, what does this tell us? For one, visually, you can see how much damage has been done, as the ANC’s engine room fades from a dark to much lighter green. The numbers on the graph quantify the problem: In 2011 those 41 wards delivered a combined 86.8%. By 2024 that had systematically dropped to 48.8%, a decline of 38 points (the top, light green line). The biggest dent came between 2019 and 2021, when the engine room dropped from 70.6% to 50.8%. But there was no recovery in 2024 (48.8%) and, given that was a national election in which the ANC typically does much better, that does not bode well for 2026/7 at all.
The dark green line tracks the total percentage of all ANC Johannesburg votes that the engine room has delivered. You will remember, in 2011, it was almost half of all ANC votes in the metro: 46.6%. By 2024 that had dropped to 40.9%, a decrease of 5.7 points. That might not seem like a lot, but it is. Consider this: The gap between the ANC’s engine room support and its total JHB support (medium green line) was 27.5 points in 2011. In 2024 it was 16.9 points.
So, there can be no doubt, the collapse of the ANC’s engine room has dramatically affected its general support levels. If the trend continues, it will begin to match ANC support levels outside the engine room, and the two lines will get much closer as party support bottoms out.
The DA’s engine room
Let us turn to the DA and identify its engine room. Visually, using its 2011 support map, below, it is relatively easy to locate.

The DA’s engine room, over time, is, however, a bit more fluid, as it is affected by ward boundary changes in a way the ANC’s was not. Nevertheless, let’s isolate those 2011 wards and try to track them as best we can.
Finally, here are those wards stripped out of the map, and shown close-up. The DA’s engine room is almost impossible to locate in terms of the metro’s regions. It is a law unto itself, and comprises almost all of Region B, and some of Regions A, C and E. I’ll call it Region B+ for the sake of brevity.
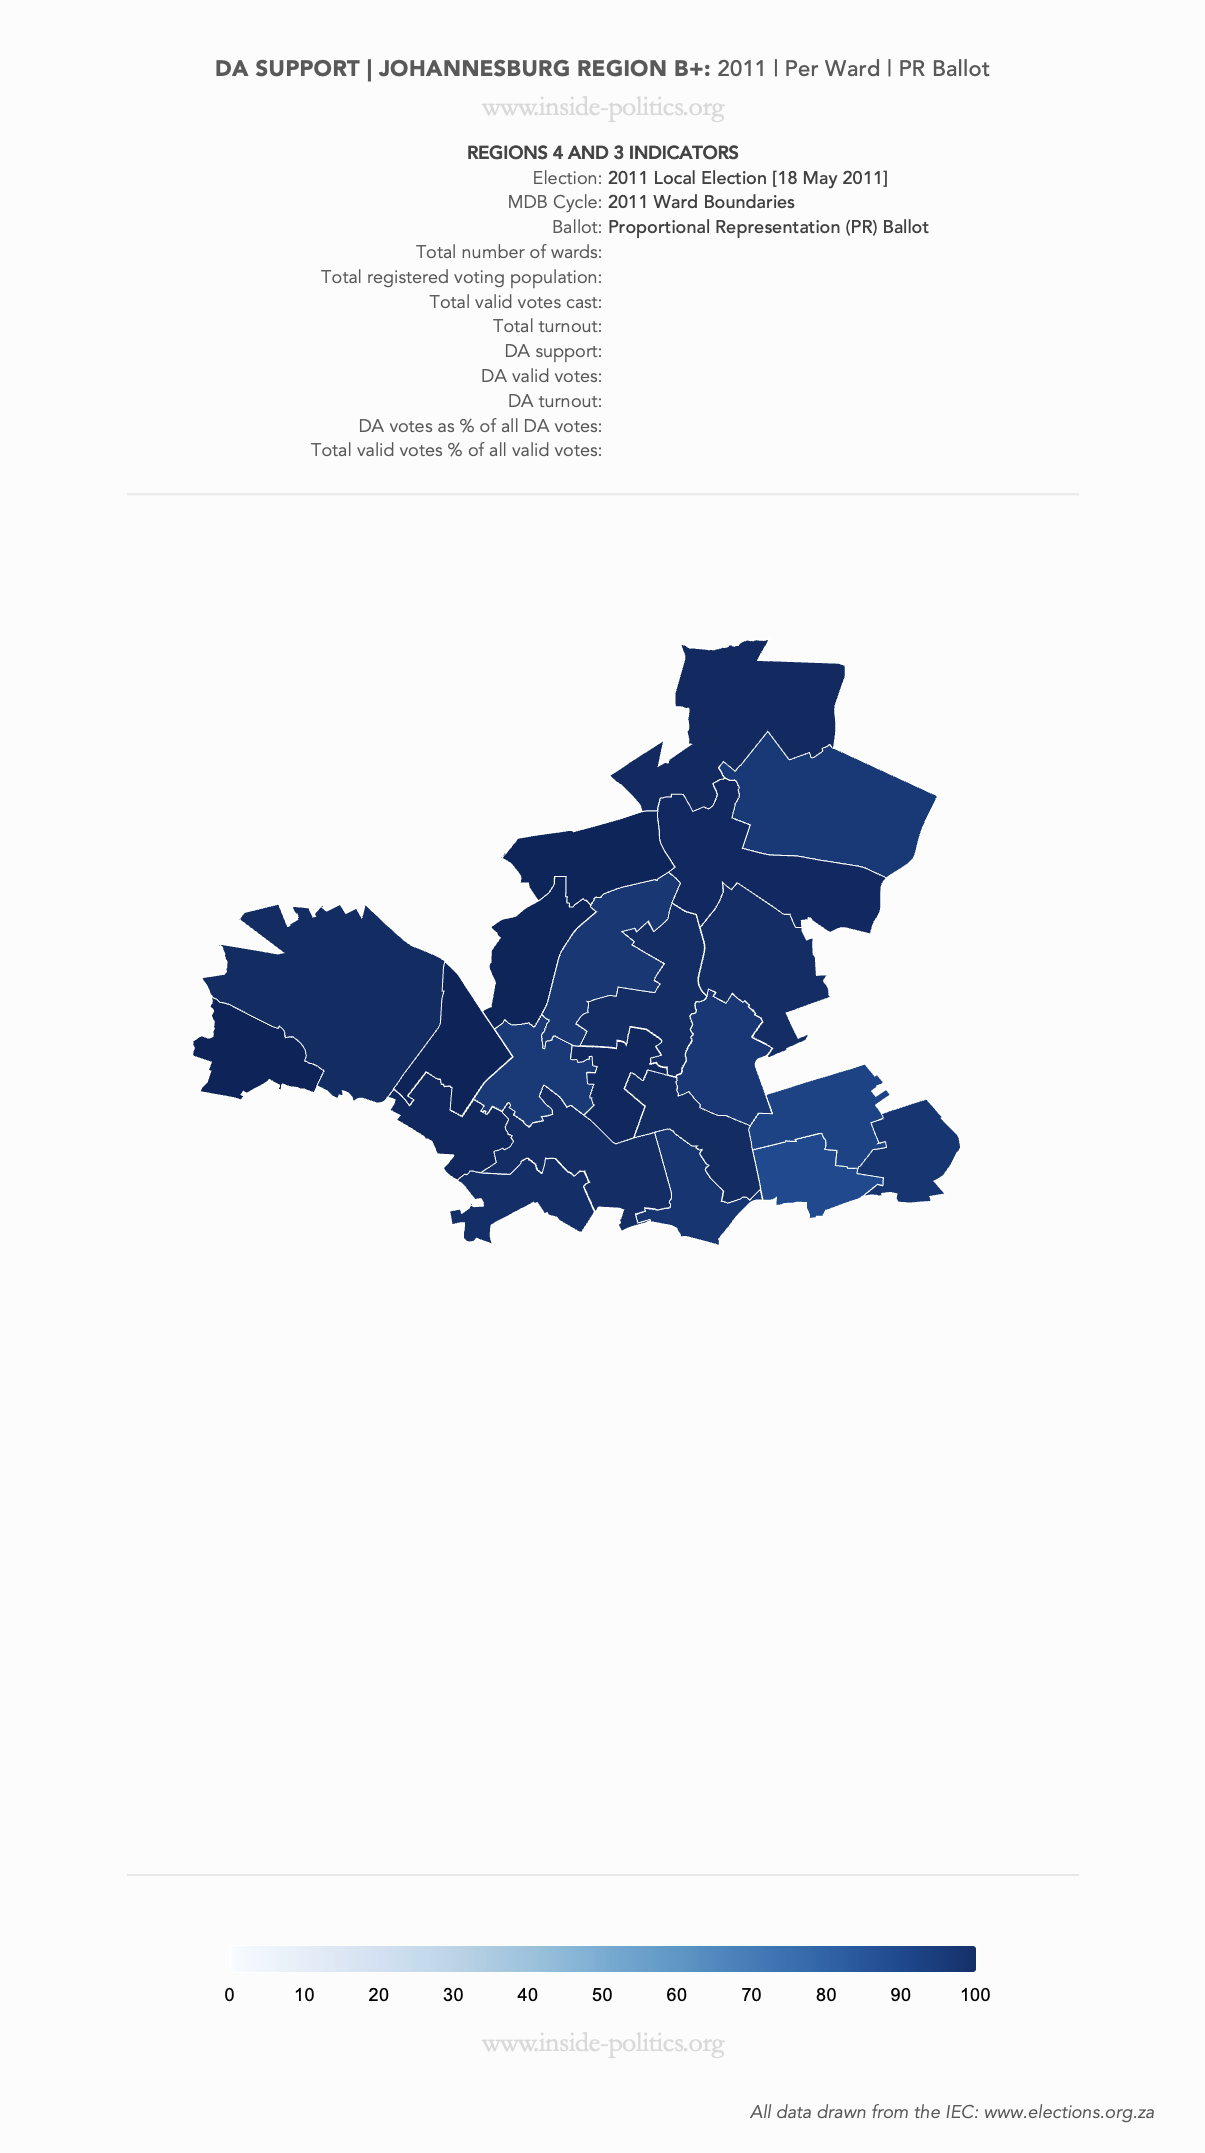
The DA’s engine room is smaller than the ANC’s. In 2011, it comprised 22 wards. But the other numbers are similar. Those 22 wards delivered an average DA support level of 81.2% – 169,156 DA votes out of a total of 208,370. The total number of votes in those 22 wards – 208,370 – represented 19.1% of all votes cast in Johannesburg in 2011. But, for the DA, its 208,370 votes in Region B+ represented 45.2% of all its votes in the metro. Almost half, just like the ANC’s engine room, and much higher than the cluster’s general share (19.1%). Historically, Region B+ has been the DA’s powerhouse.
To gauge its performance over time, here are those six graphs again – 2011–2024 – run as a time-lapse.
And below is the graph that appears in the Timelapse, for each year.

Visually you can see the same kind of ANC decline for the DA, as the maps fade to a lighter shade of blue over time, particularly in 2021 and 2024.
The one fundamental difference with the ANC’s trend lines, that hits you straight away, is the role Region B+ has played for the DA, as a percentage of all its Johannesburg votes (dark blue line). It has moved in exactly the opposite direction to the ANC. In 2011, Region B+ constituted 45.2% of all DA votes. In 2024, it constituted 51.8% (and in 2021, it was a staggering 56.4%). An increase of 6.6 points.
This would be a good thing – as it was in 2016 – if the party’s support was increasing. But it is not.
So, it must be read together with the fact that the average amount of support across Region B+ for the DA has dropped from a high of 83.2% in 2016, down to 62% in 2024, a decline of 21.2 points (light blue line). And, given that the DA’s general Johannesburg support has declined too (medium blue) – from 34.4% in 2011 to 24.9% in 2024 – the conclusion is that the DA is now both more reliant on its engine room, and its engine room is producing less .
In turn, this is a sure sign that, outside of its strongholds, the party is becoming less and less effective at winning support.
The party might take some relief from the fact that, in 2024, it reduced its reliance on its engine room (56.3% down to 51.8%), but there is a strong case to be made that, as its general support dropped too, this was not a case of things returning to normal, rather its trend line starting to match the ANC’s: general loss everywhere.
The DA, like the ANC, has real problems with its core support base.
Conclusion
One of the most important insights to be drawn from this analysis of both the ANC’s and DA’s engine rooms does not concern those strongholds themselves – although they are obviously important. Rather, each party’s performance outside of their engine rooms.
Strongholds comprise your core base; it is critical these constituents are catered for and communicated with, but a party shouldn’t need to convince them to vote, rather just enthuse them. If a party is healthy, and its core support strong, growth lies in those areas that are ambivalent: undecided voters. In a normal circumstances this is what a strong base buys you: the time and space to campaign on winning over new voters. In Johannesburg these are generally found on the metro’s periphery.
Thus, both the ANC and the DA have the same problem in Johannesburg: they are losing base support and, simultaneously, the battle for undecided voters. This is a nightmare situation for any party, just in logistical terms. It means you have to spend as much time and as many resources on your base as you do your political outreach. For many parties – and the ANC is particularly far down this path; the DA is just taking its first steps – this constitutes a vicious circle, from which there is no escape:
A declining base equals split resources, split resources equals less outreach, less outreach means less growth, and less growth equals more pressure.
You get the sense the ANC is too far gone to turn things around. The DA can still do that, but it really needs something profound, that fundamentally reignites its base and reaches into new markets. It has put all its money on Helen Zille. She will undoubtedly have some effect, particularly on the base. But how much? She inherits some very powerful trends, all headed in the opposite direction.
The DA is at its lowest point in Johannesburg: 24.9% as of 2024. With its local election bump, it will likely beat its 2021 performance (25%) but really, it is 2016 that is the real test of the party. That is when its decline started, and until it gets back up to those numbers, in the big picture, it will remain in the red. It is one thing to slow down decline, quite another to generate real growth.
Resources relevant to this essay:
- Election 2026/7 [1] Turnout, Johannesburg, the ANC and DA
- ANC Support | By Ward
- DA Support | By Ward
This essay is the 9th in an on-going series on Election 2026/7, for all other editions of this series, please click here: Election 2026/7
Discover more from inside politics
Subscribe to get the latest posts sent to your email.

You must be logged in to post a comment.