
Election 2026 [19] A look at the SRF’s market research ahead of the 2026 LGEs
by The Editor

What follows is an in-depth overview of the Social Research Foundation’s (SRF) polling (conducted by Victory Research, of which I am the CEO), ahead of the 2026 local government elections. The SRF has been kind enough to let me apply my mind to it publicly.
A look at the SRF’s market research ahead of the 2026 LGEs
By: Gareth van Onselen
Follow @GvanOnselen
10 November 2026
This essay is the 19th in an on-going series on Election 2026/7, for all other editions of this series, please click here: Election 2026/7
What follows is an in-depth overview of the Social Research Foundation’s (SRF) polling (conducted by Victory Research, of which I am the CEO), ahead of the 2026 local government elections. The SRF has been kind enough to let me apply my mind to it publicly.
A proviso upfront: This analysis is not for those online soothsayers, who believe in magic, and hold that every poll, no matter when it was conducted, or the margin of error, should accurately predict exactly the future outcome to within 0.1pts, otherwise it is of little value. It is, rather, for serious people, who appreciate market research, understand its limitations, and able to draw value out the trends and patterns that emerge from it.
Introduction
I am going to avoid methodology for the most part here, the details of every poll are in the graphs that follow.
As an overview, the SRF conducted four polls which had the 2026 LGE as their focus (the test being, these four polls switched from a national ballot question to a local government ballot question). They were
- November 2025 (field work in October): 1,002 respondents, MoE of 4%, conducted nationally (no metro subsamples), modelled for 52.8% turnout.
- March 2026 (field work in April): 2,222 respondents, MoE of 2,1%, conducted nationally, with subsamples for three metros: JHB, TSH and ETH. (National modelled for 54.1% turnout, JHB, n=503, MoE 4.4%, 52.2%; TSH, n=510, MoE 4.4%, 53.7%; ETH n=503, MoE 4.4%, 56.5%)
- July 2026 (field work in June): 2,214 respondents, MoE of 2,1%, conducted nationally, with subsamples for three metros: JHB, TSH and ETH. (National modelled for 52.9% turnout, JHB, n=504, MoE 4.4%, 53.1%; TSH, n=508, MoE 4.4%, 54.5%; ETH n=500, MoE 4.4%, 54.5%)
- September 2026 (field work in July/August): 3,100 respondents, MoE of 1,8%, conducted nationally, with subsamples for three metros: JHB, TSH and ETH.
- (JHB, n=800, MoE 4.0%; TSH, n=800, MoE 4.0%; ETH n=800, MoE 4.0%). All four elements were modelled for approximately 40%, 45% and 50% turnout (exact numbers in graphs).
Thus, we have four polls for the national numbers, and three polls for the metro numbers. These four polls were conducted over a period of approximately 354. The last one coming out the field with 25 days to go before the election.
LGEs are far more volatile than NPEs, particularly in metros, which have smaller populations than provinces and much more competition (this year saw record numbers of parties competing). You will notice substantive changes in many of the metro graphs. Ideally, you would want a tracking poll that runs up to Election Day, to better measure of final shifts over the last month, but that tool was not available this election. So there remains a 25-day window at the end of all graphs, that is unaccounted for.
National
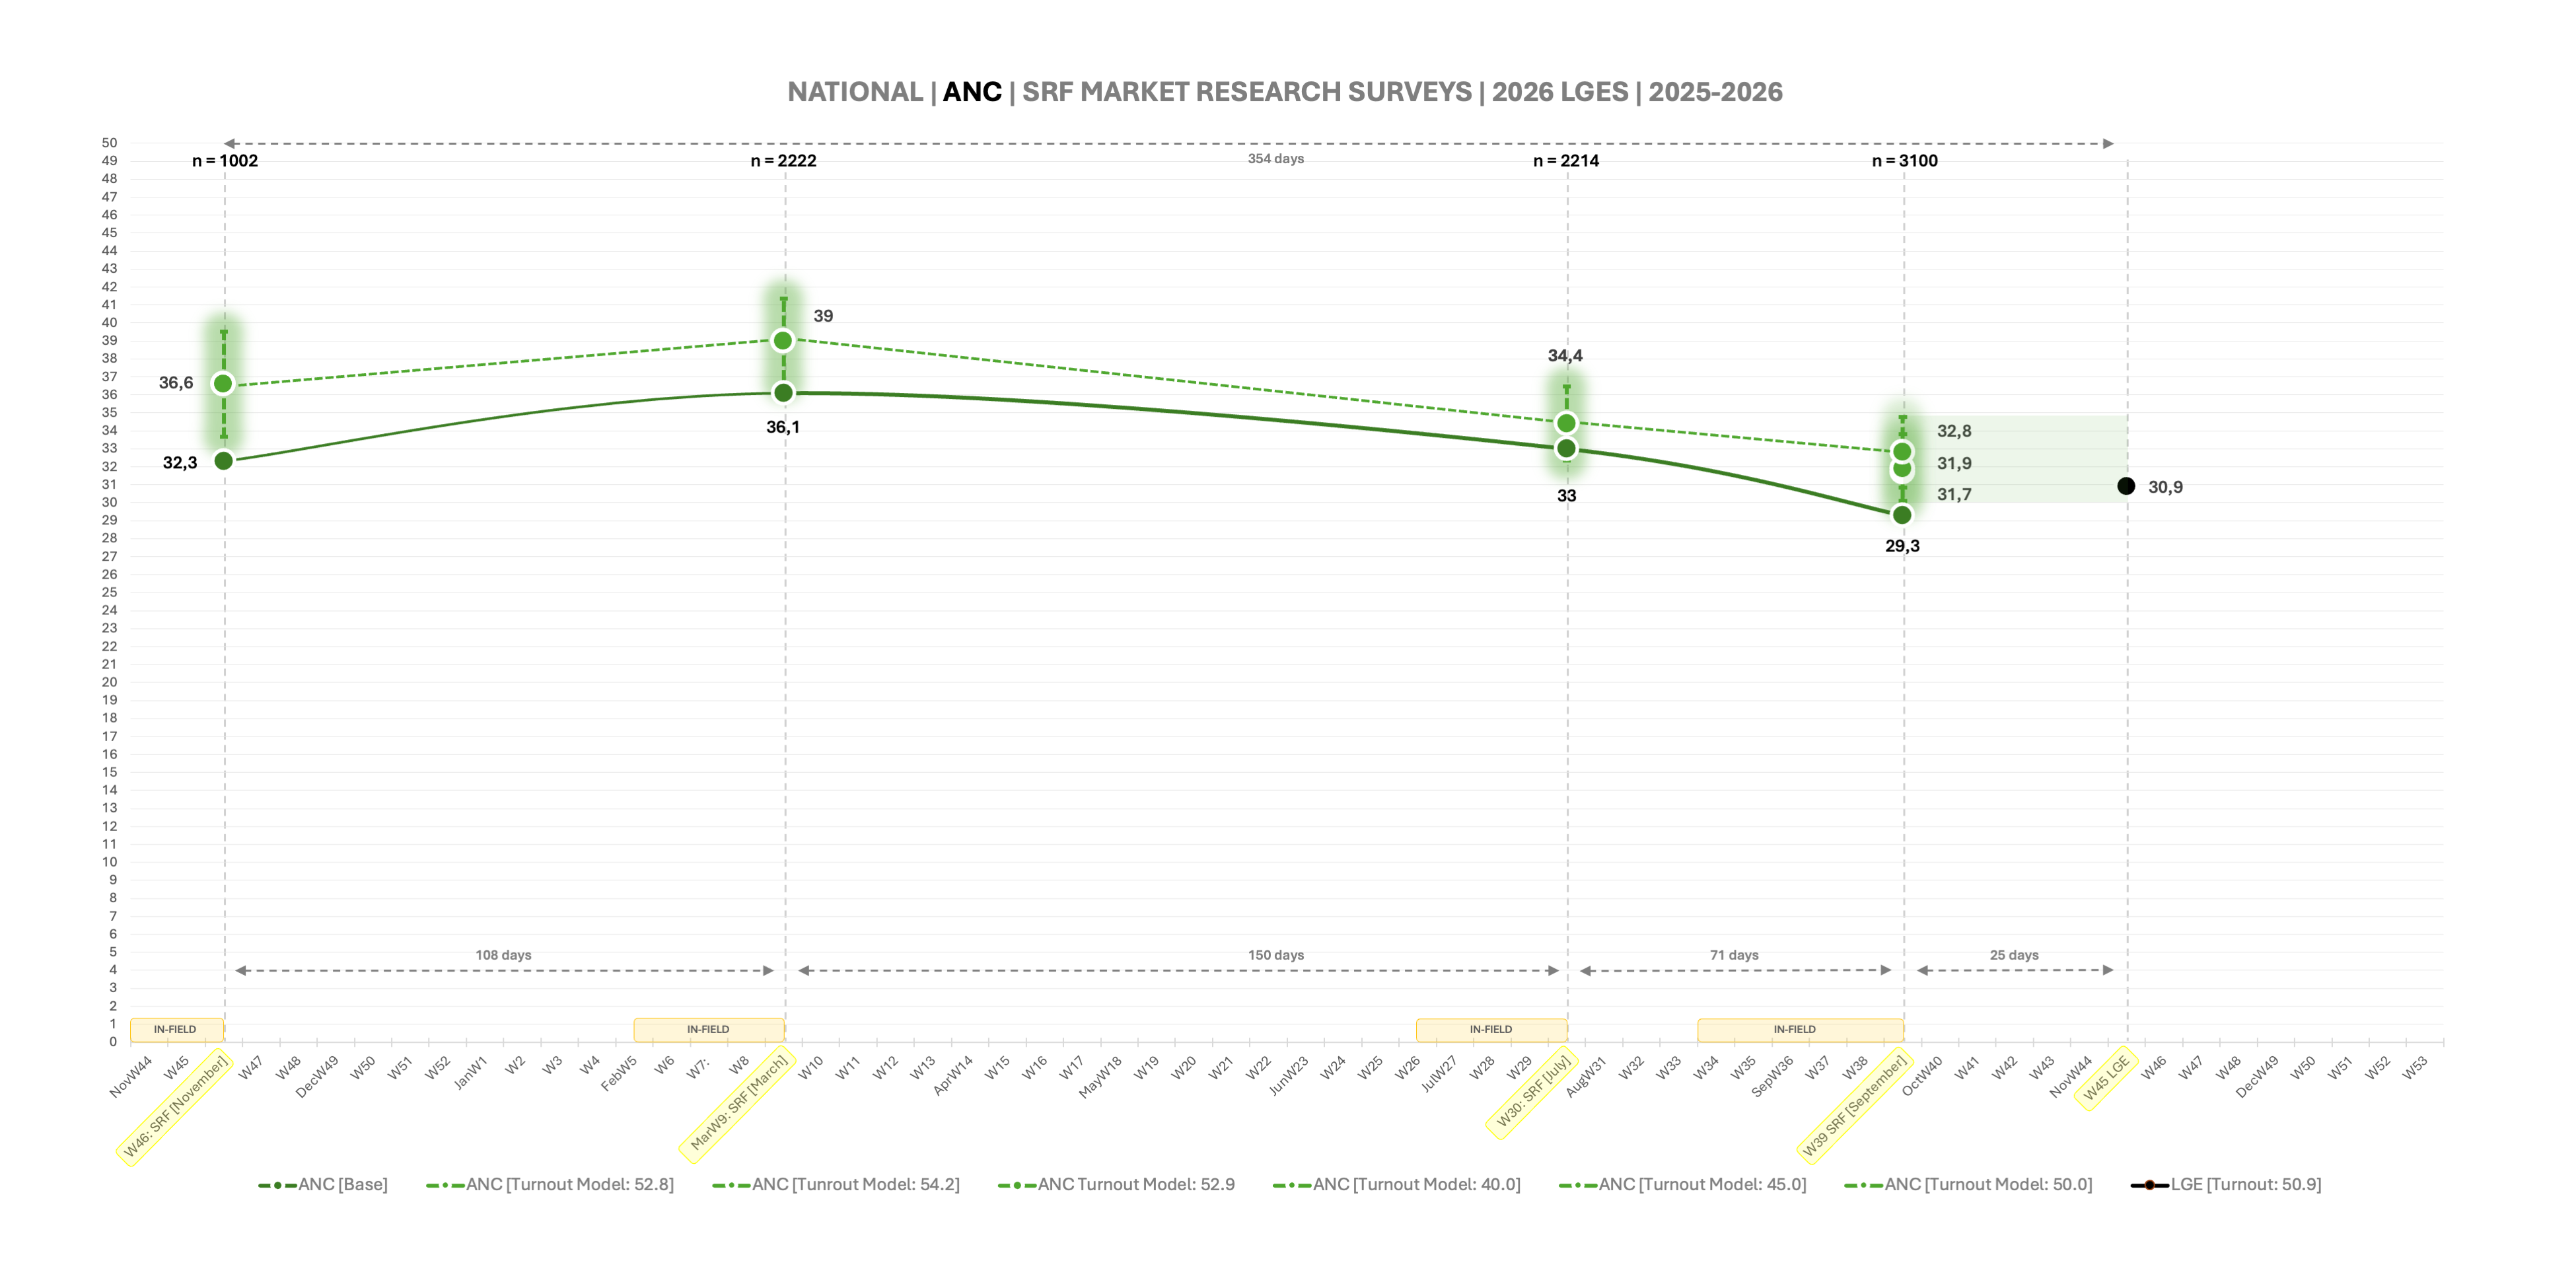
Here are the numbers for the seven largest parties nationally: The ANC, DA, MK, EFF, ASA, IFP and FF+.
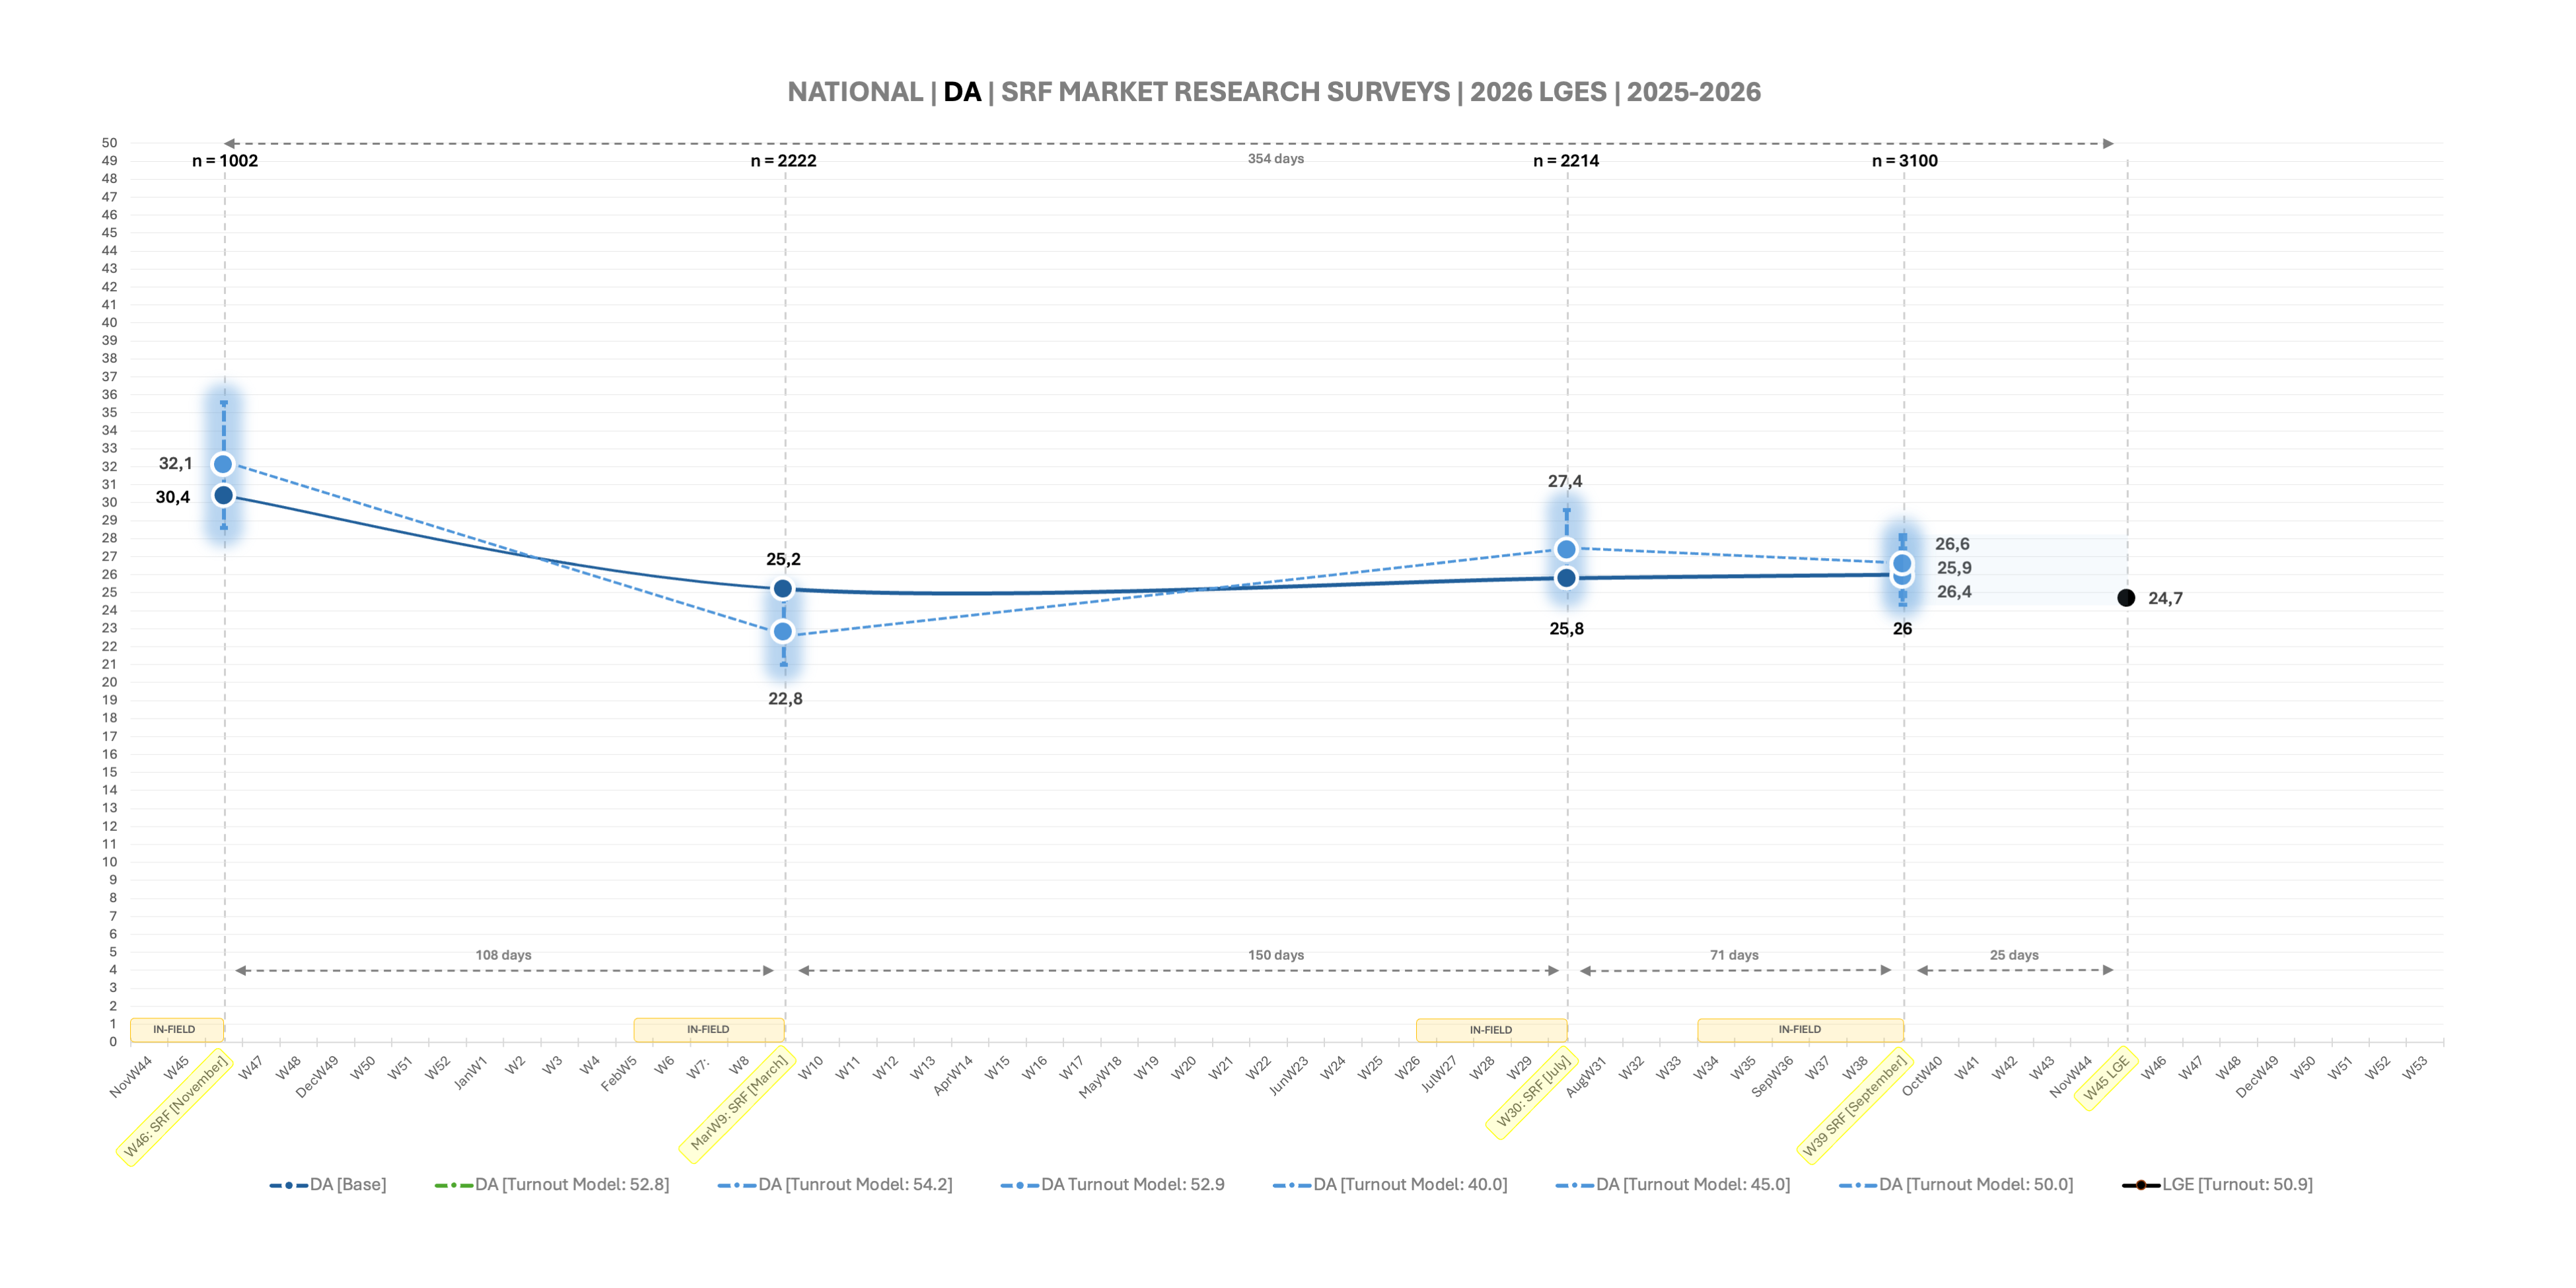
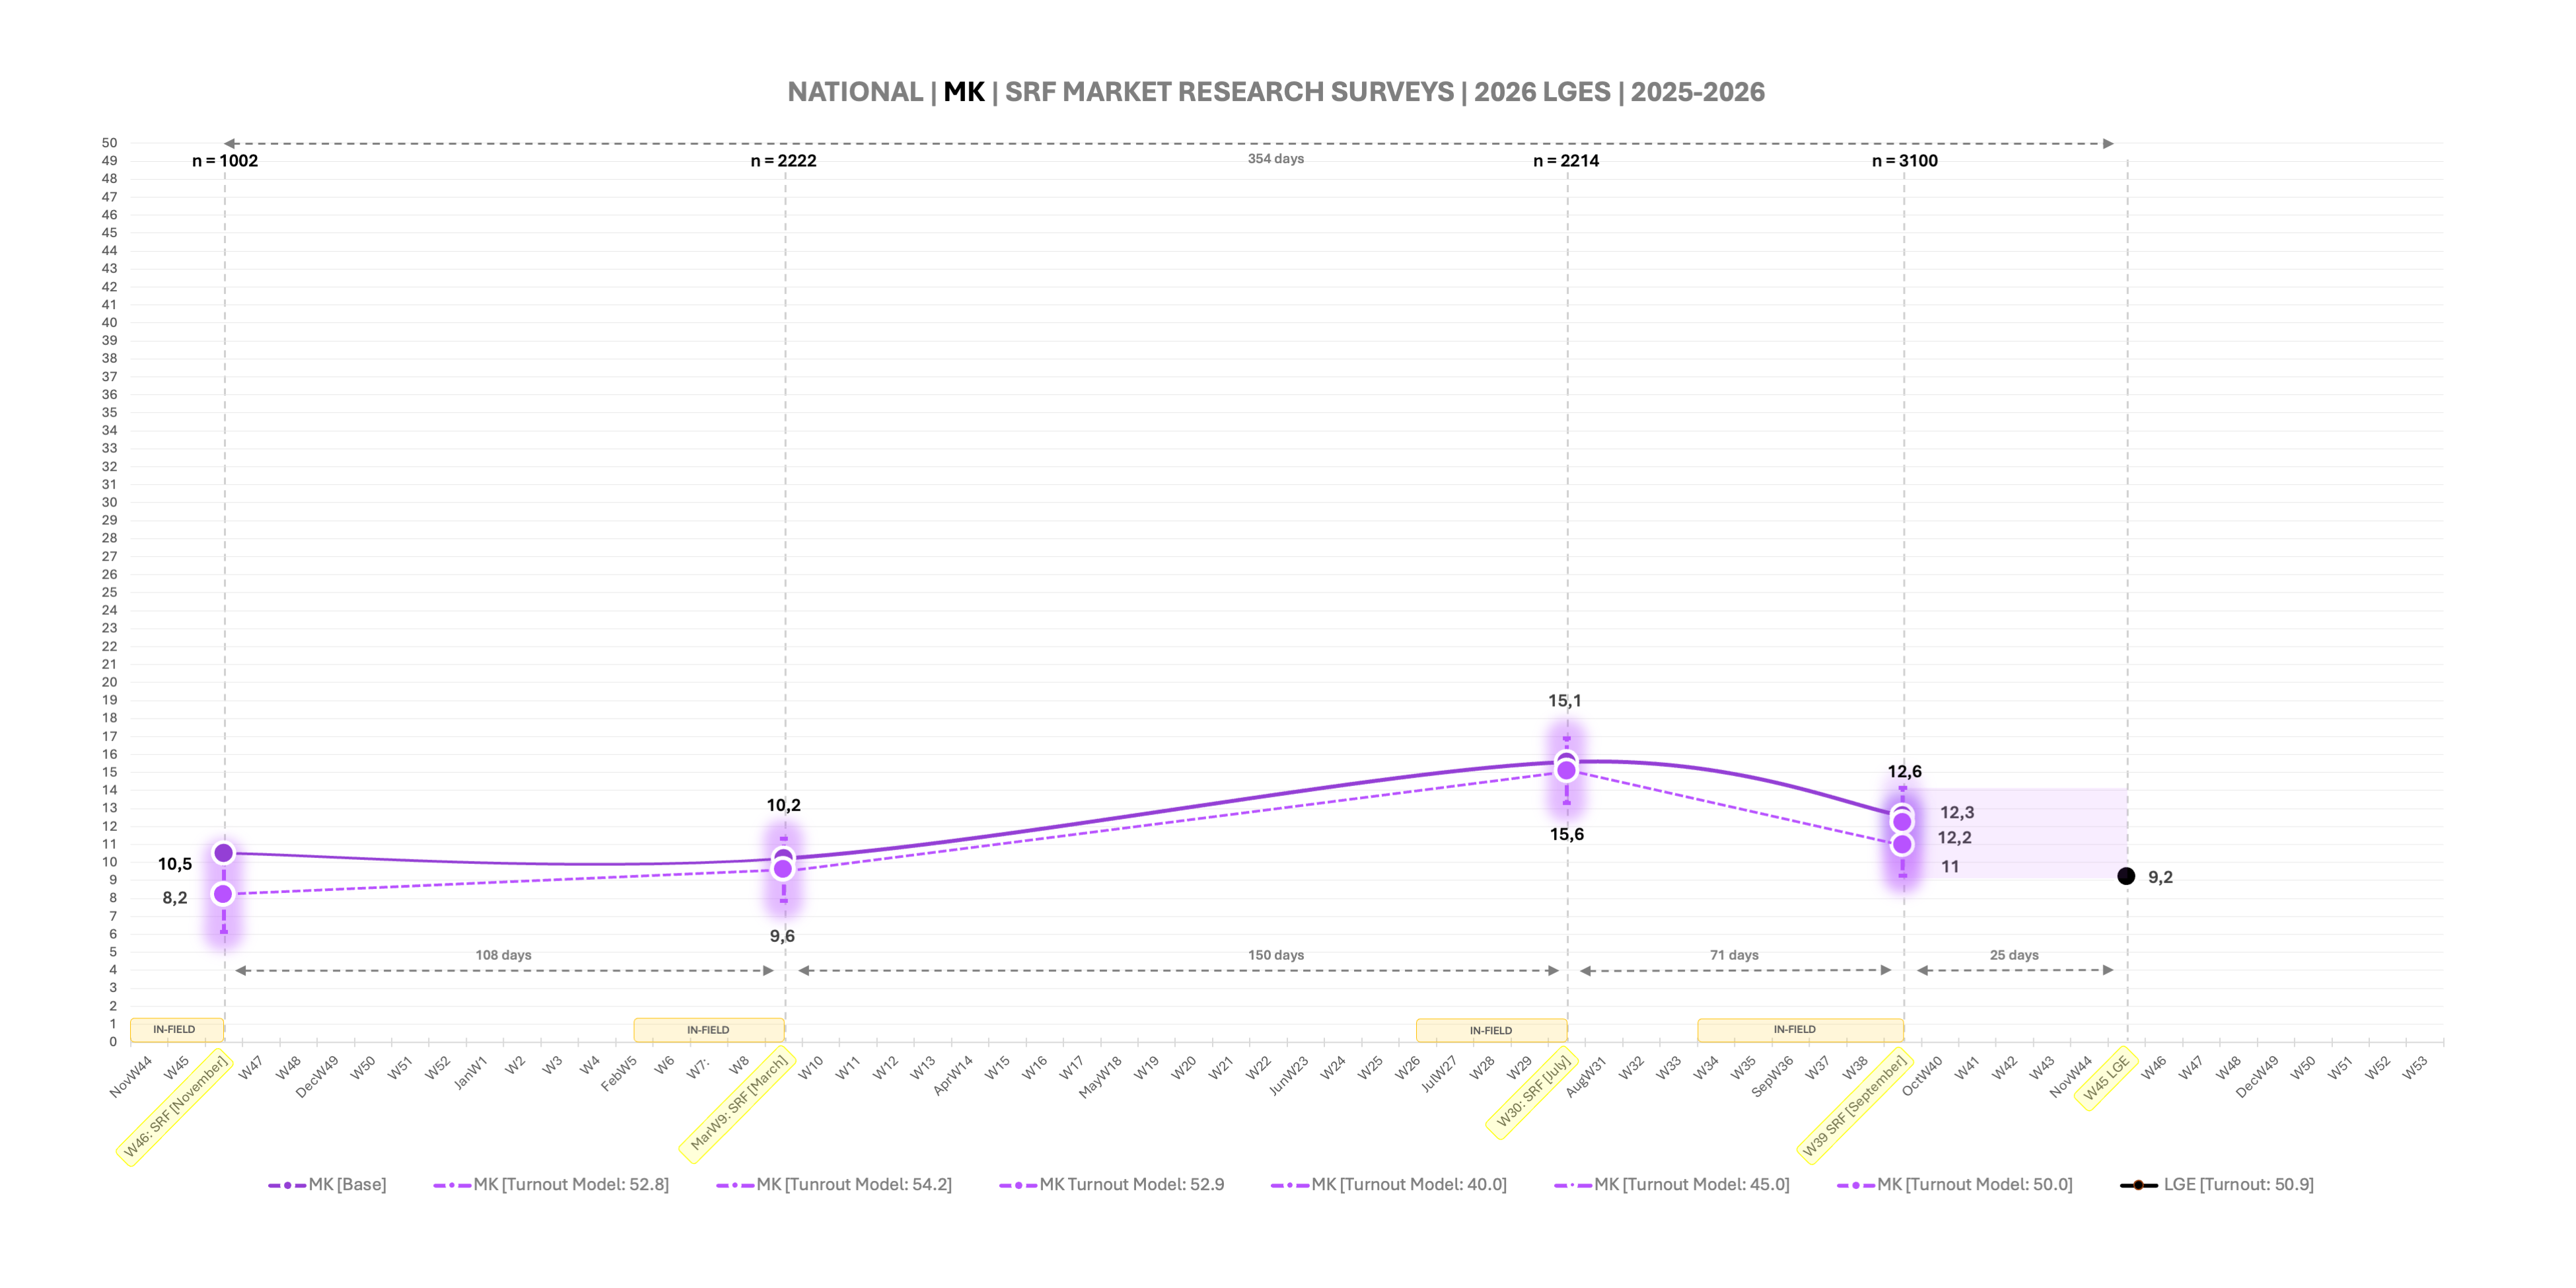
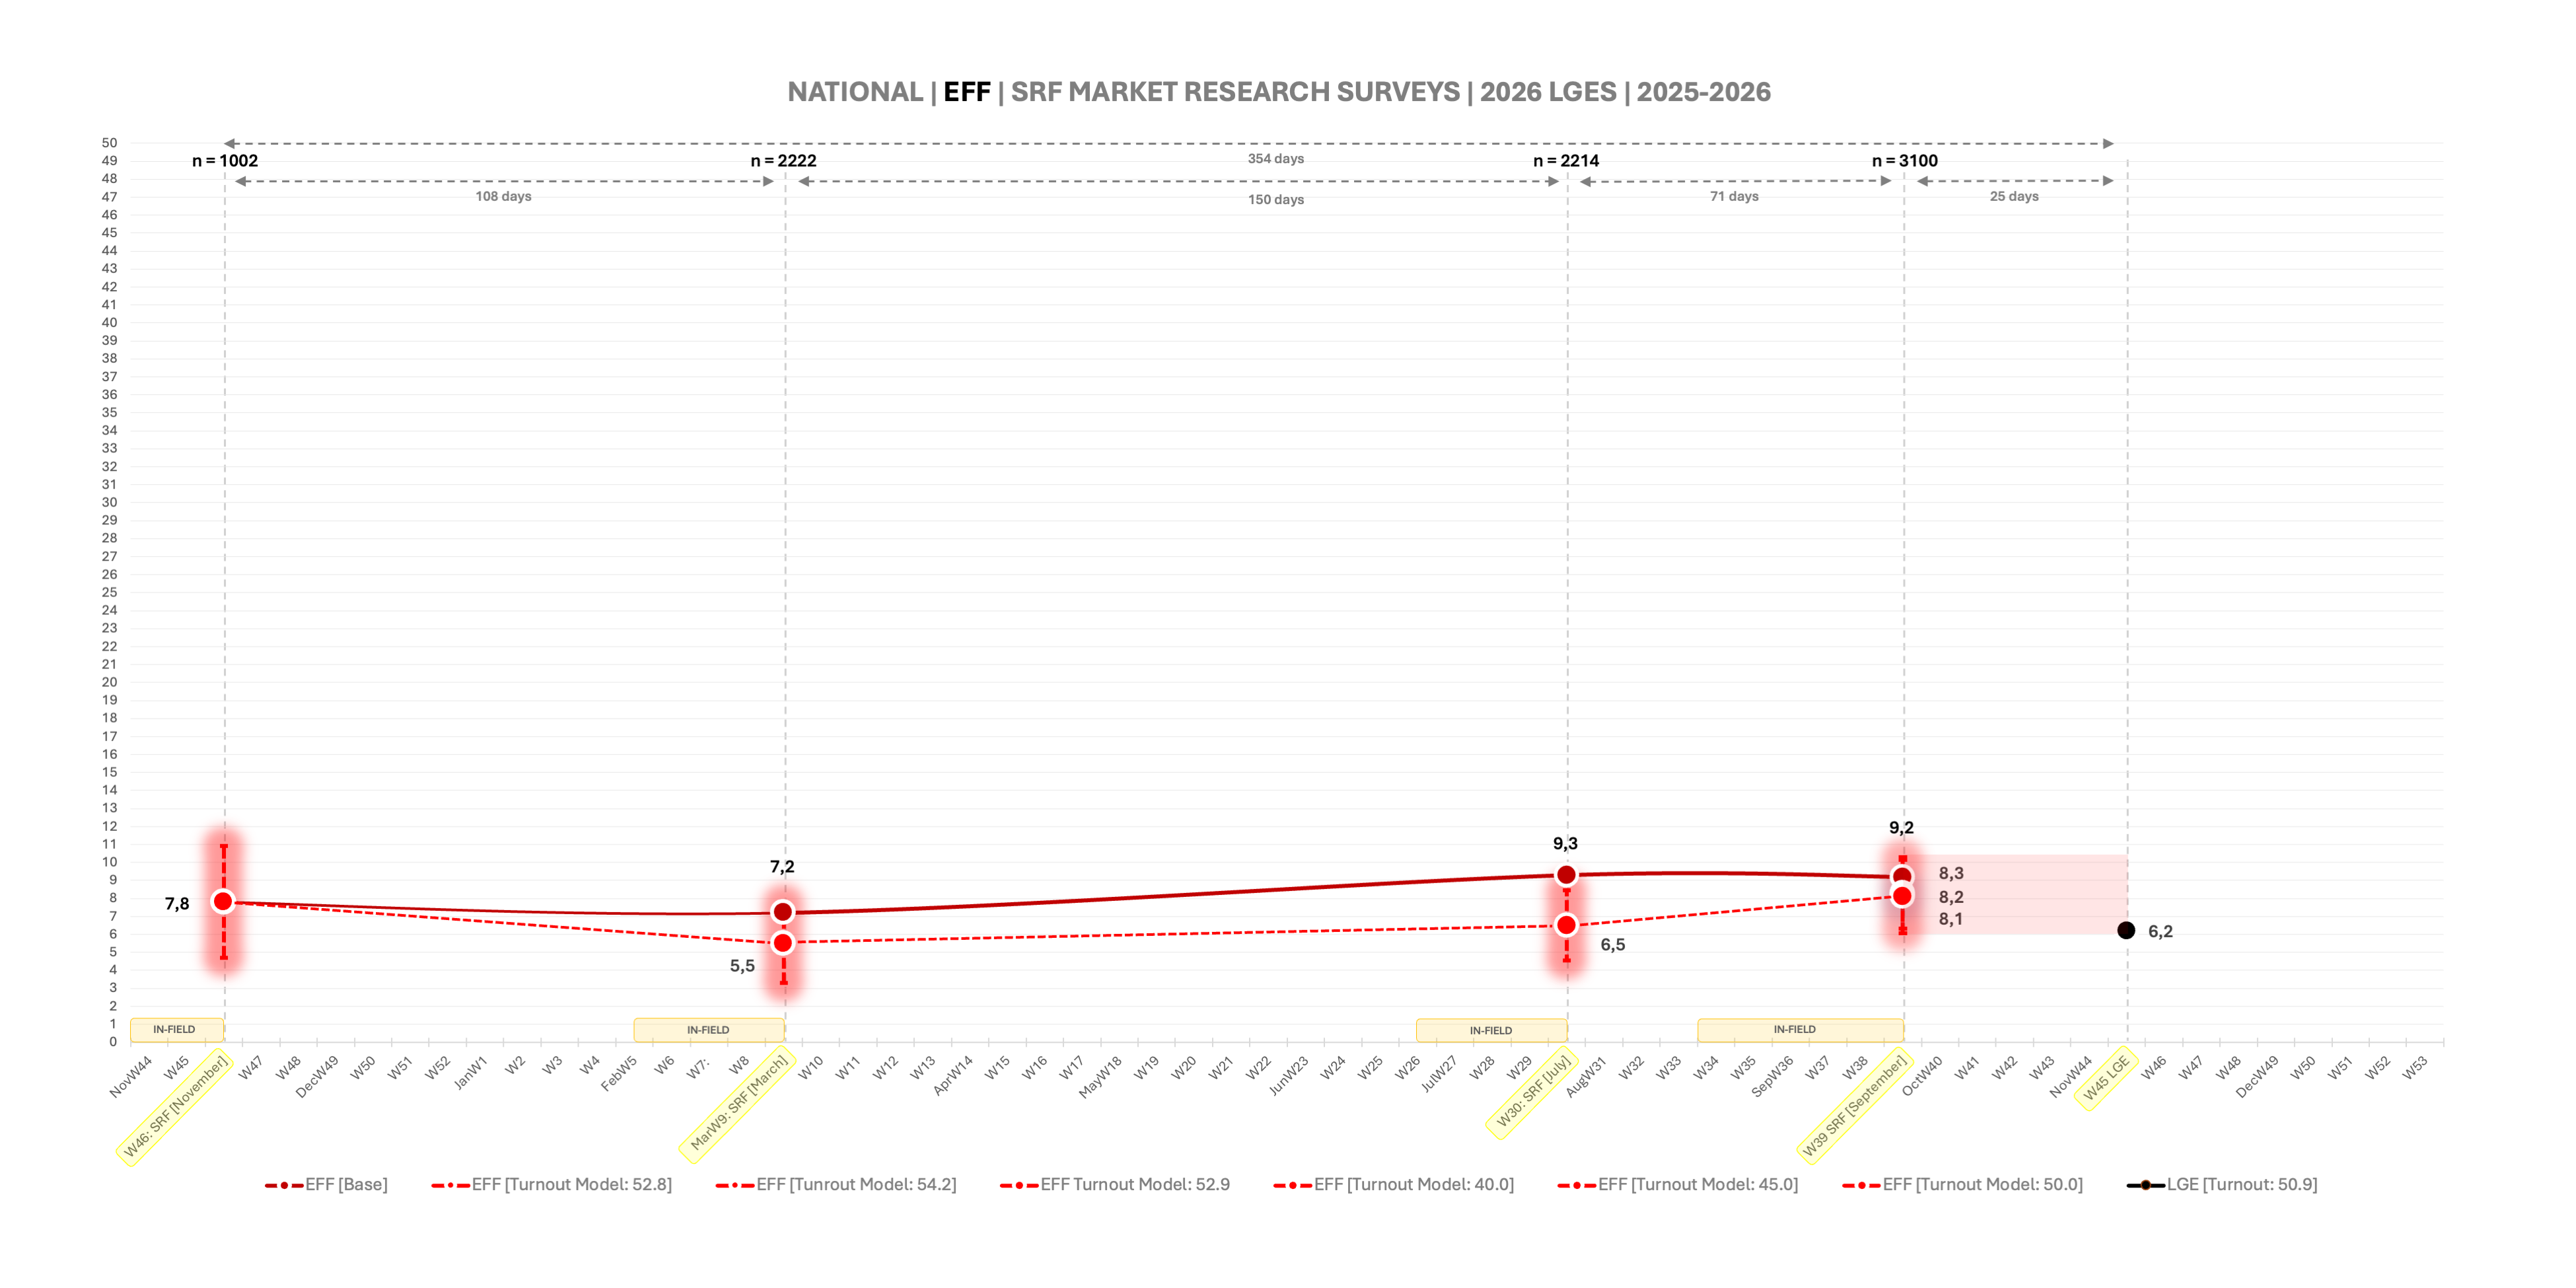
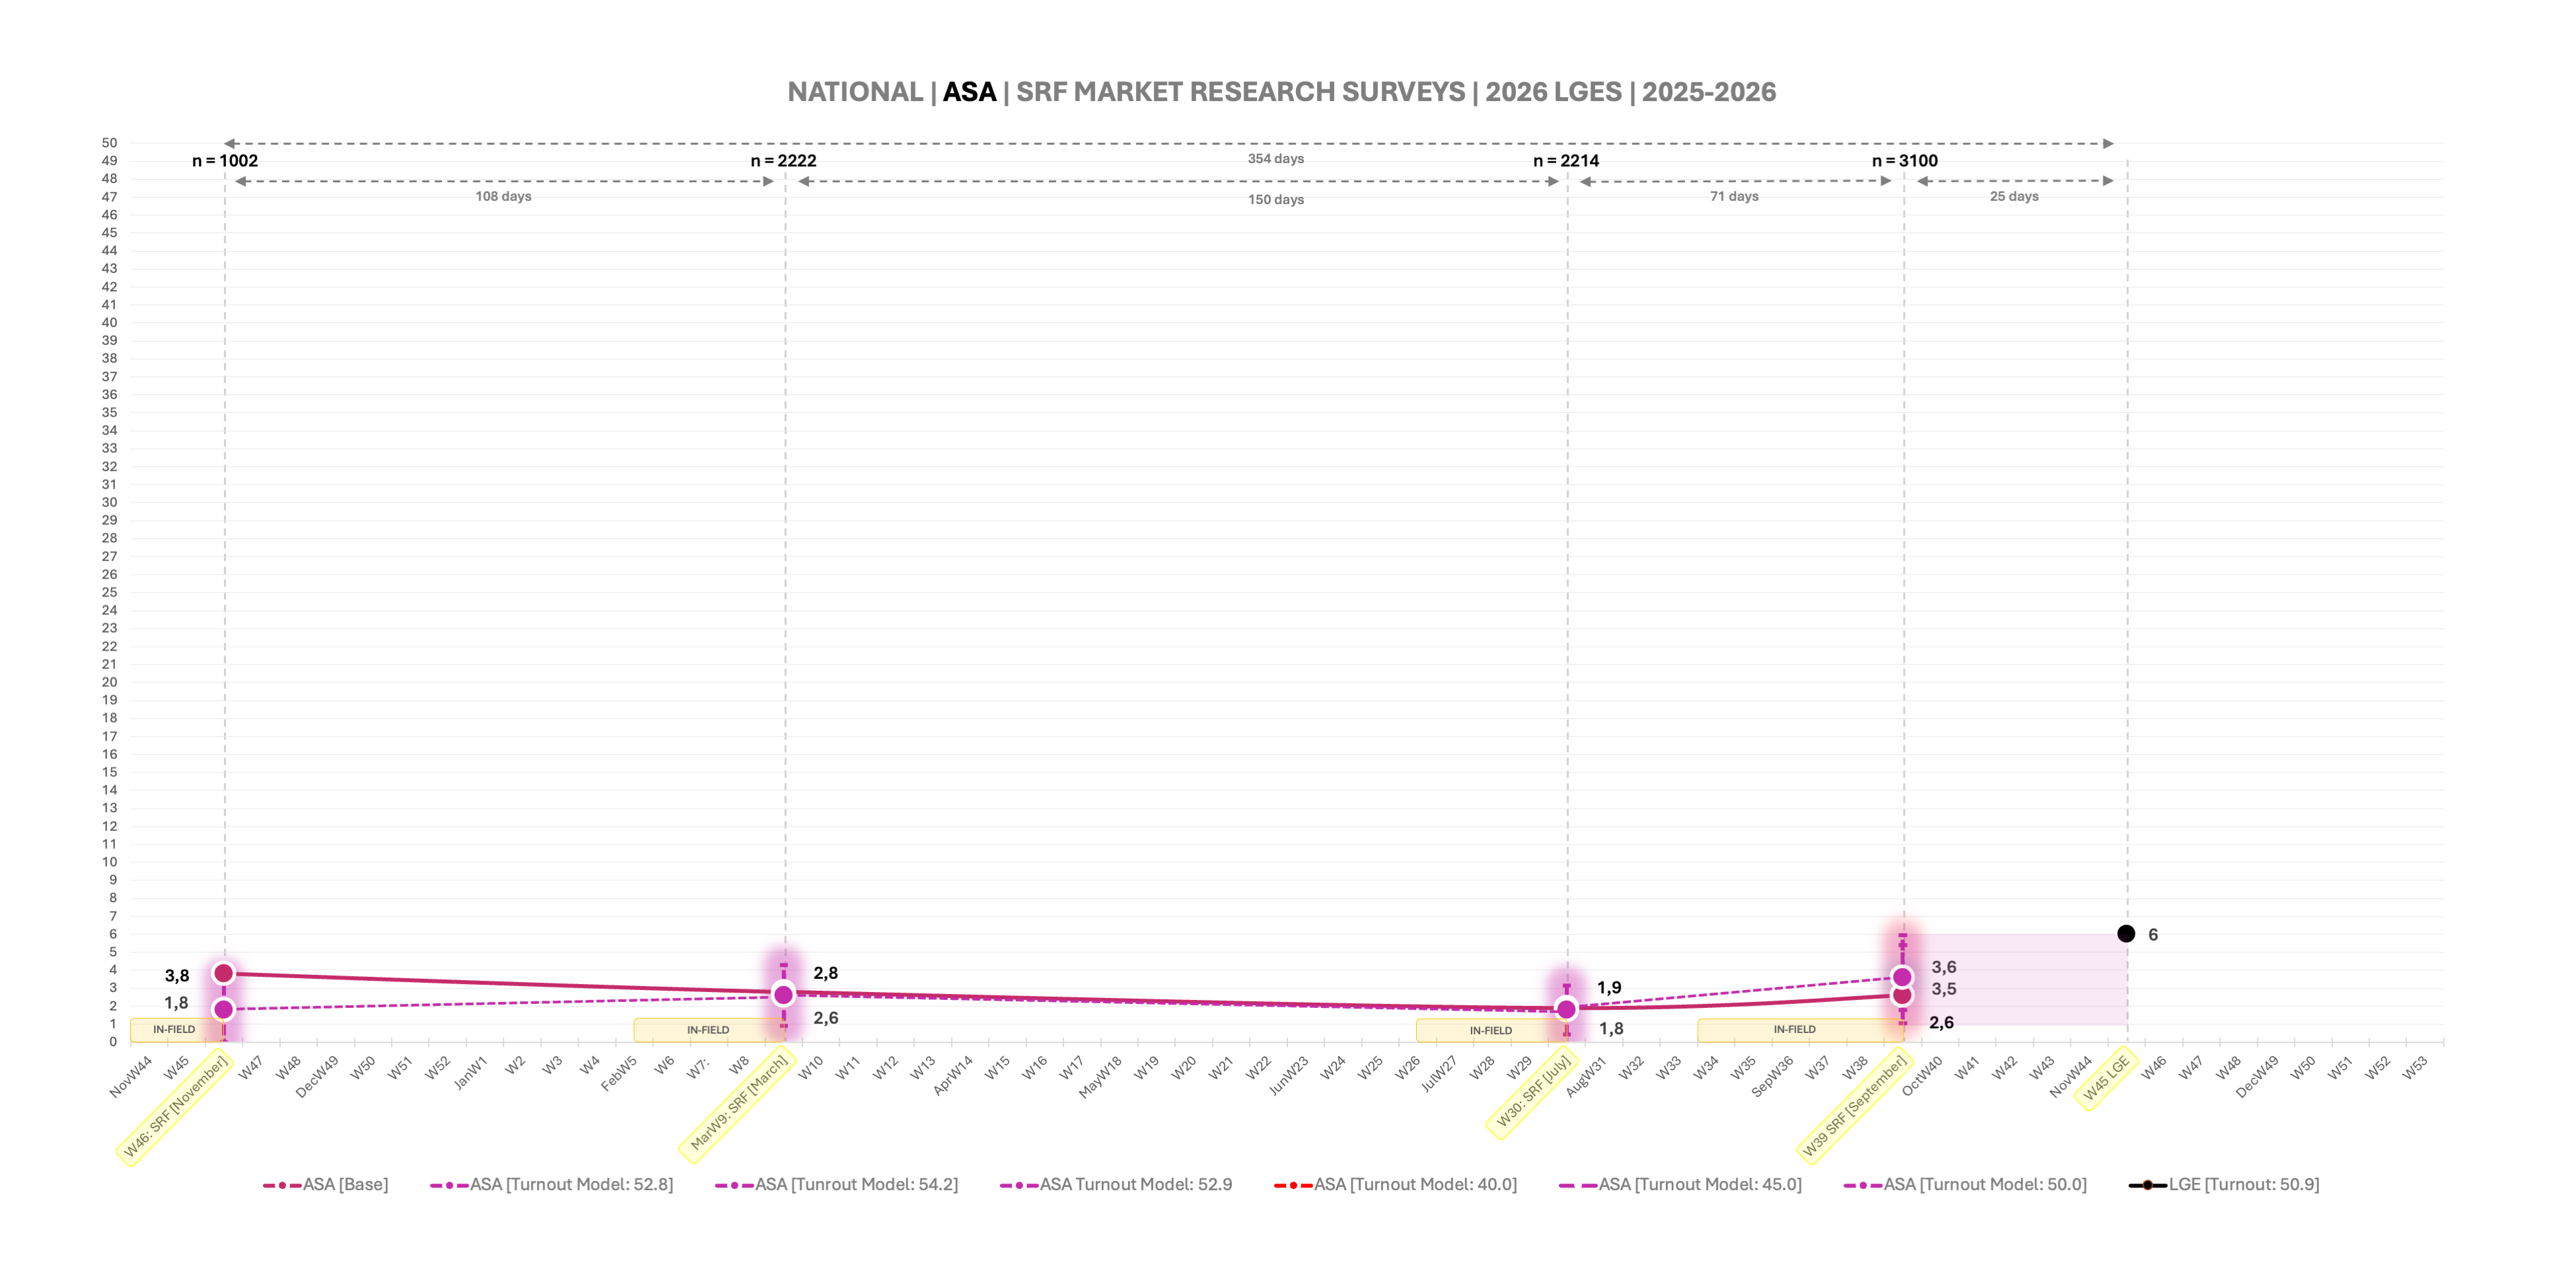
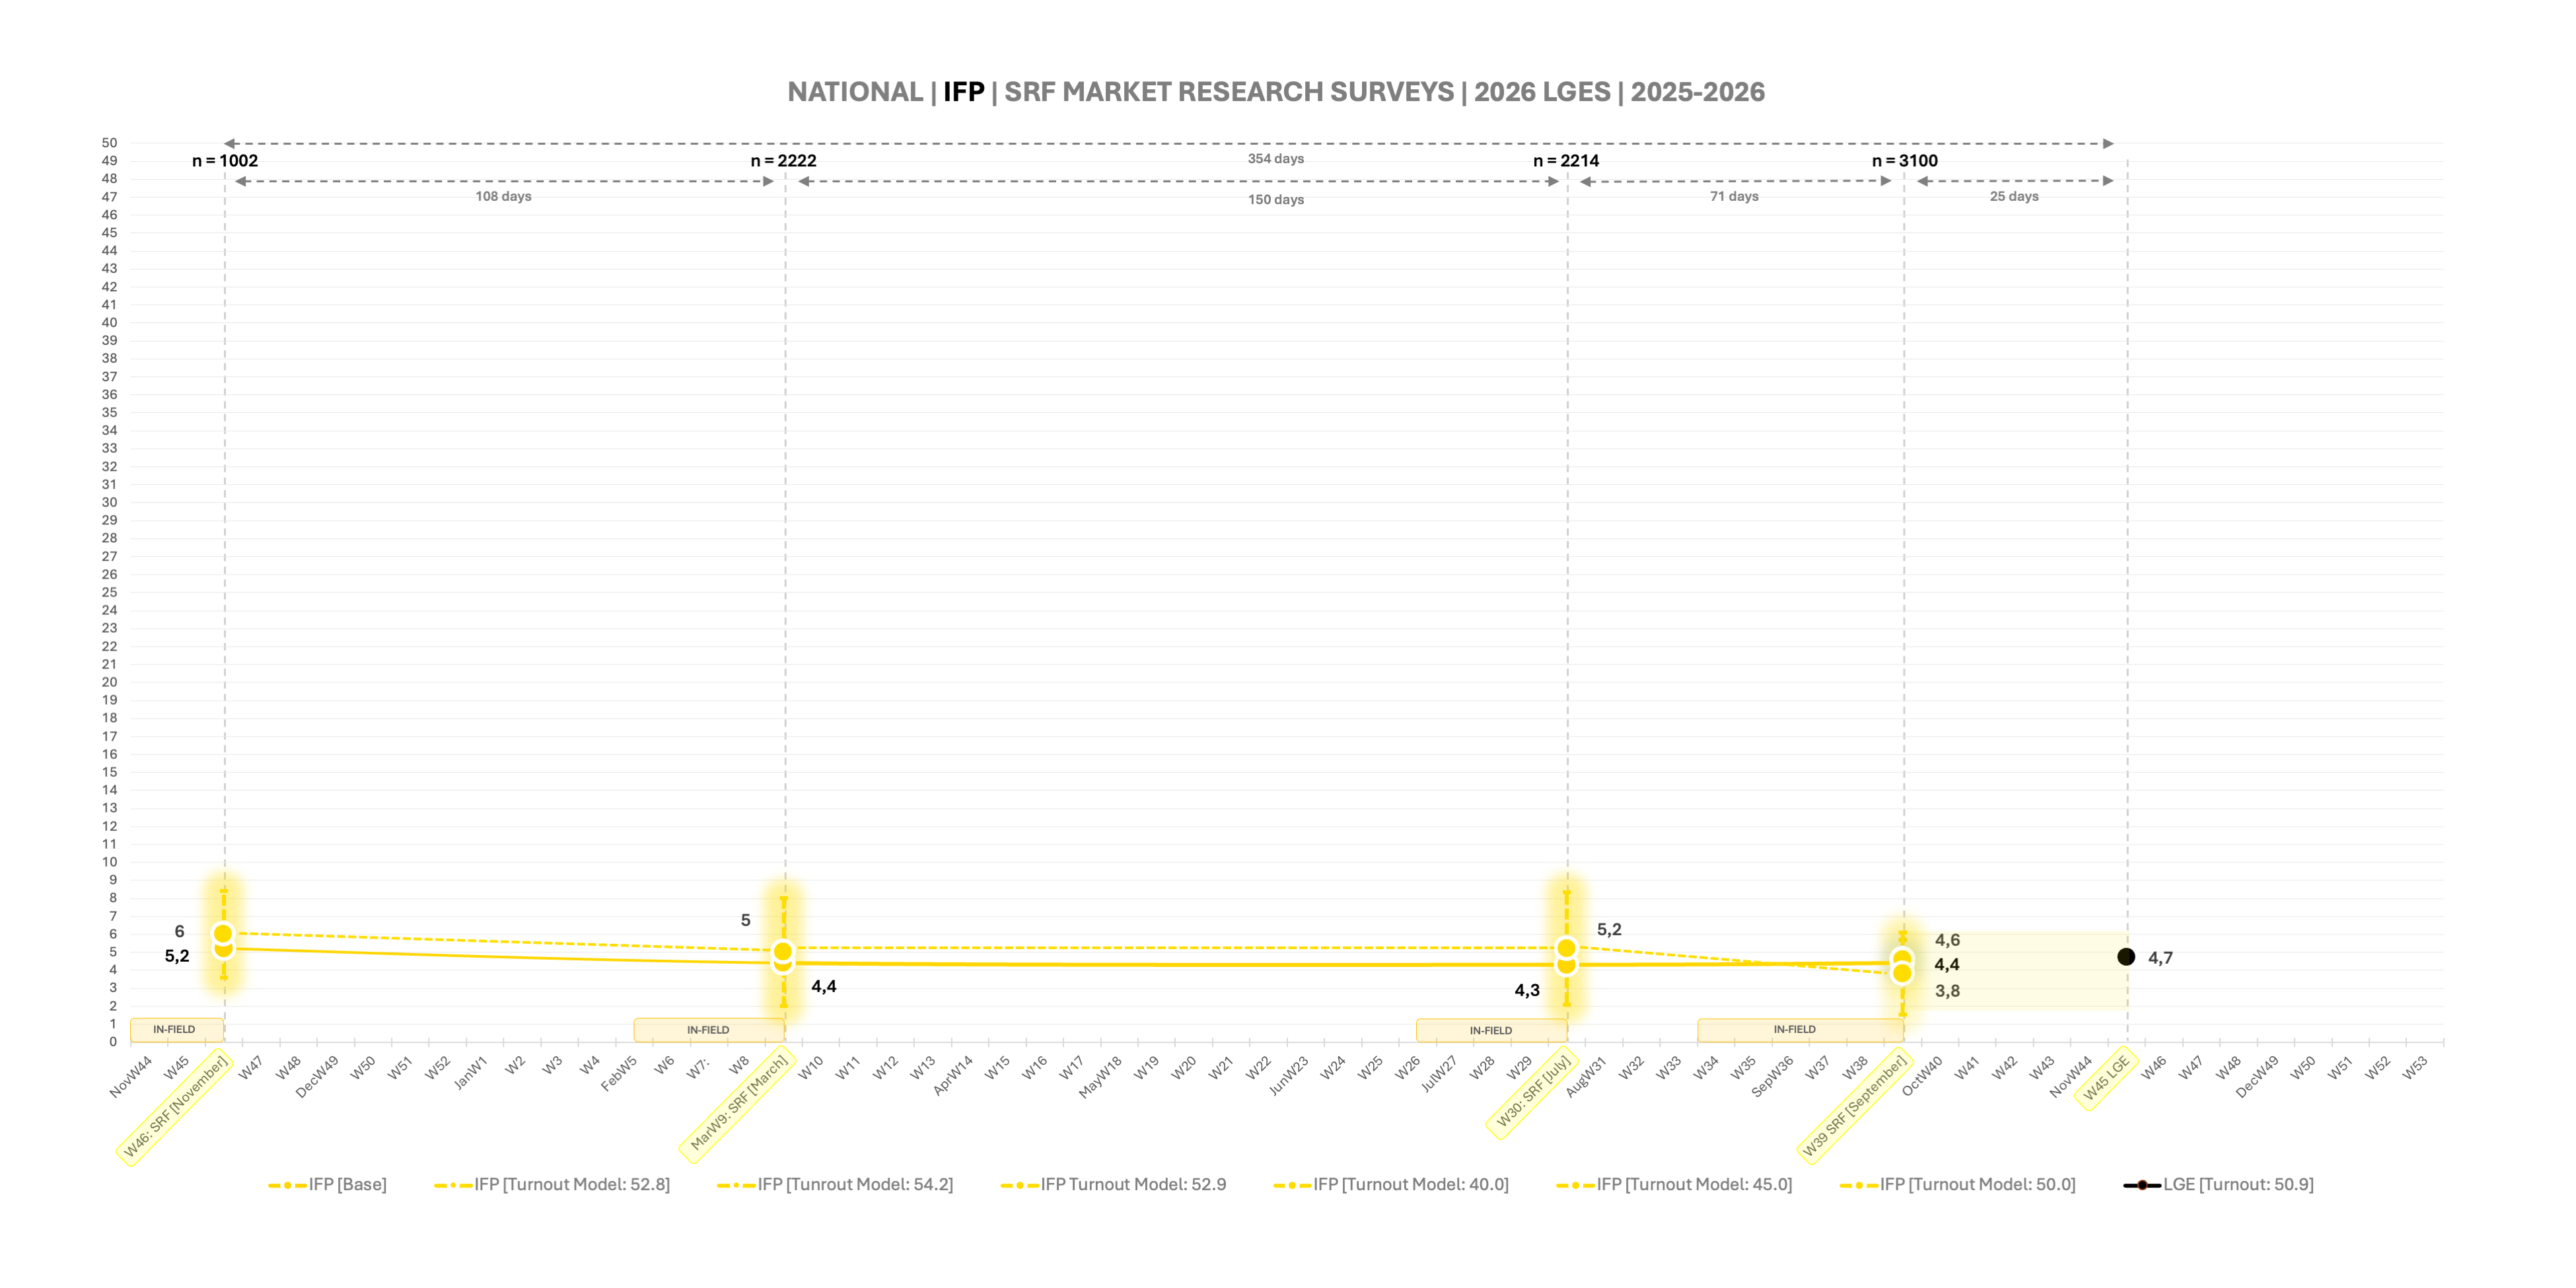
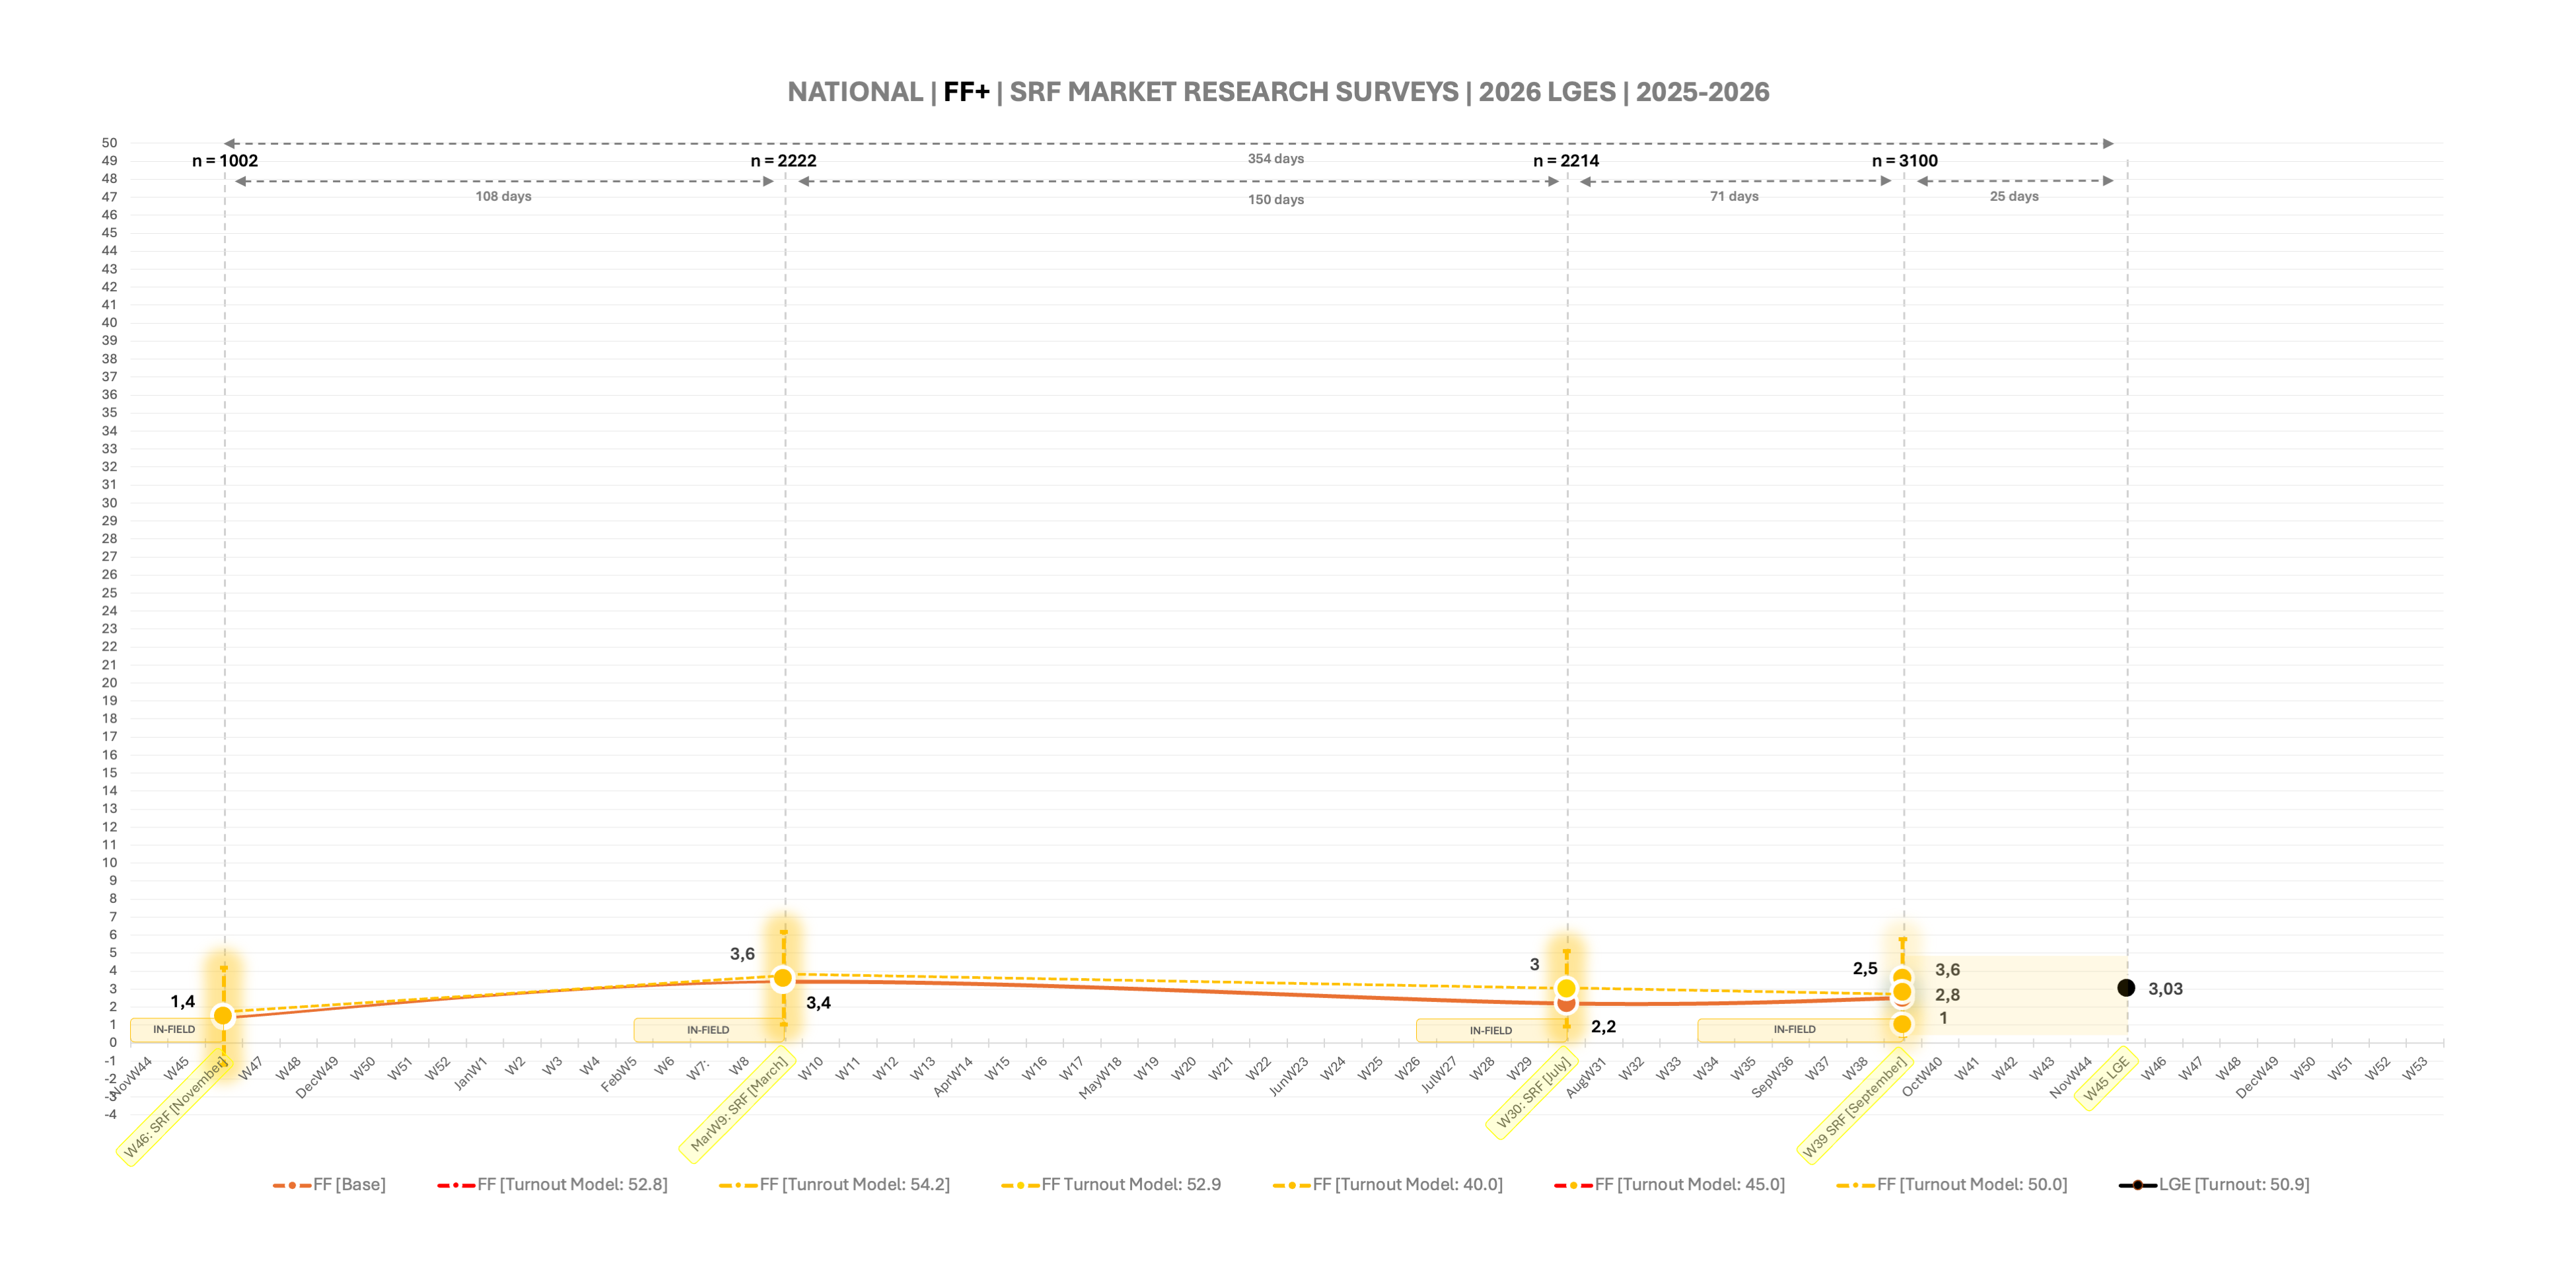
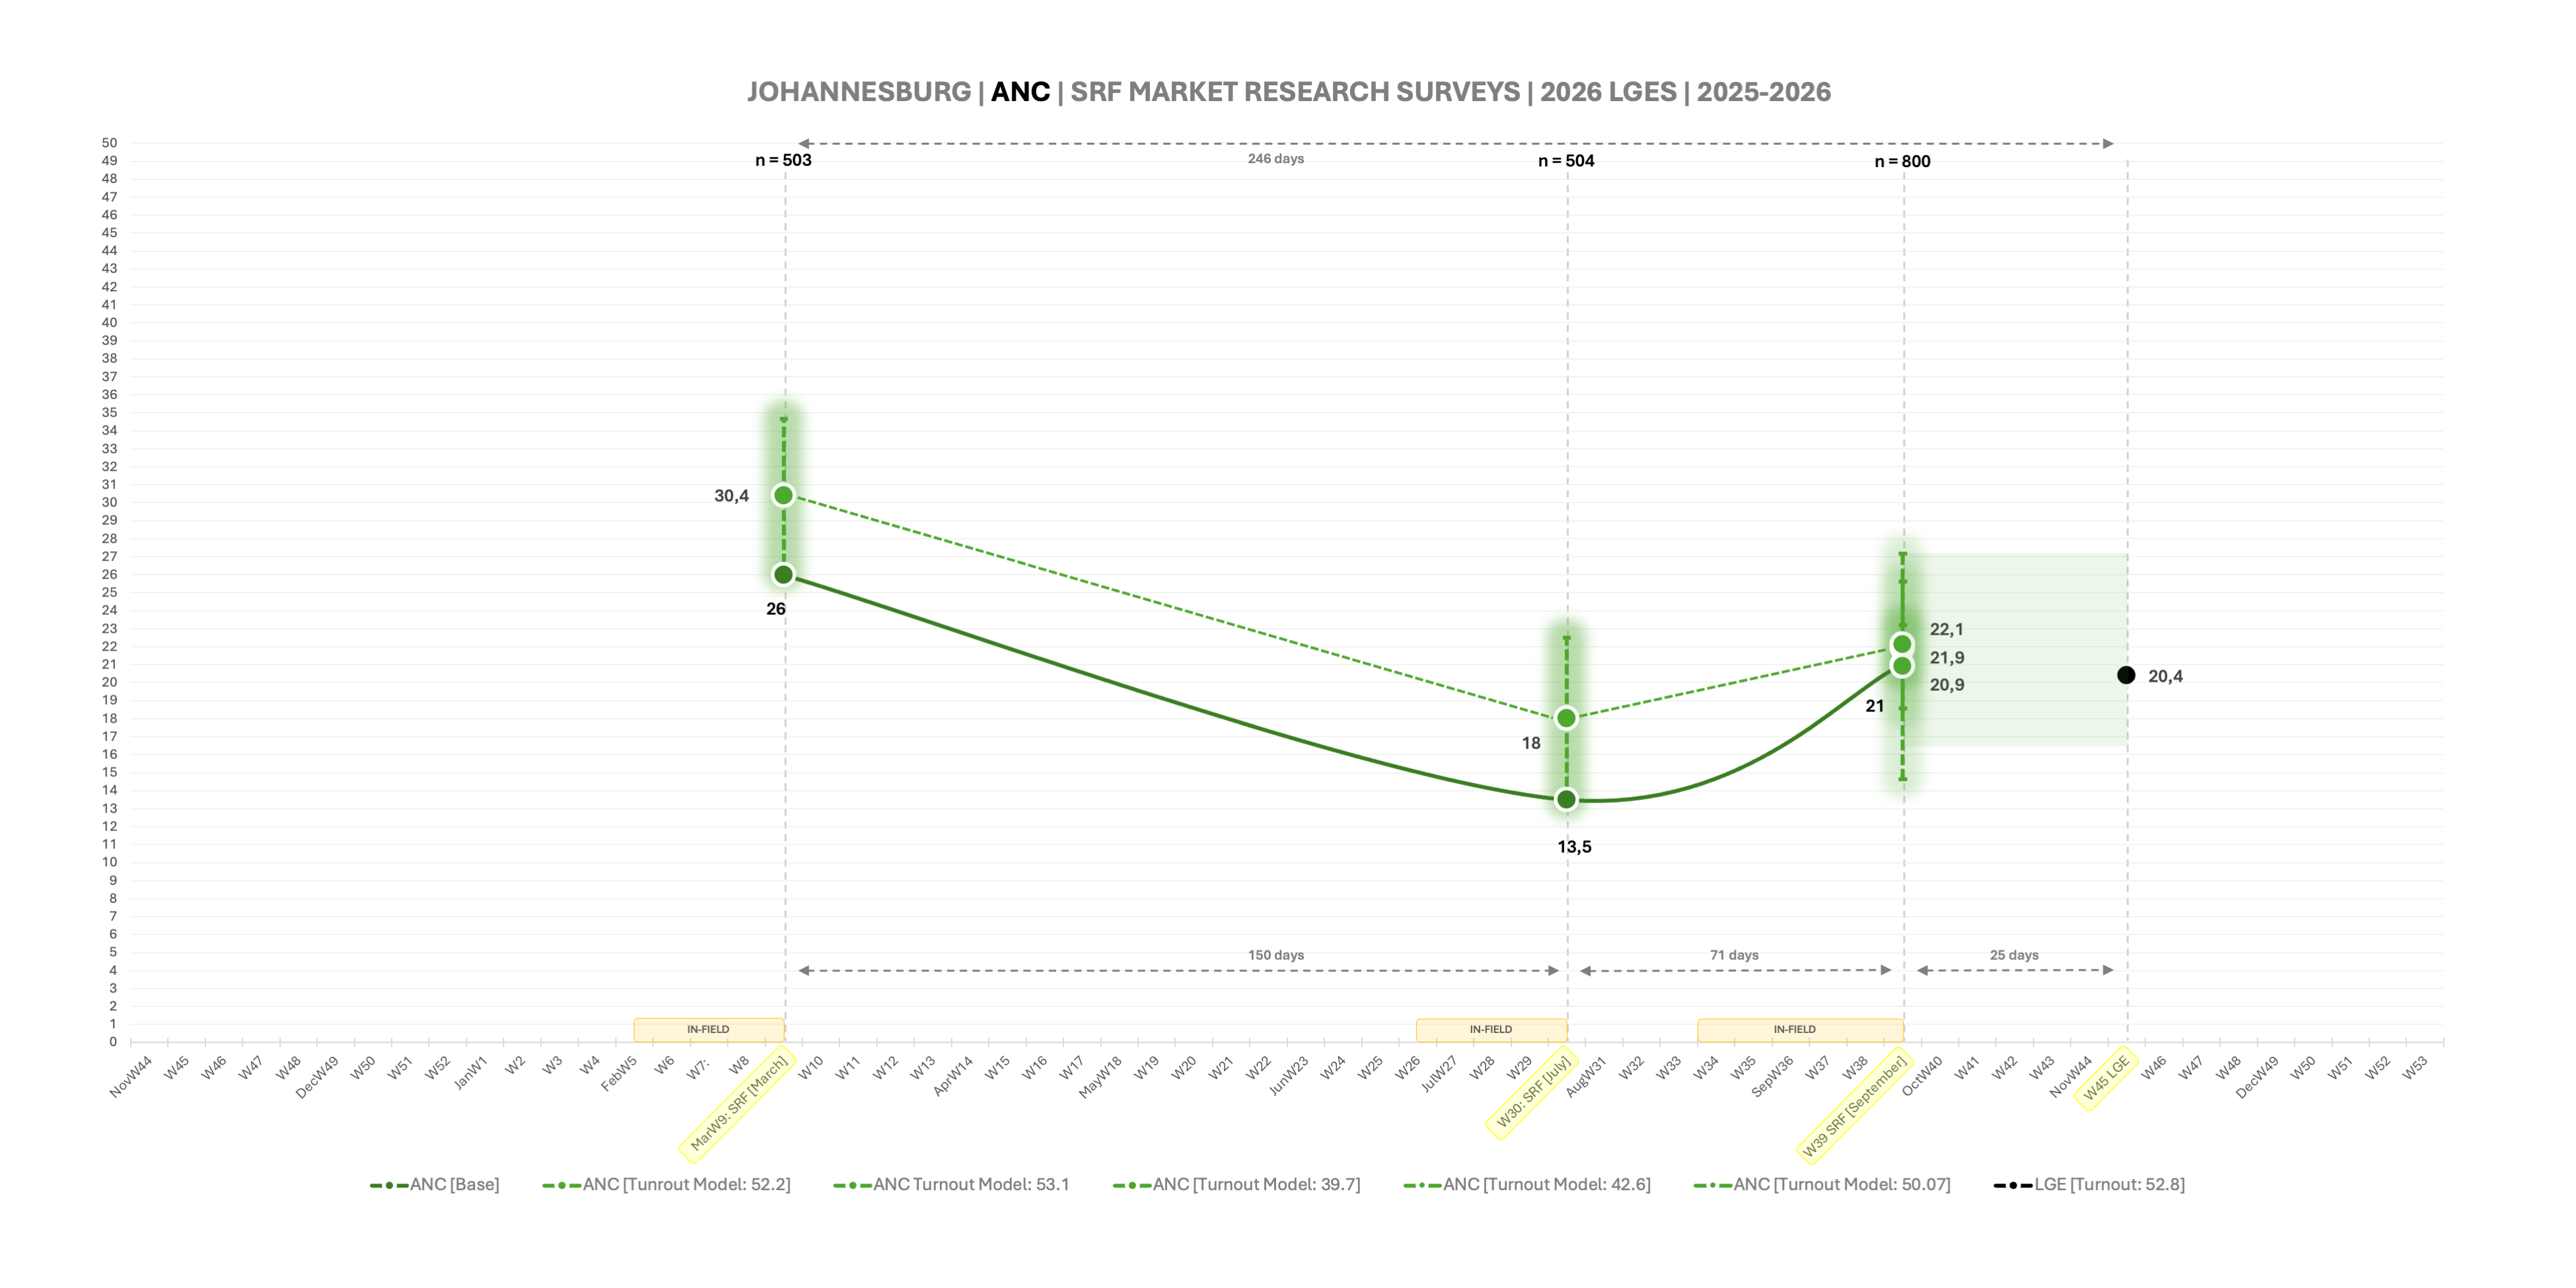
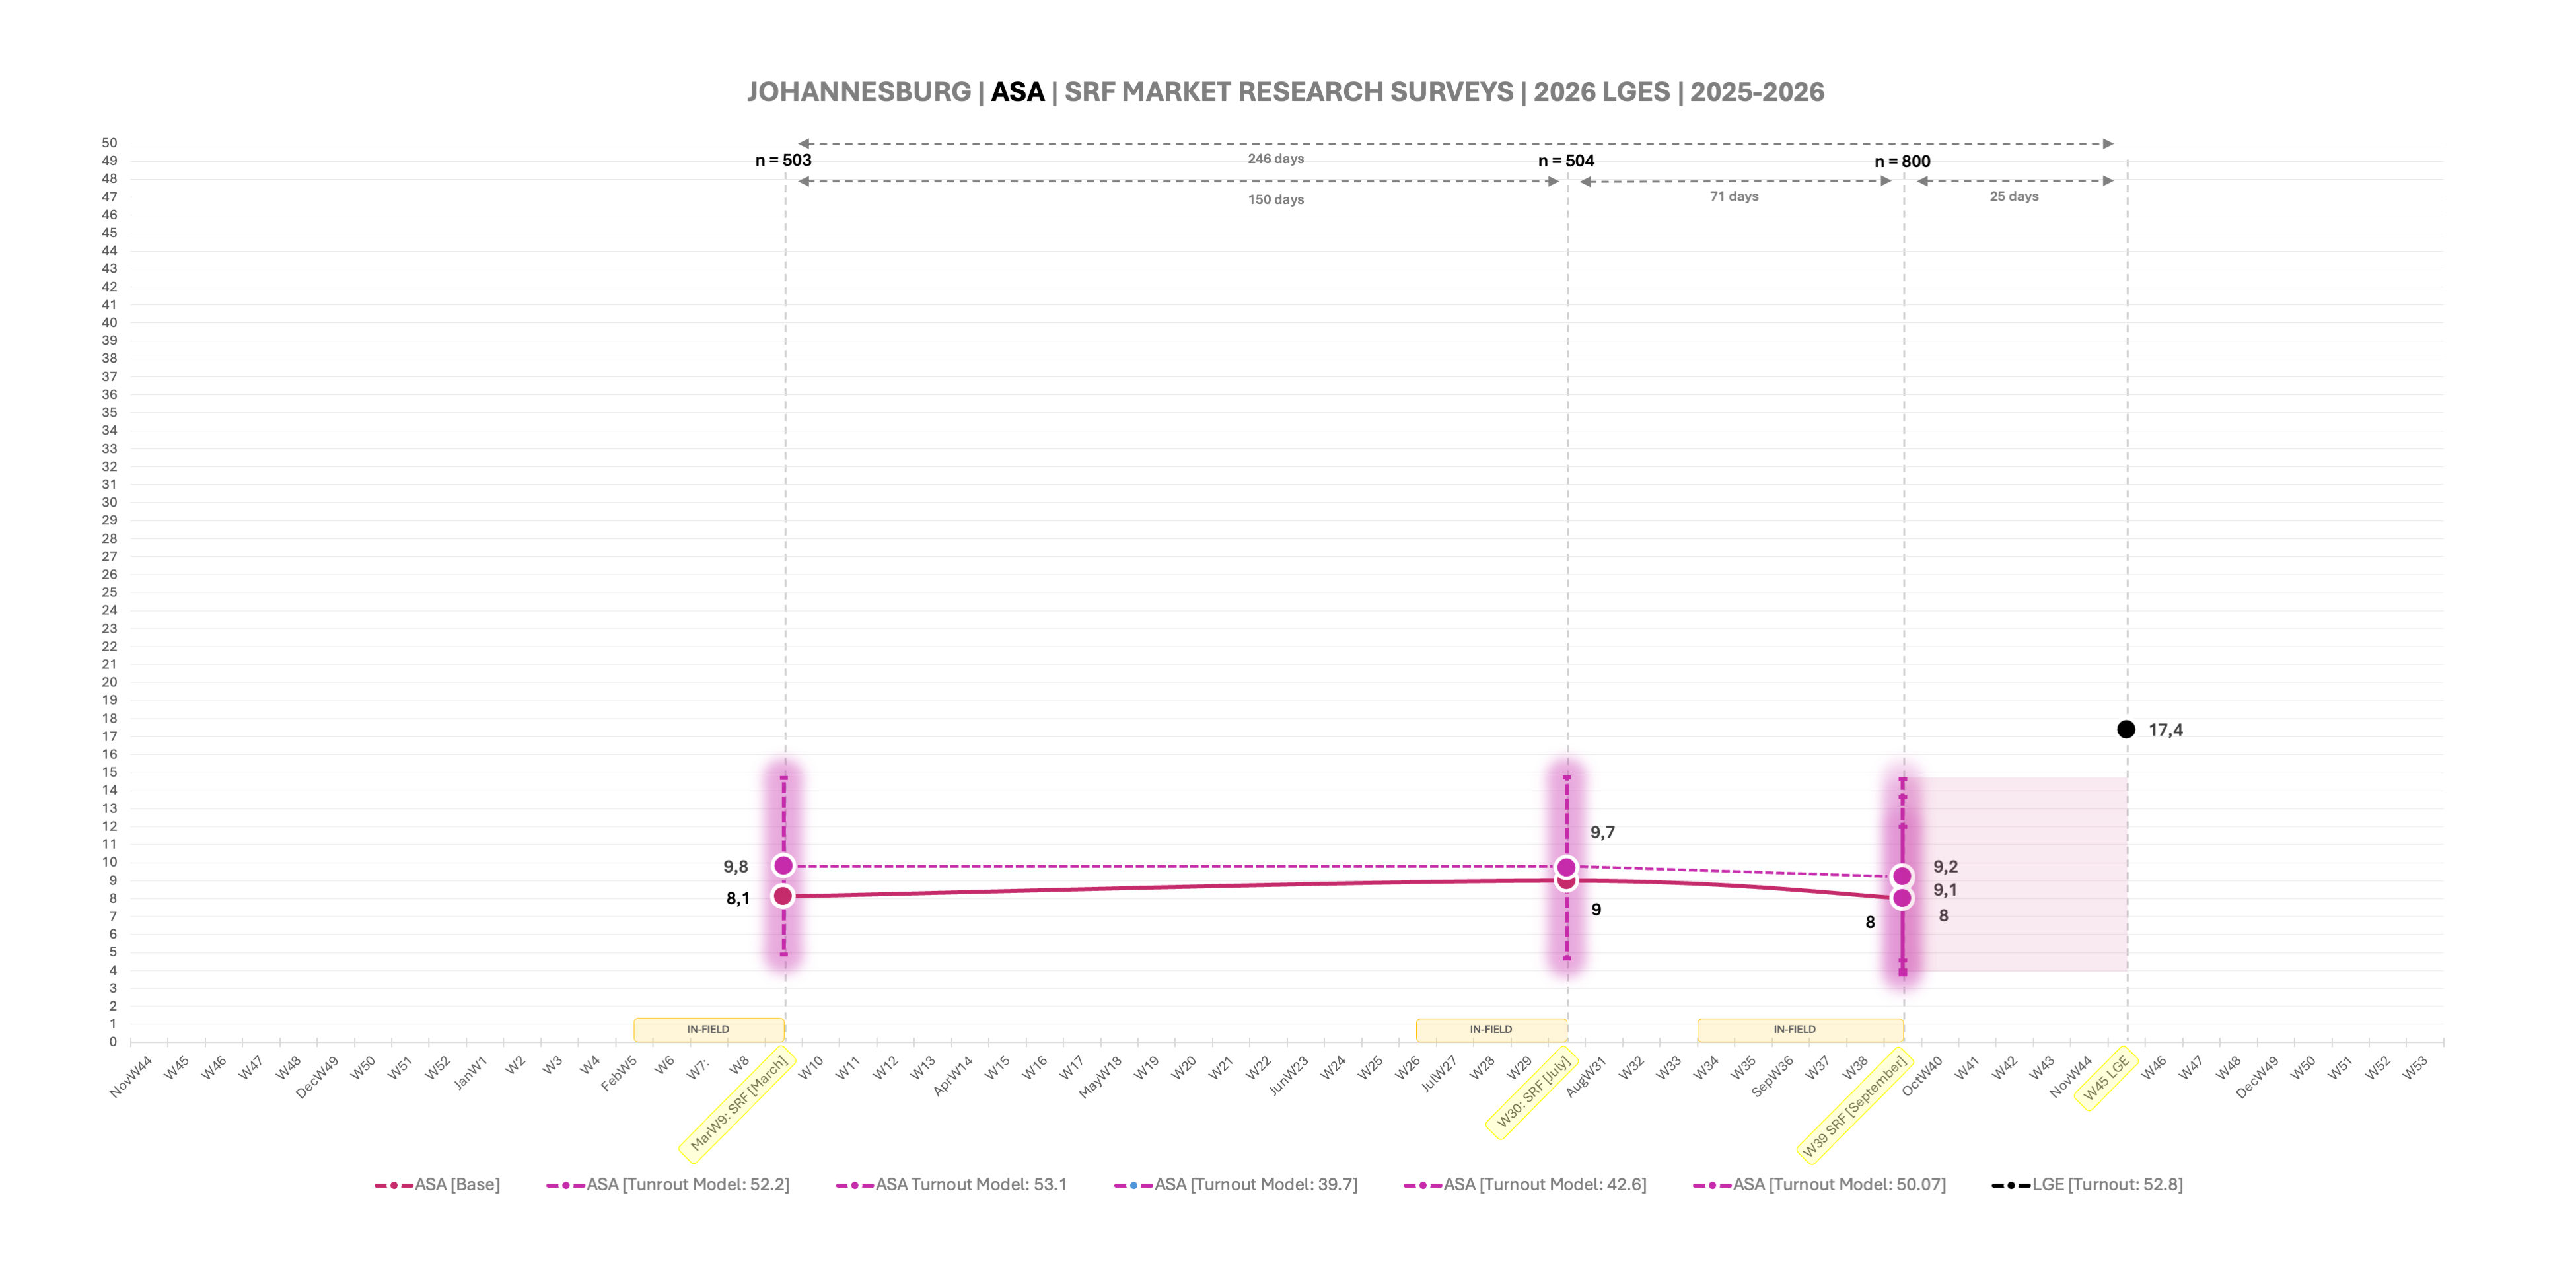
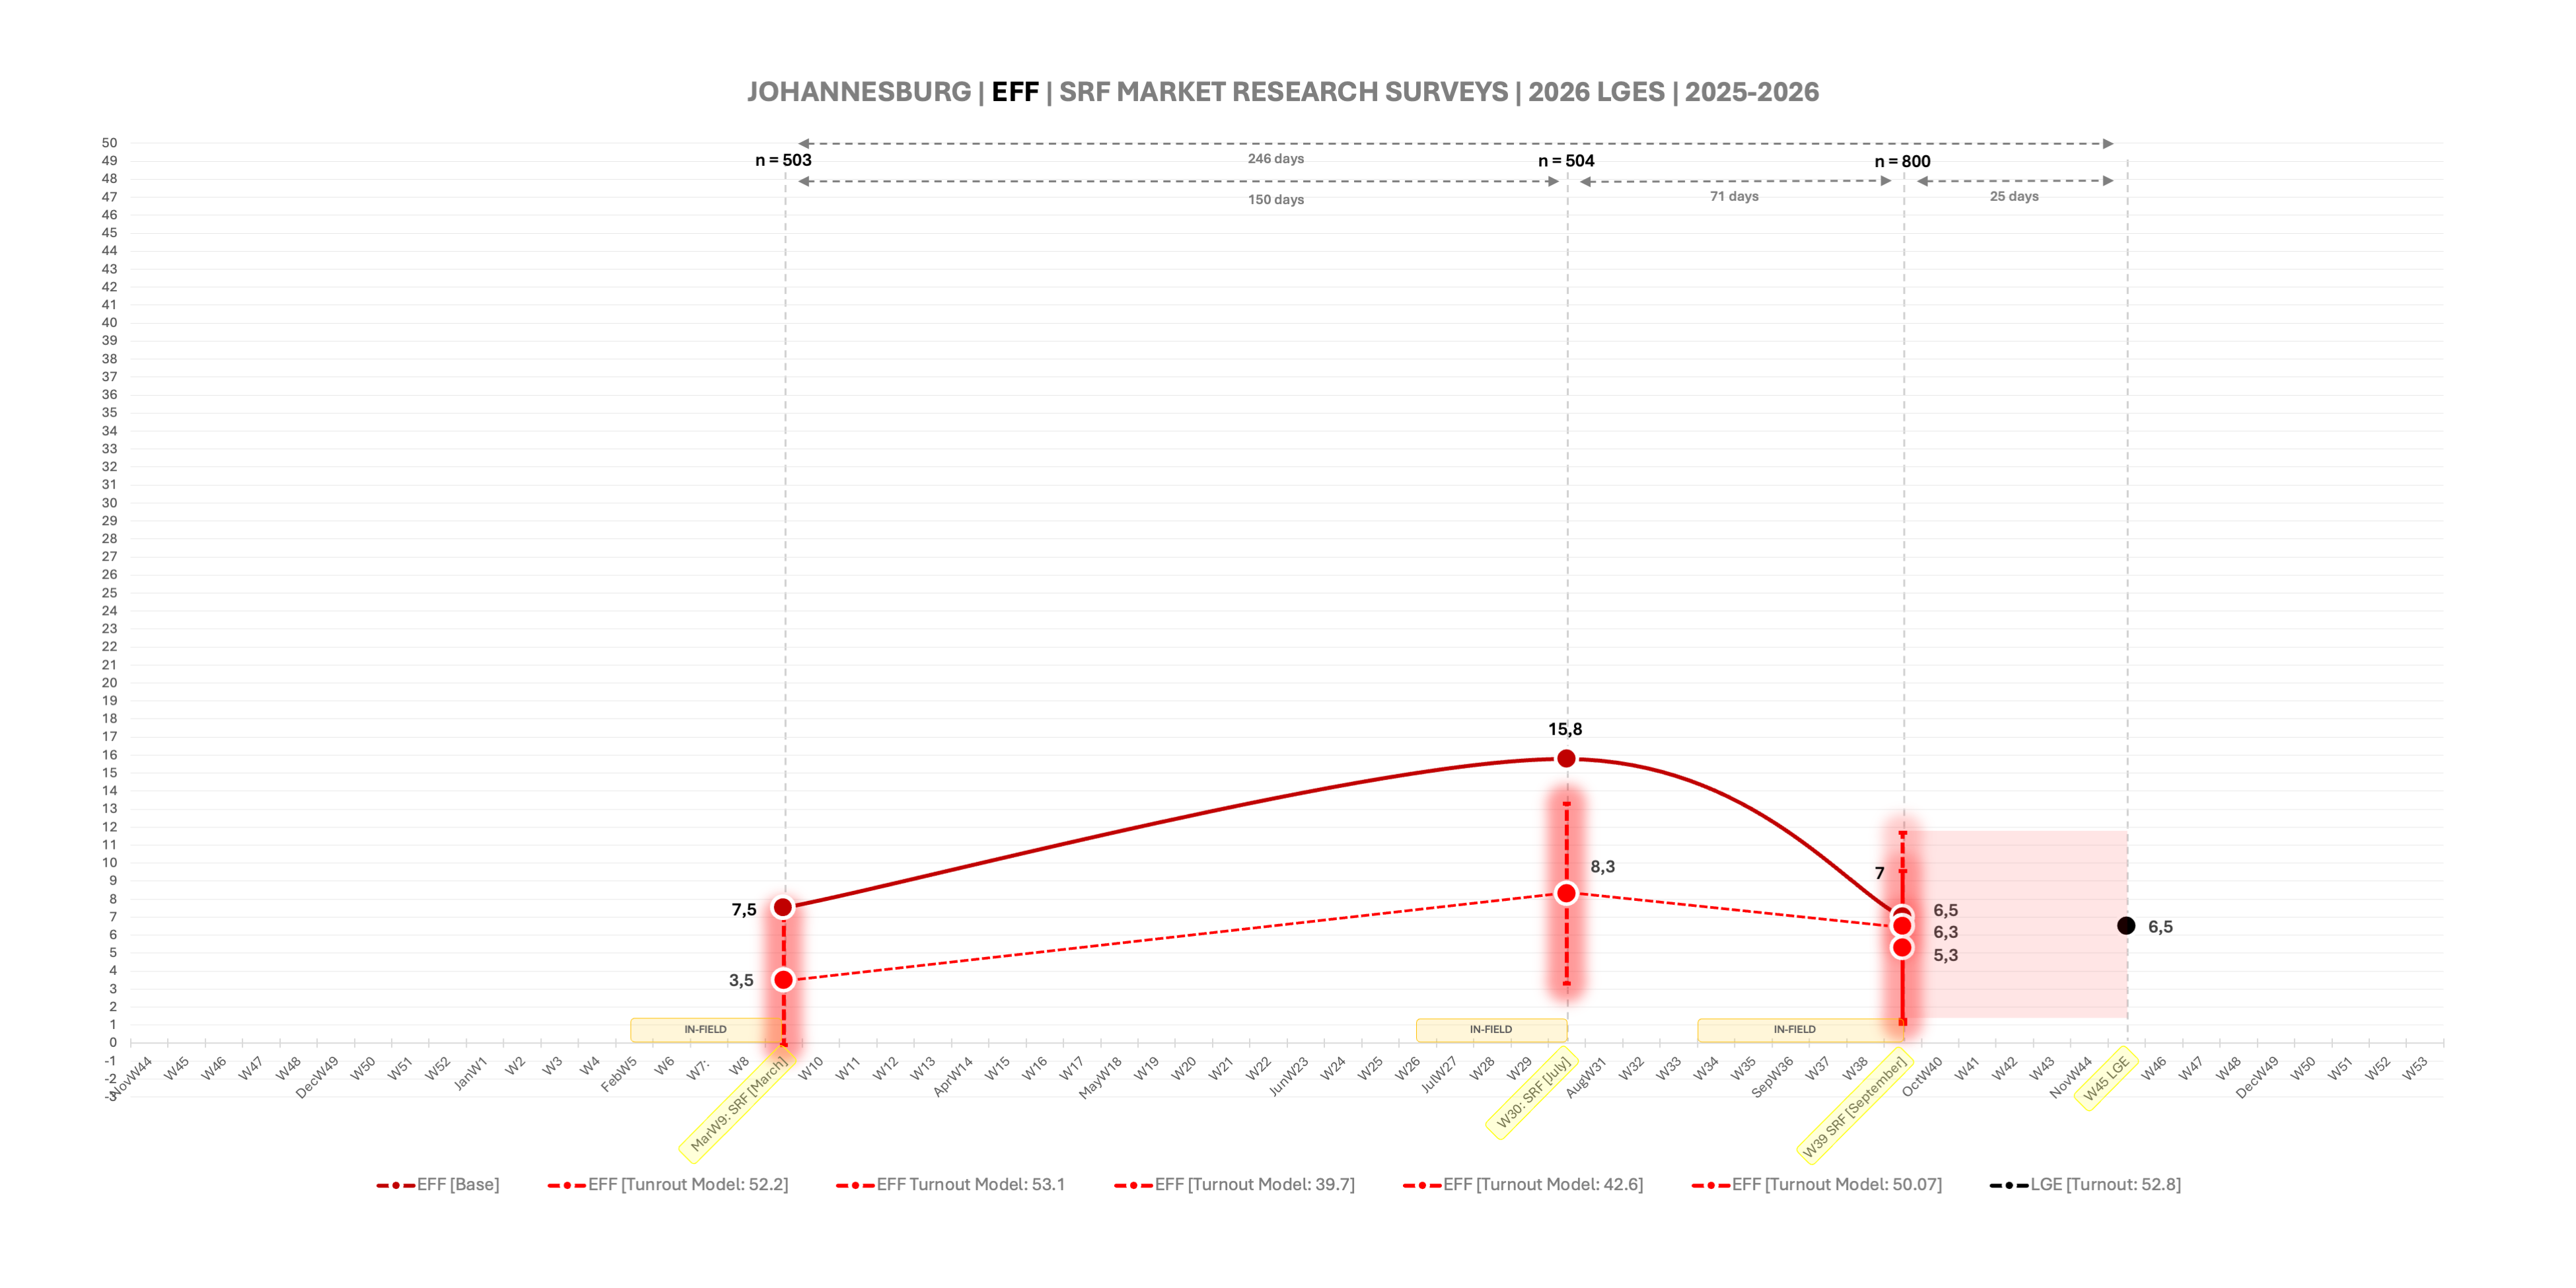
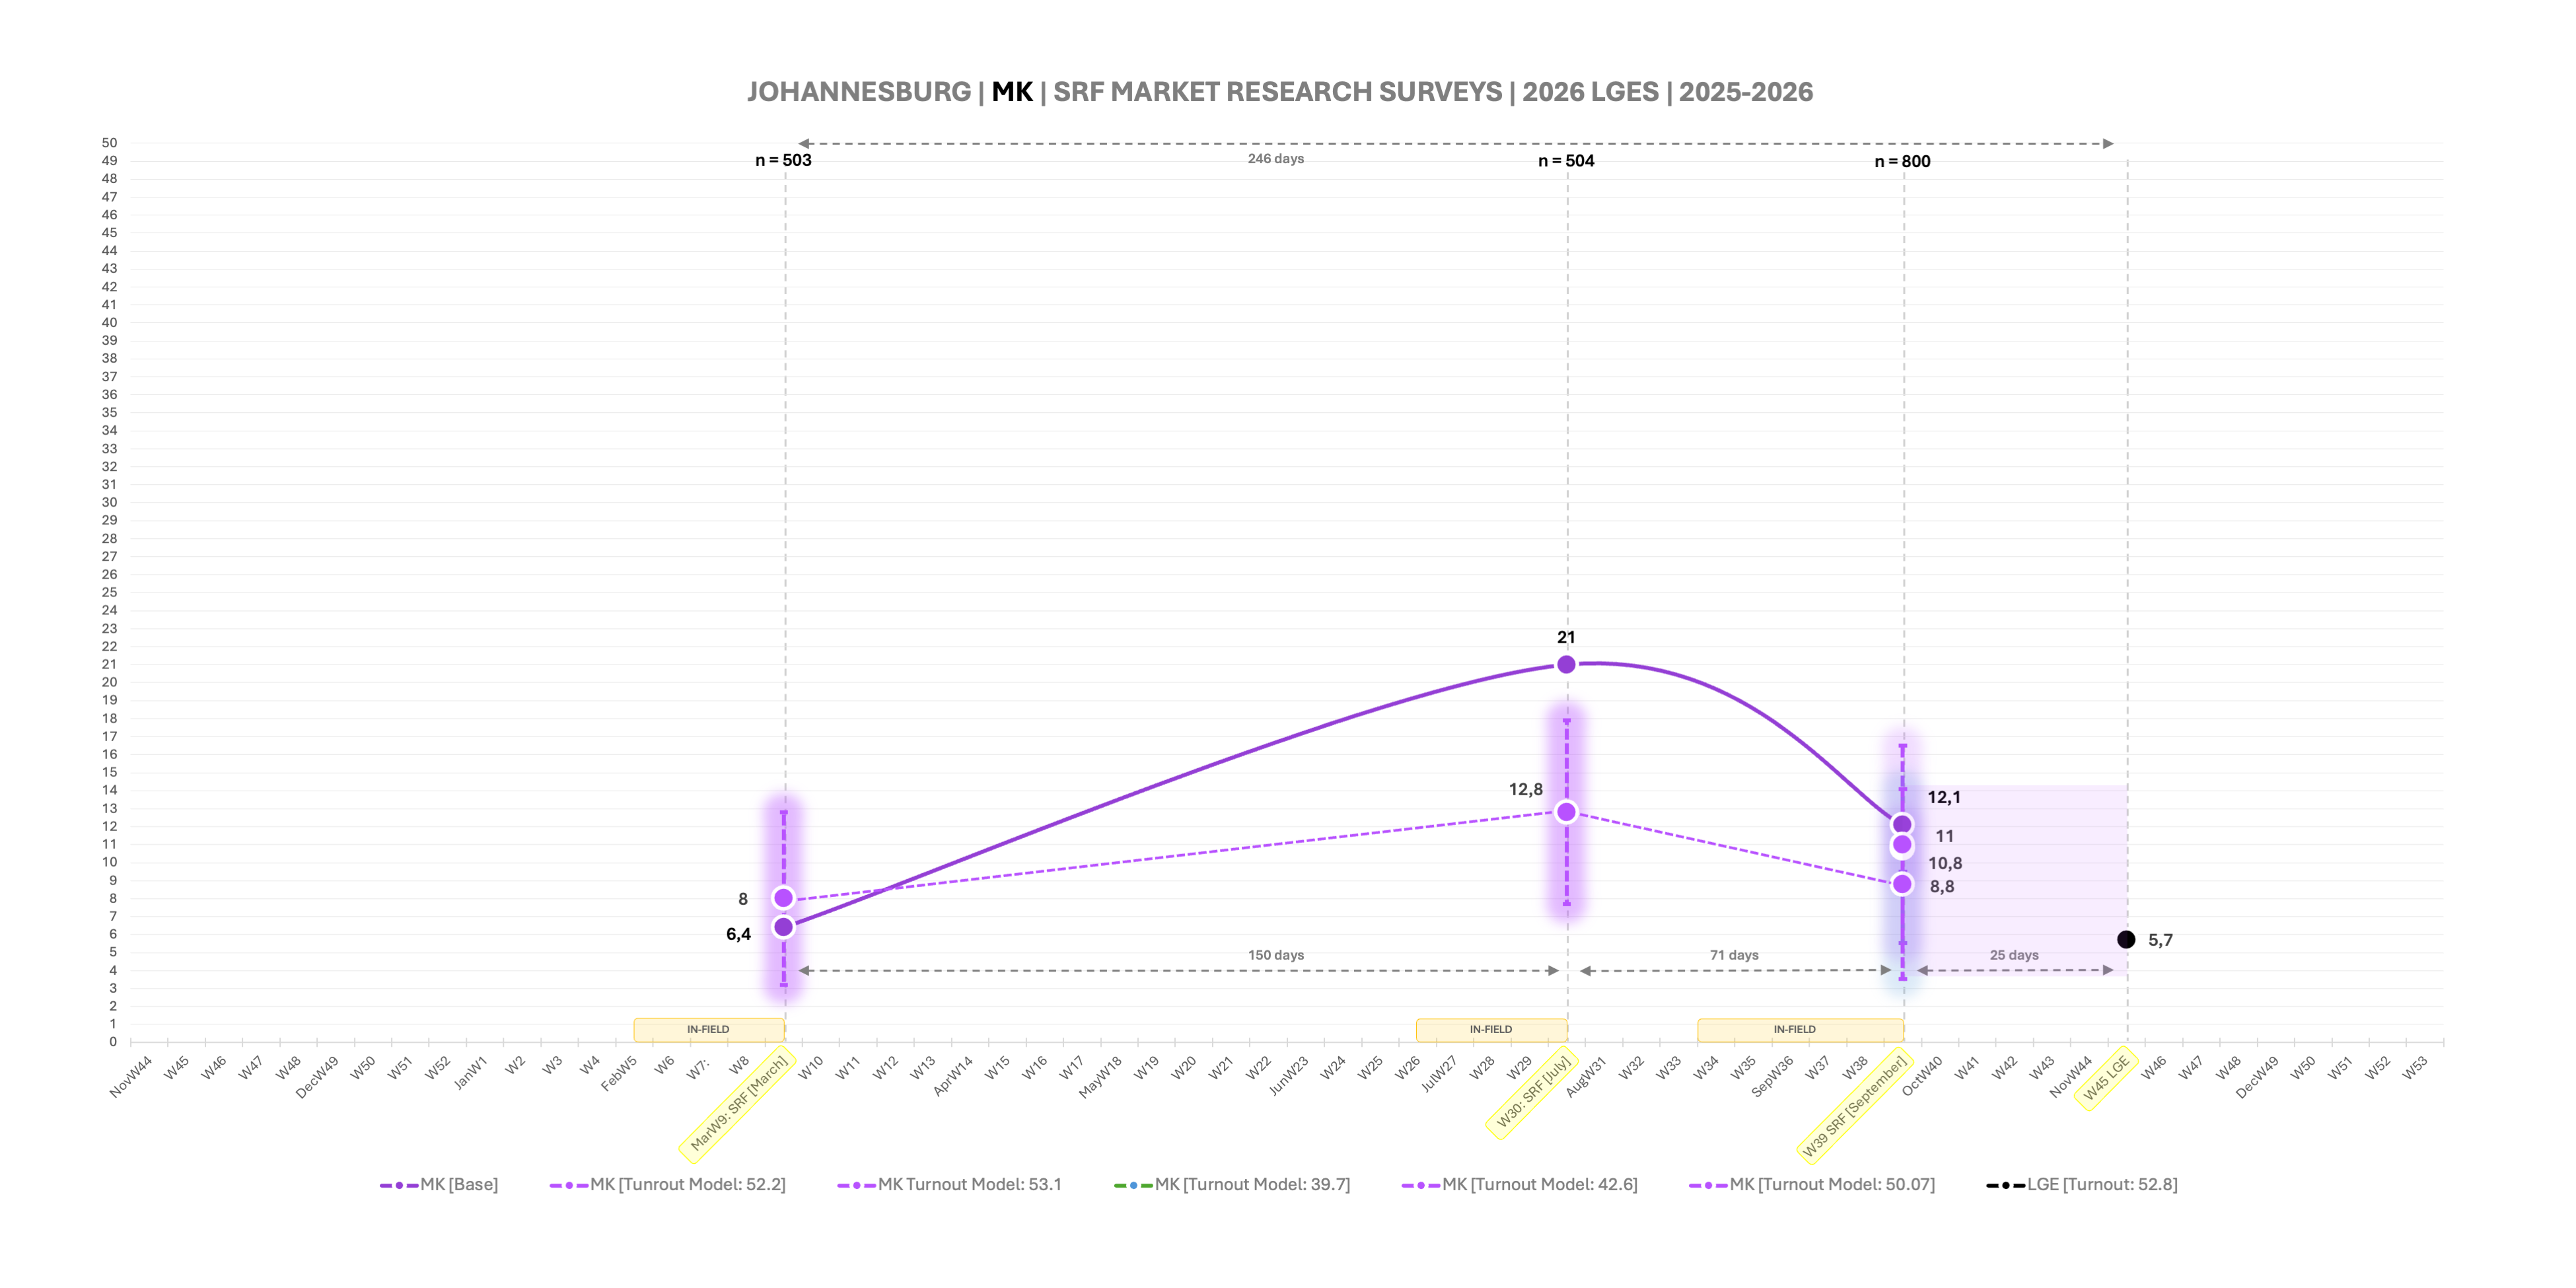
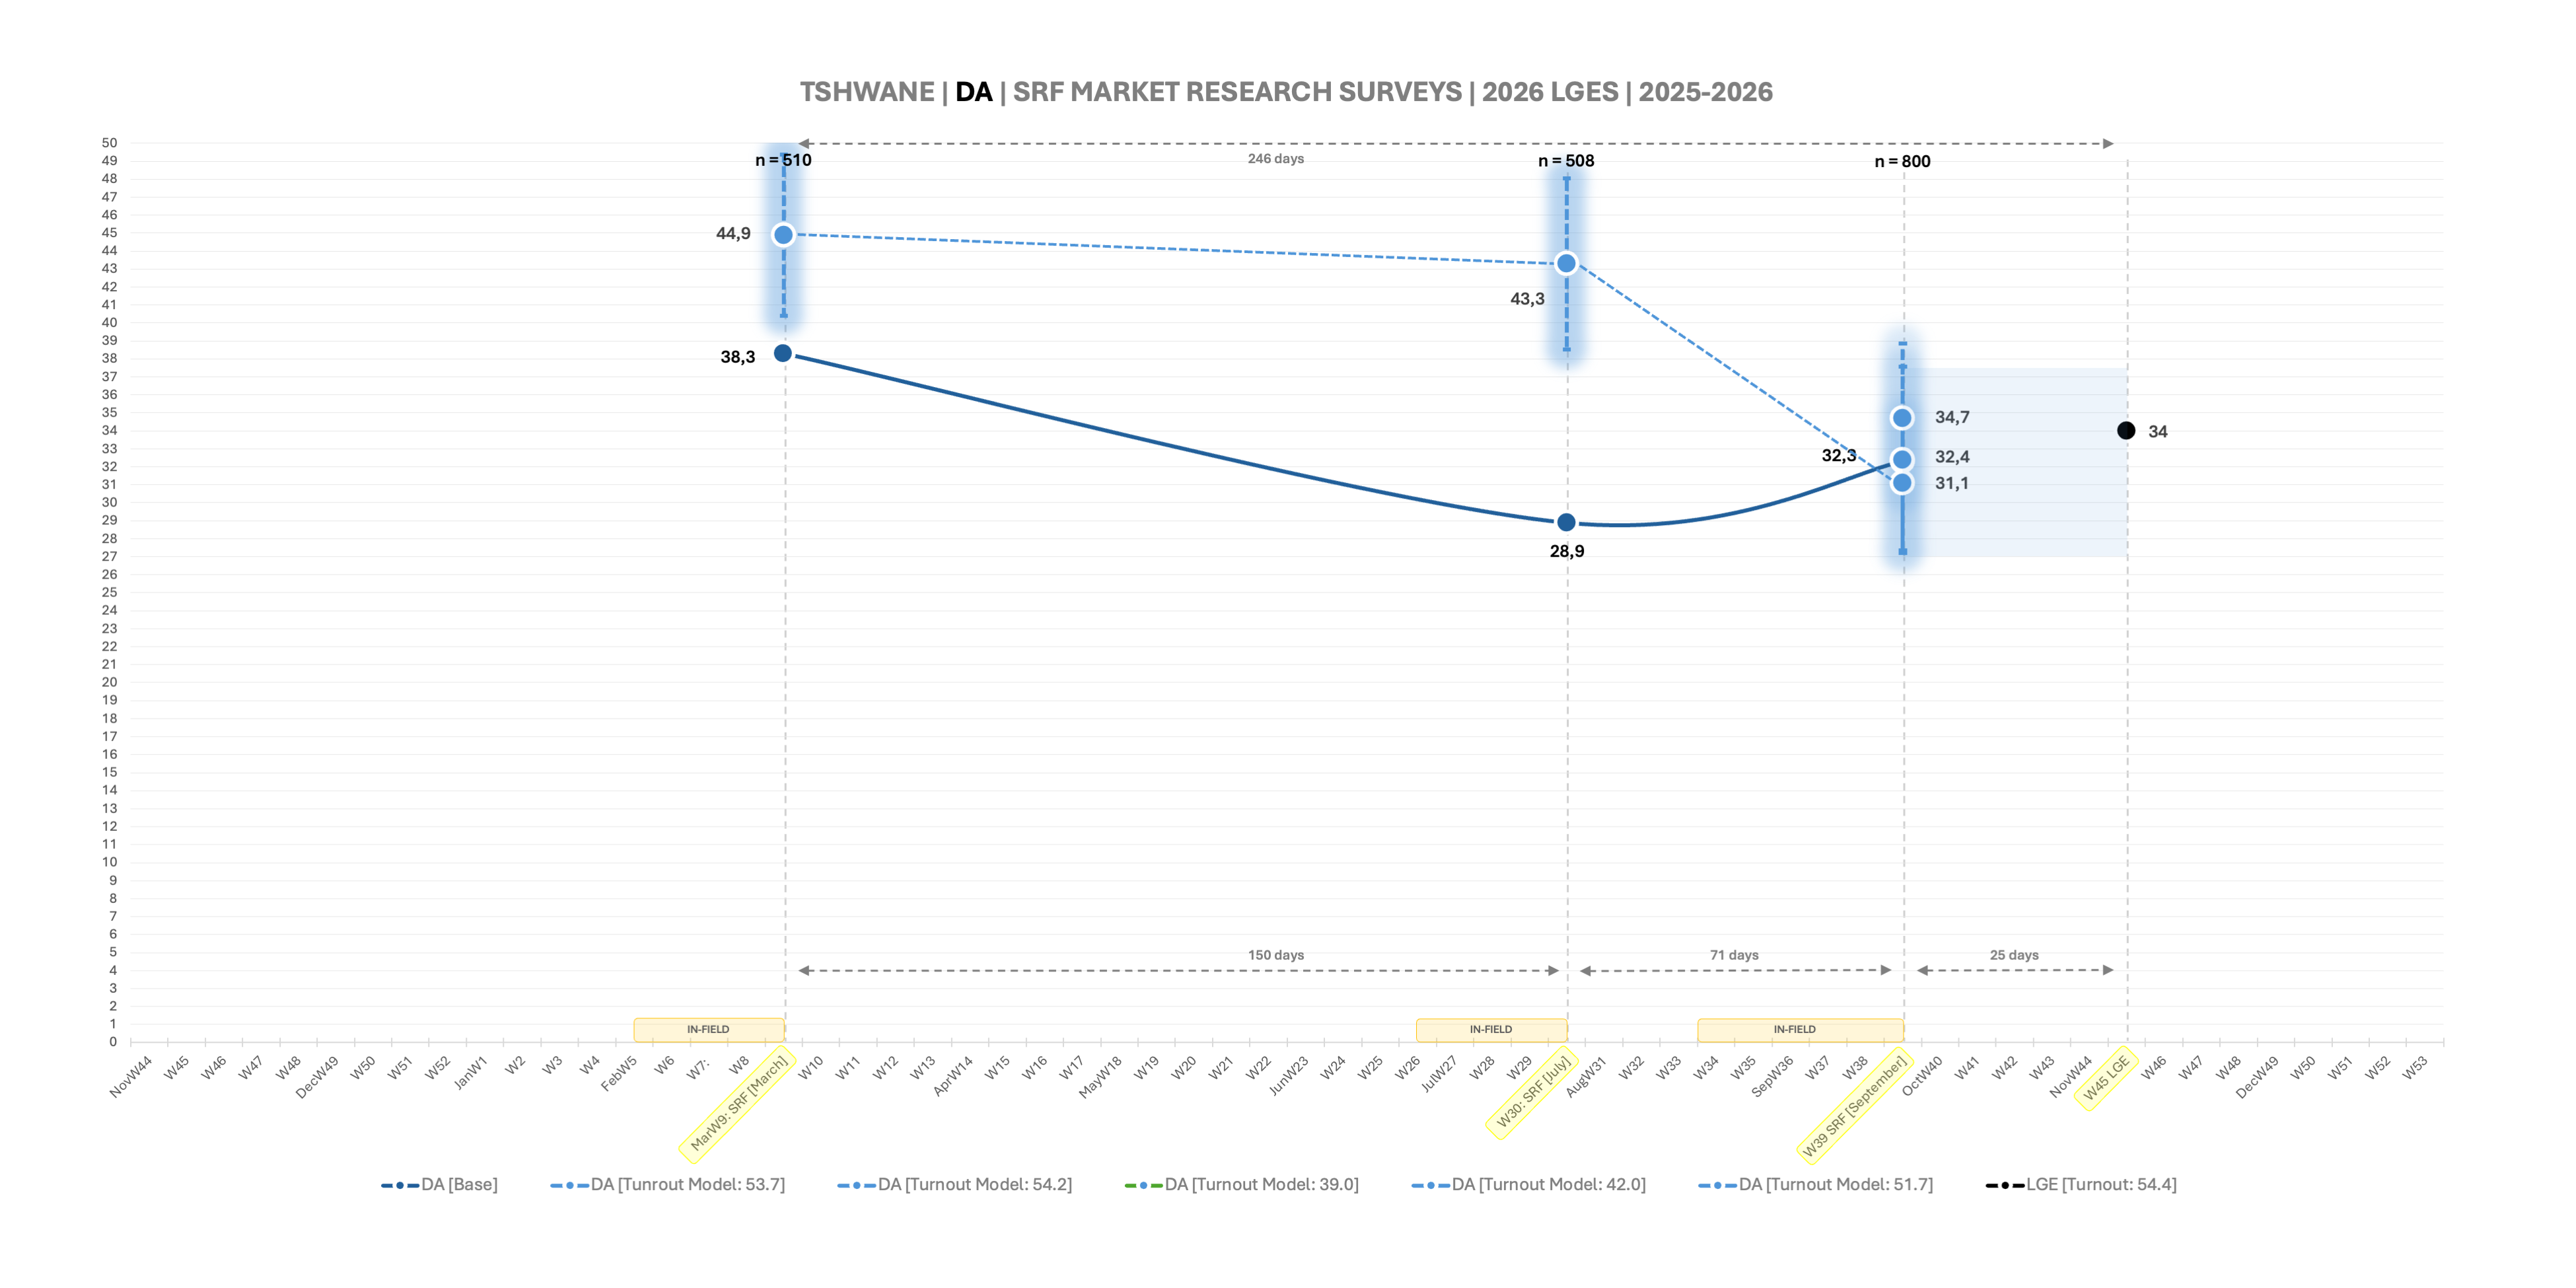
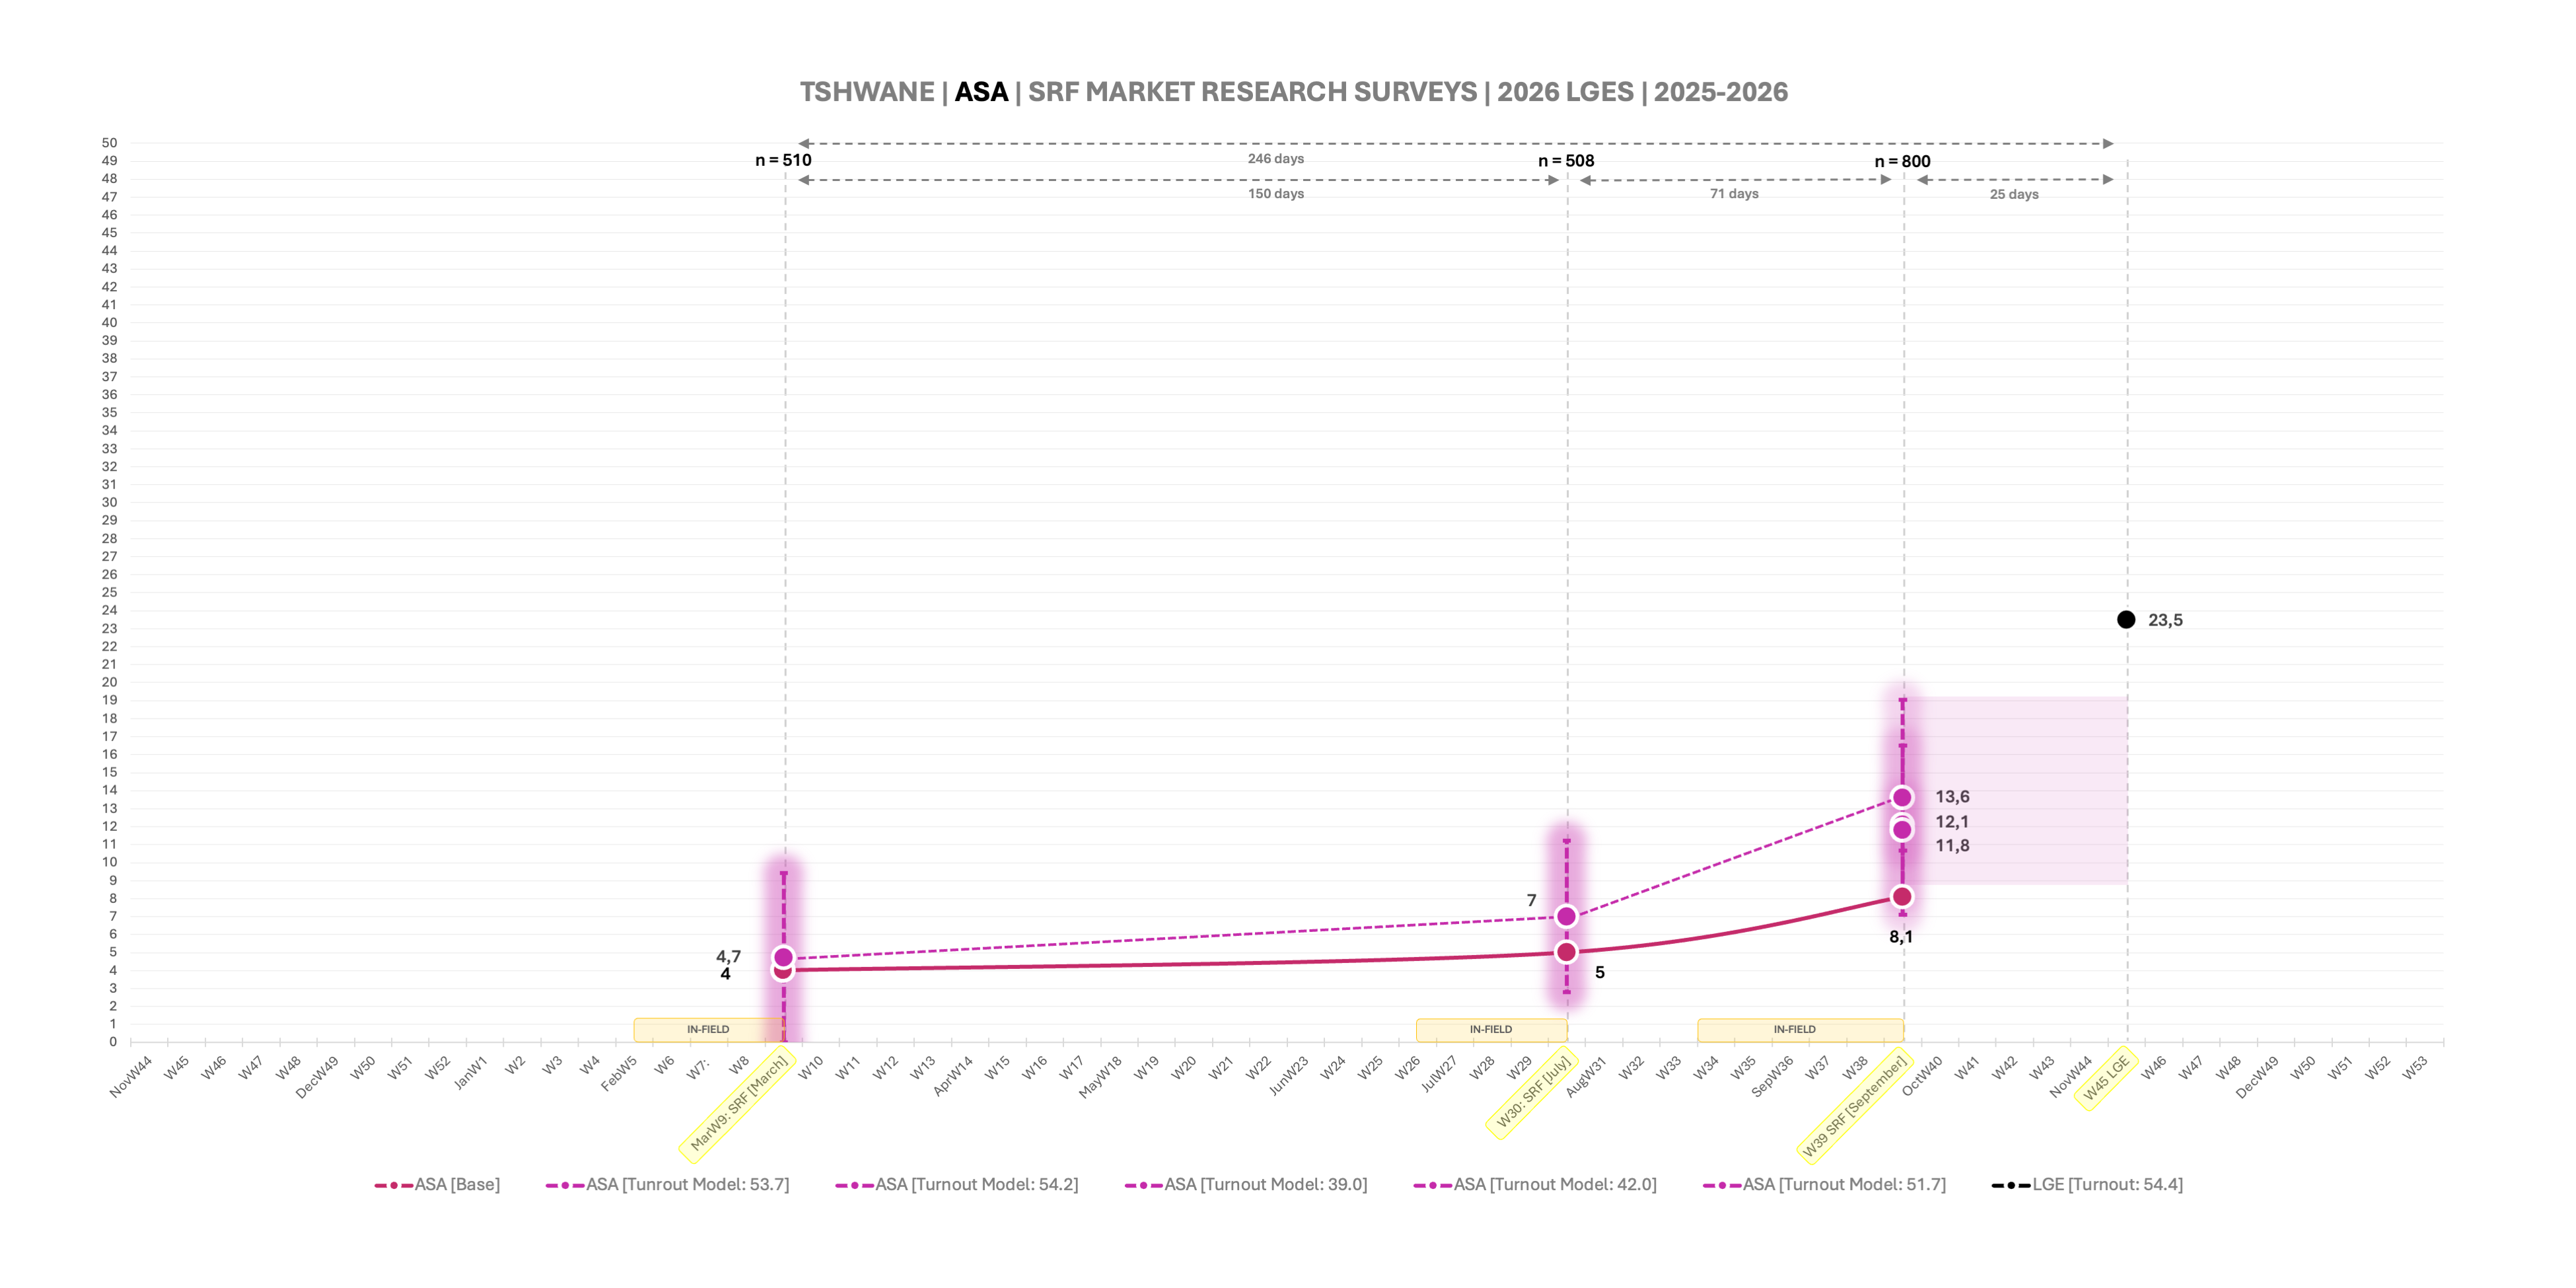
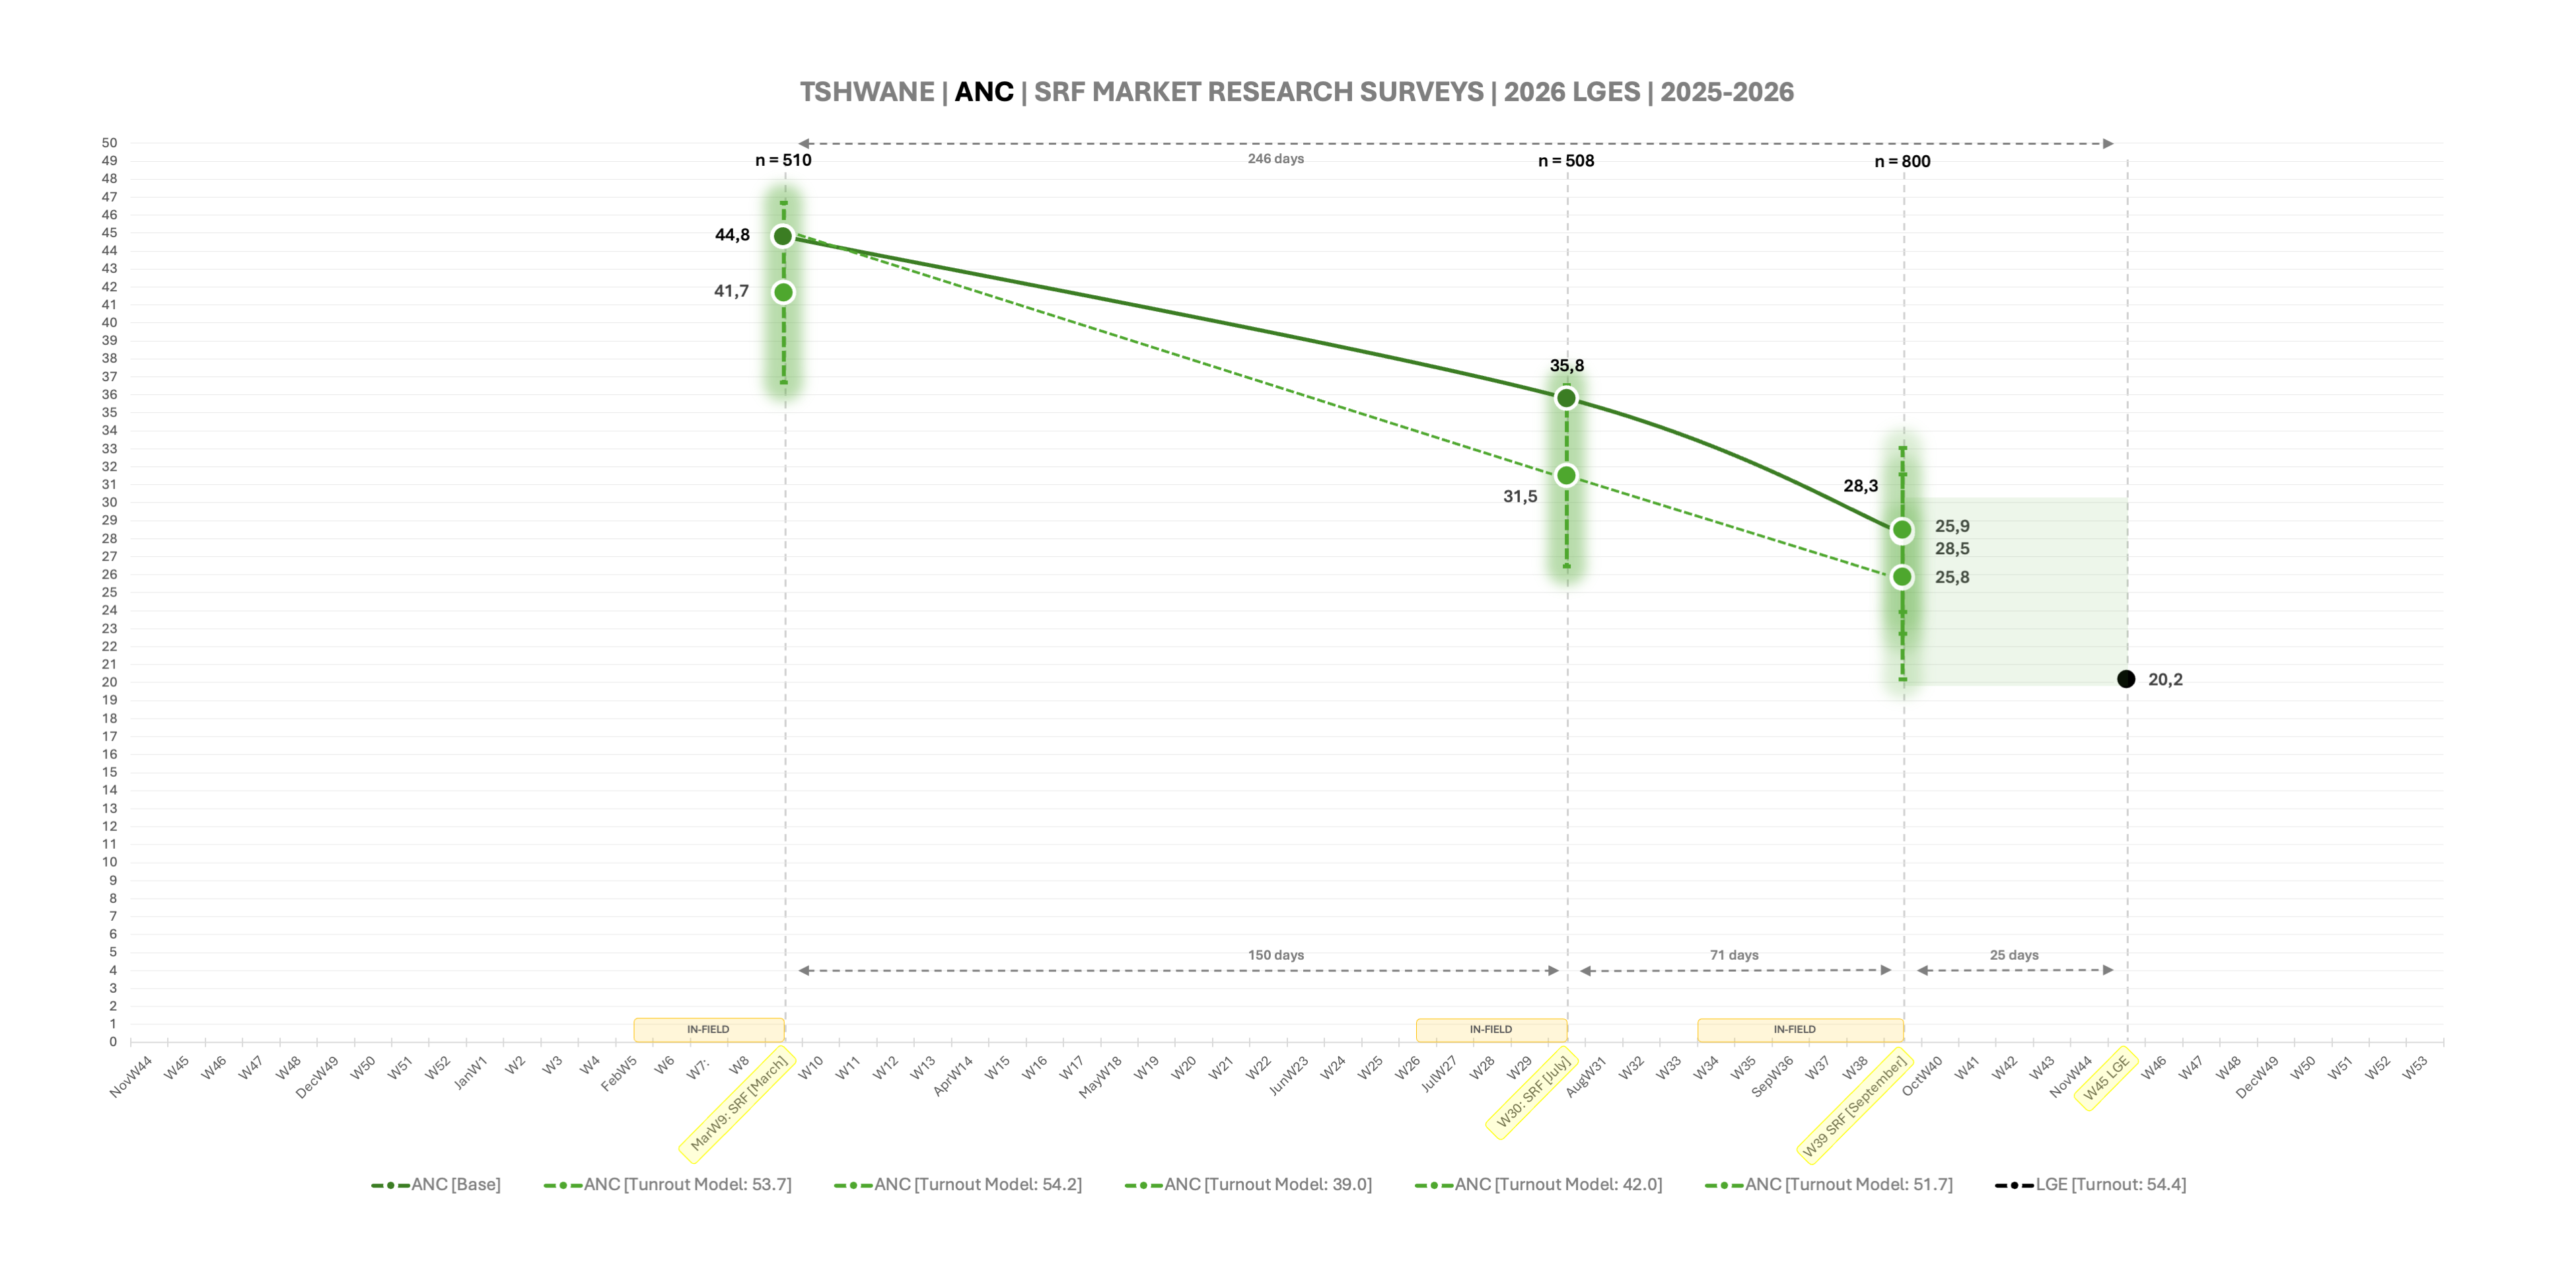
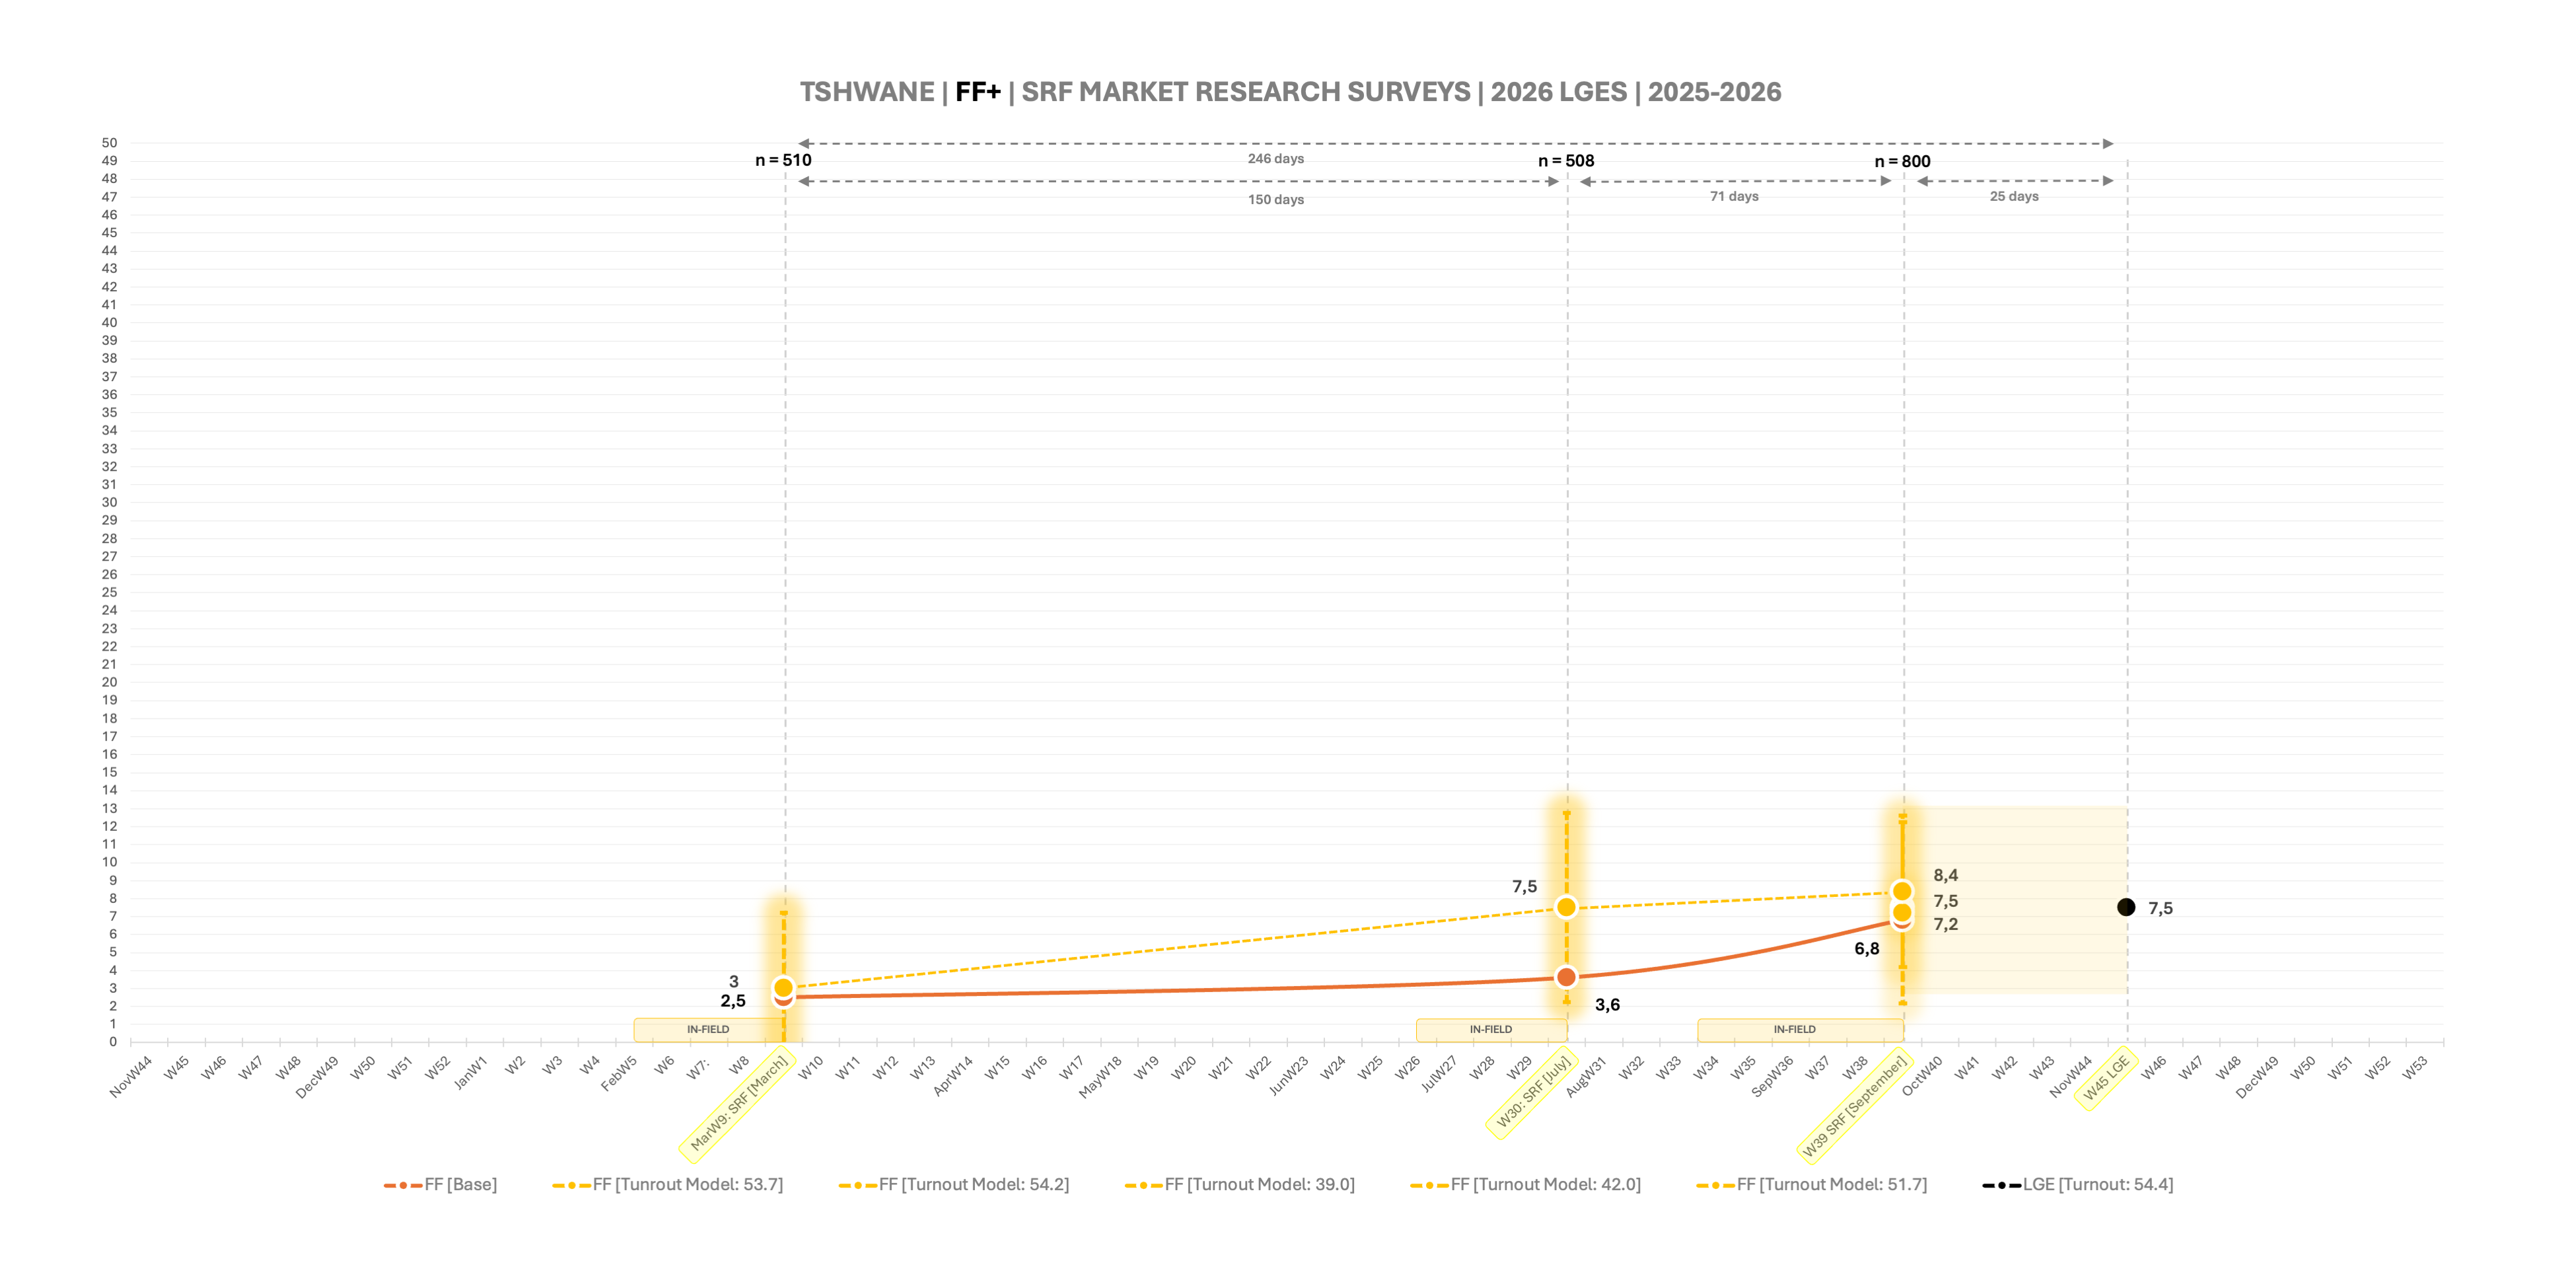
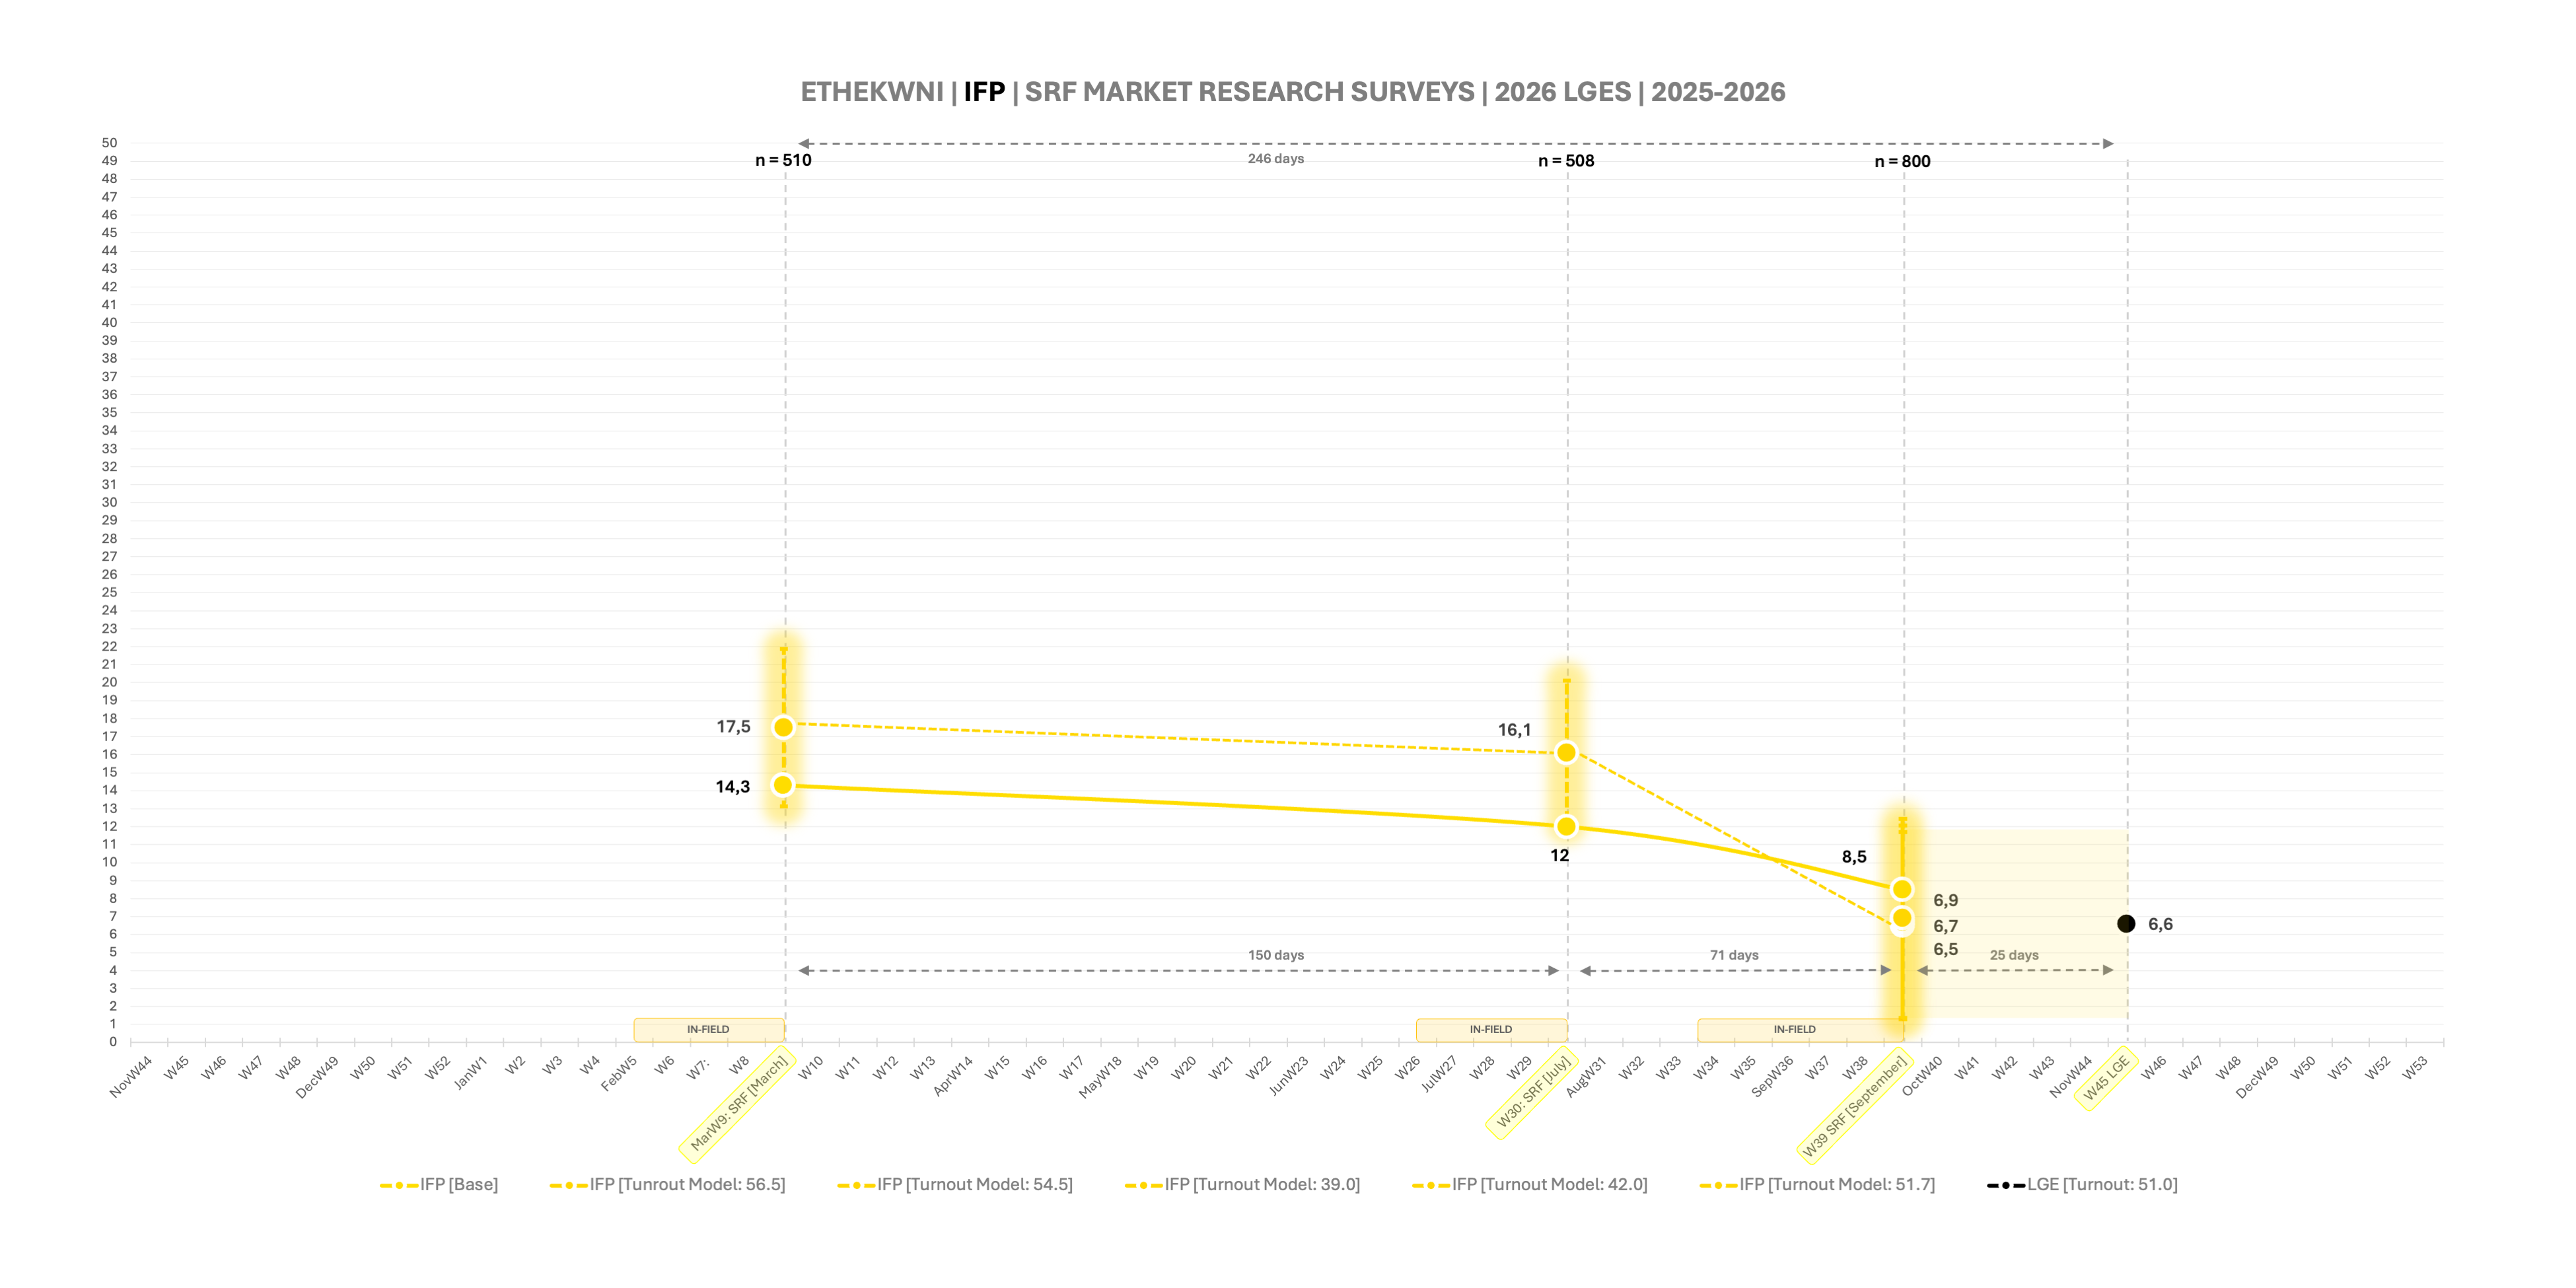
Each graph shows the party’s baseline as a solid line (its support if 100% of its voters voted), and its turnout modelled numbers, joined by the dotted line. The baseline number irrelevant for all purposes (the SRF doesn’t even publish these) other than to illustrate whether turnout benefitted or hurt a party.
The margin of error is illustrated by the size of the blur around any one point (small at national level; bigger at metro level).
Insights
The first thing to look at it how much party support moved between the final poll and election day – what happened in the 25-day window.
Here is a summary (the 50% turnout model used for all of these, as it closest to actual turnout).
- ANC: SRF September: 31.9%, Final PR percentage: 30.9%, 25-day swing: 1.0pt down
- DA: SRF September: 26.6%, Final PR percentage: 24.7%, 25-day swing: 1.9pts down
- MK: SRF September: 11.0%, Final PR percentage: 9.2%, 25-day swing: 1.8pts down
- EFF: SRF September: 8.1%, Final PR percentage: 6.2%, 25-day swing: 2.0pts down
- ASA: SRF September: 3.6%, Final PR percentage: 6.0%, 25-day swing: 2.4pts up
- IFP: SRF September: 3.8%, Final PR percentage: 4.7%, 25-day swing: 0.9pts up
- FF+: SRF September: 4.0%, Final PR percentage: 3.0%, 25-day swing: 1.0pt down
So, there clearly was some small nationally movement over the last month, typically in a 1pt – 2pt band.
The bigger parties (ANC, DA, MK) generally dropped a point or two, which was in line with their four-poll trend:
- ANC: 36.6 – 39.0 – 36.4 – 31.9 – 30.9
- DA: 32.2 – 22.8 – 27.4 – 26.6 – 24.7
- MK: 10.2 – 9.6 – 15.6 – 11.0 – 9.2
This was the core story of the big parties this election, all of them started the year out strong, most of them managing to maintain that strength until halfway through 2026, when campaigning started in earnest; then they all declined, at varying rates, as other parties ate into them, to varying degrees.
The DA’s drop off in July – 22.8 from 32.2 – is interesting, it is likely also to do to the party’s elective conference in April, which introduced some uncertainty, from which it had recovered by September. The ANC’s decline, which was steady across 2026 is more easily explained – from the lack of any discernible campaign to no mayoral candidates, to its list debacle and generally declining service delivery where it governed (water being the pre-eminent example), it systematically faded away.
The EFF, IFP and FF+ were more stable, even if the EFF did drop off at the end:
- EFF: 7.8 – 5.5 – 6.5 – 8.2 – 6.2
- IFP: 6.0 – 5.0 – 5.2 – 4.4 – 4.7
- FF+: 1.4 – 3.6 – 3.0 – 4.0 – 3.0
ASA was the only party capable of substantively capitalizing on that final month.
- ASA: 3.8 – 2.8 – 1.9 – 3.8 – 6.0
ASA’s growth started in July, and took off from there, driven almost exclusively by an explosion in support in JHB, TSH and EKU, as we shall see.
What is striking about the national graph is how little the turnout models differed from base support. There was a fundamentally different story at metro level.
Johannesburg
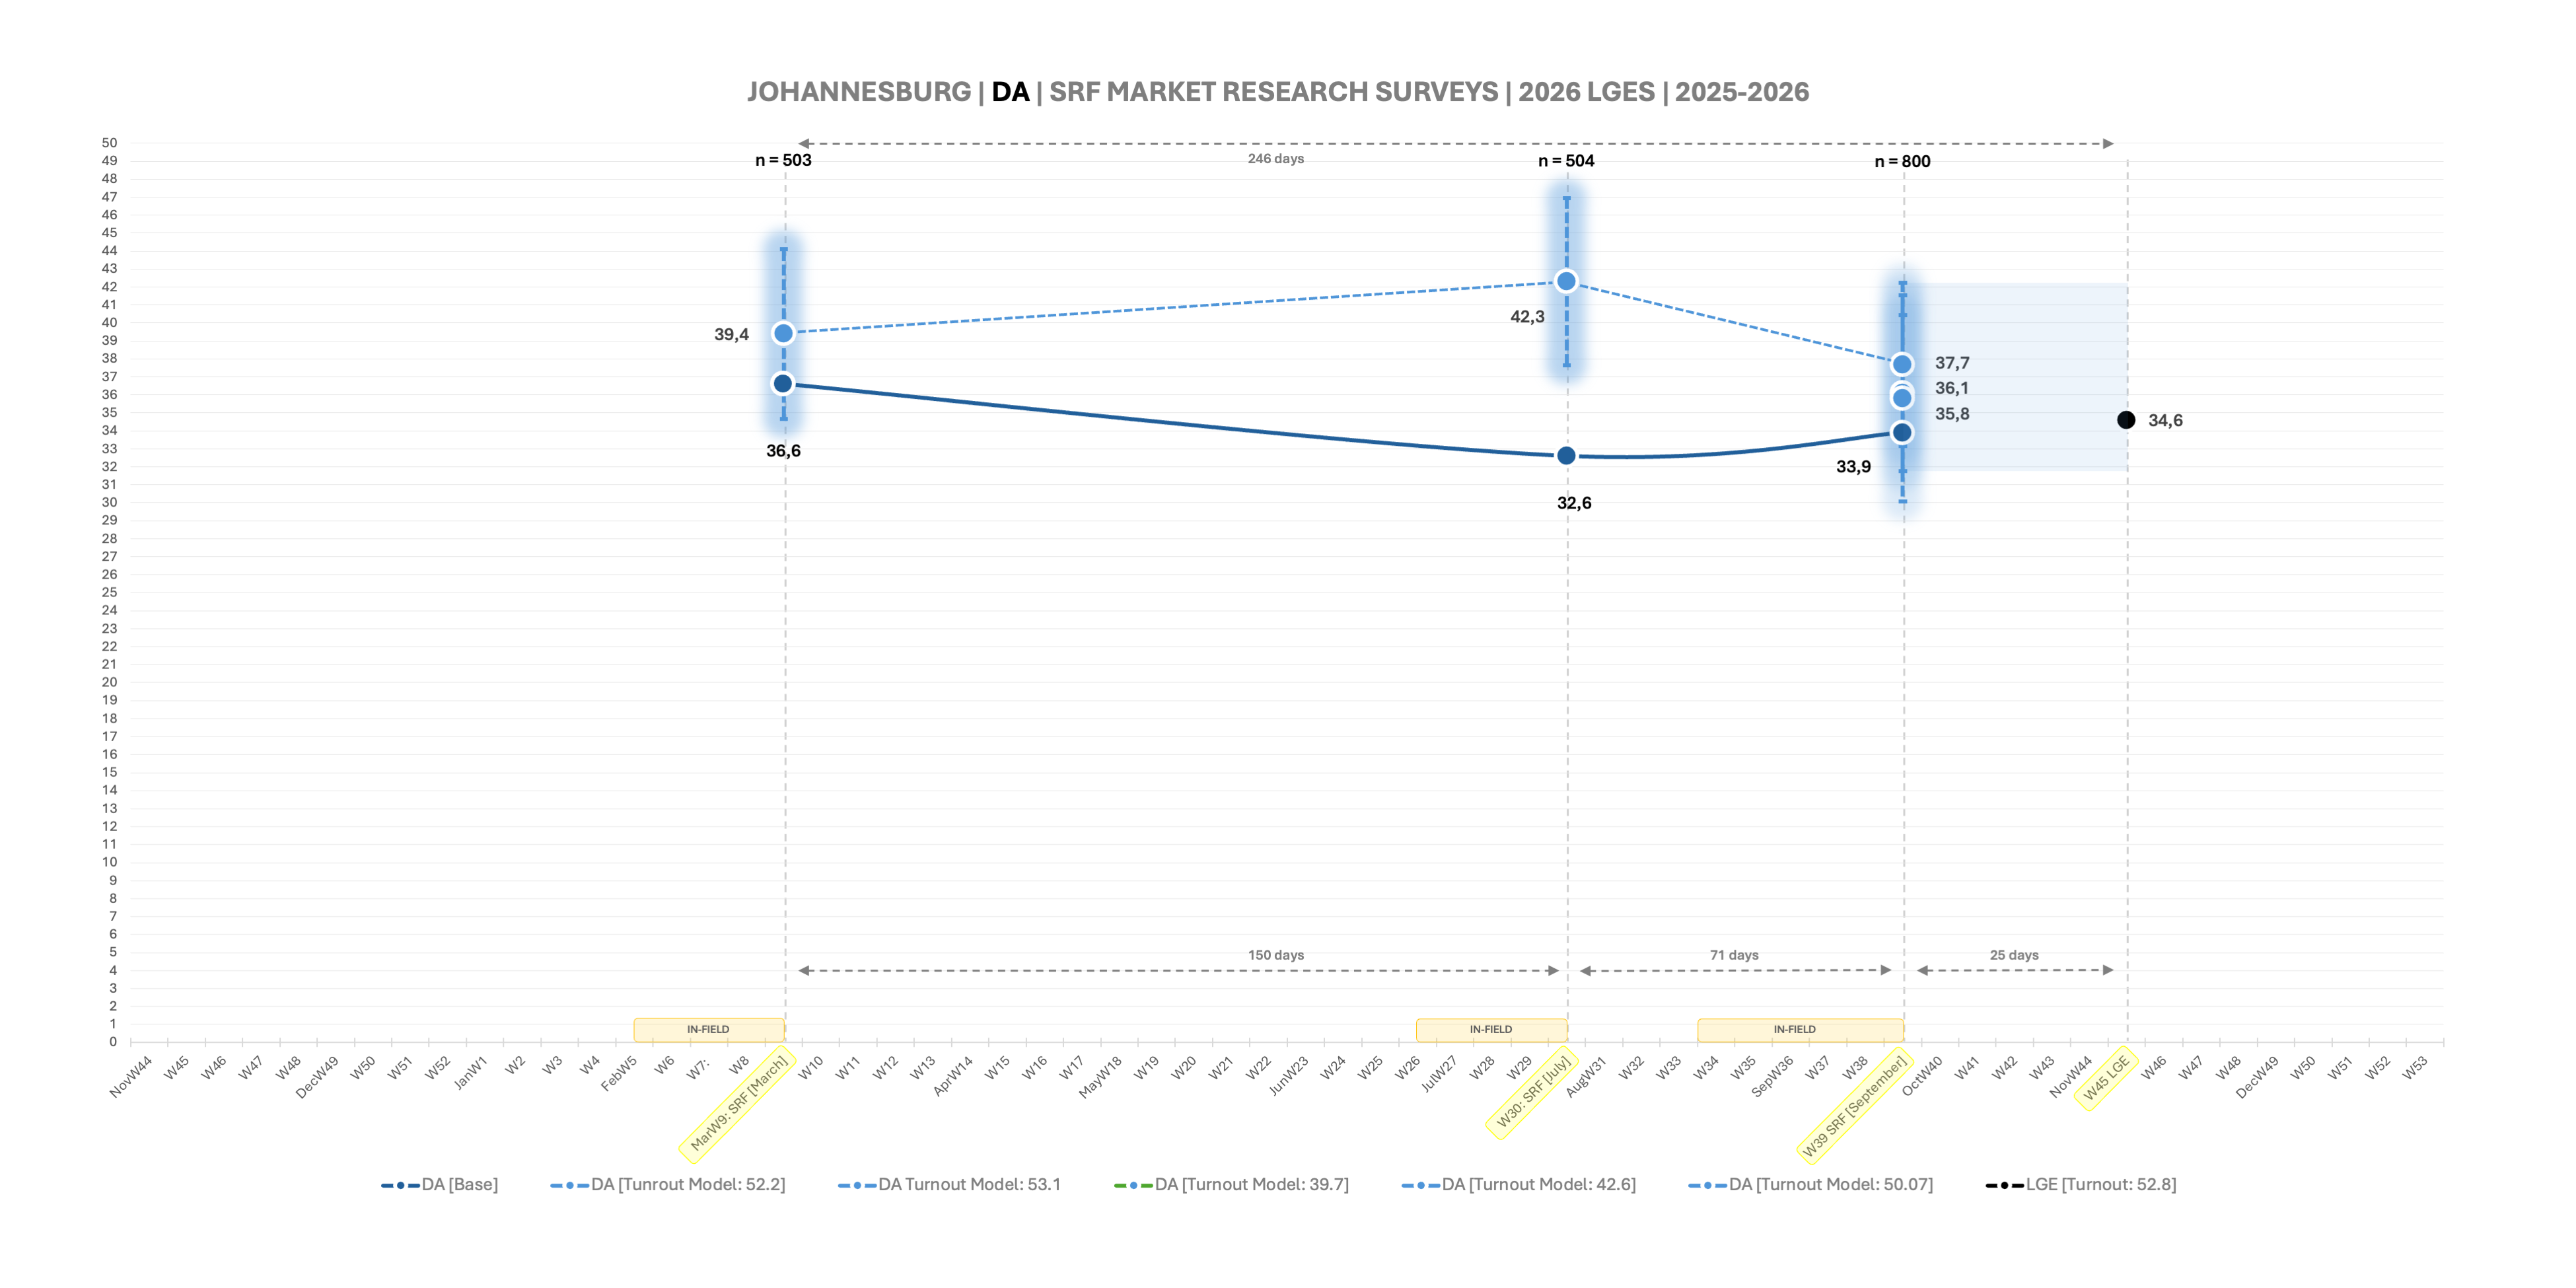
Here are the Johannesburg tracks.
Insights
Already one can see the more volatile environment, which some dramatic shifts in party support. The 25-day window thus demonstrates greater movement.
- DA: SRF September: 37.7%, Final PR percentage: 34.6%, 25-day swing: 3.1pts down
- ANC: SRF September: 20.9%, Final PR percentage: 20.4%, 25-day swing: 0.5pts down
- ASA: SRF September: 8.0%, Final PR percentage: 17.4%, 25-day swing: 9.4pts up
- EFF: SRF September: 6.3%, Final PR percentage: 6.5%, 25-day swing: 0.2pts up
- MK: SRF September: 8.8%, Final PR percentage: 5.7%, 25-day swing: 3.1pts down
One needs a bit more leigh way here, because the margin of error double the national MoE (4.4%) but the trends seem accurate. ASA’s disproportional growth in JHB is in line with its national growth, which would have been wholly reliant on what happened in the Gauteng metros.
The ANC’s and DA’s decline is powerfully evident here. By July the ANC had dropped to 18%, from which it never recovered. The DA, which started campaigning a year before anyone else, built up all the way to 42% in July, but four months later, once every other party had completed their campaigns, it was down to 37.7%, by election day it had dropped another 3pts.
Noticeable in JHB, that the turnout models, for most opposition parties outside the ANC’s universe, sit above their base support, suggesting that they all benefitted disproportionately on this front too. The ANC’s final model sits on its baseline, MK’s and the EFF’s below its baseline. The DA and ASA both have their modelled numbers consistently above their baseline.
Tshwane
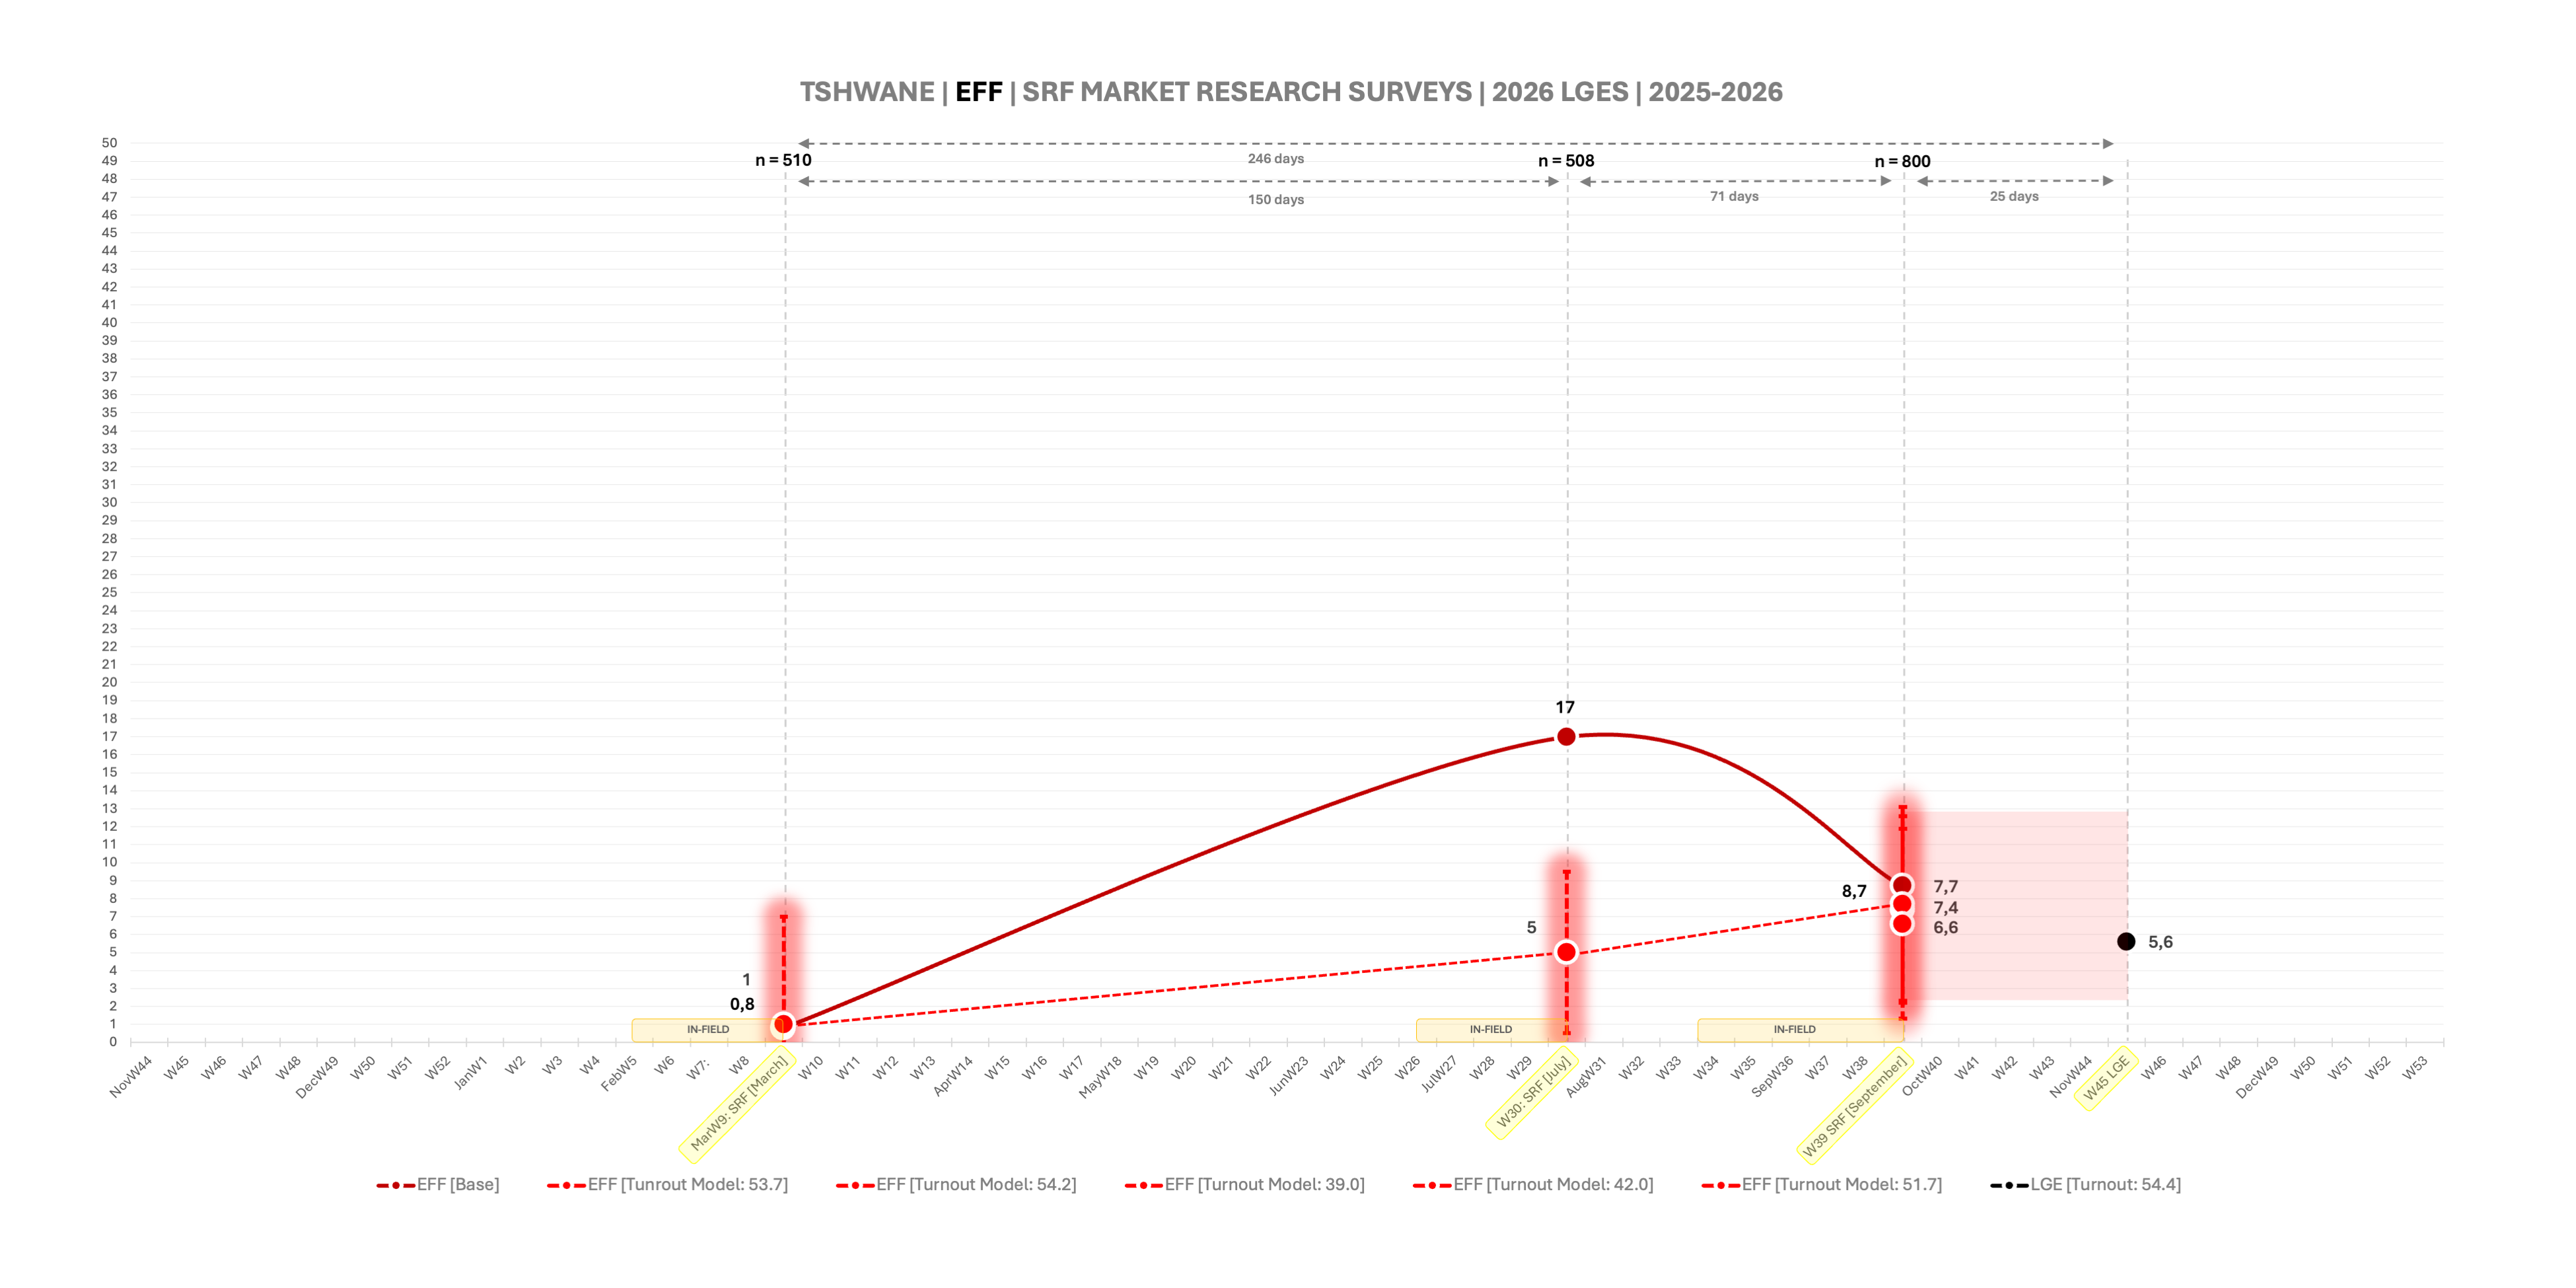
Here are the Tshwane tracks
Insights
- DA: SRF September: 31.1%, Final PR percentage: 34.0%, 25-day swing: 2.9pts up
- ASA: SRF September: 13.8%, Final PR percentage: 23.5%, 25-day swing: 9.7pts up
- ANC: SRF September: 25.8%, Final PR percentage: 20.2%, 25-day swing: 5.6pts down
- FF+: SRF September: 8.4%, Final PR percentage: 7.5%, 25-day swing: 0.9pts down
- EFF: SRF September: 7.4%, Final PR percentage: 5.6%, 25-day swing: 1.8pts down
One of, if not the most volatile metro, with substantive changes over the past 25 days.
ASA’s growth in TSH is one of the core take aways in the election, its graph captures it quite well:
- 4.7 – 7.0 – 13.8 – 23.5
It was essentially doubling support here every 30 days or so. That kind of exponential growth is very rare and is typically the sign of two things 1. The fracturing of a vote (as illustrated by the ANC’s staggering and systematic decline) and 2. A very powerful election campaign, able to take advantage of that (which both the DA, up 3pts, and to an even greater degree, ASA, up 9.7pts, were able to do. The FF+ also showed steady growth over the course of the campaign, although it did not grow in the final window.
The DA’s decline (and I must stress here, this language tough on the DA, because it’s “decline” is a relative term, it had a good solid election) mirrors what happened in JHB, a strong lead built up, then a drop off towards the end of the campaign, as other parties ate into it.
The numbers modelled for turnout are also instructive here. The DA (although dropped off at end), ASA (exponentially so) and the FF, all well above their baselines again, which speaks to their big differential advantage – something the DA obviously rectified in the final month. Once again, the ANC and EFF below their baselines.
Ethekwini
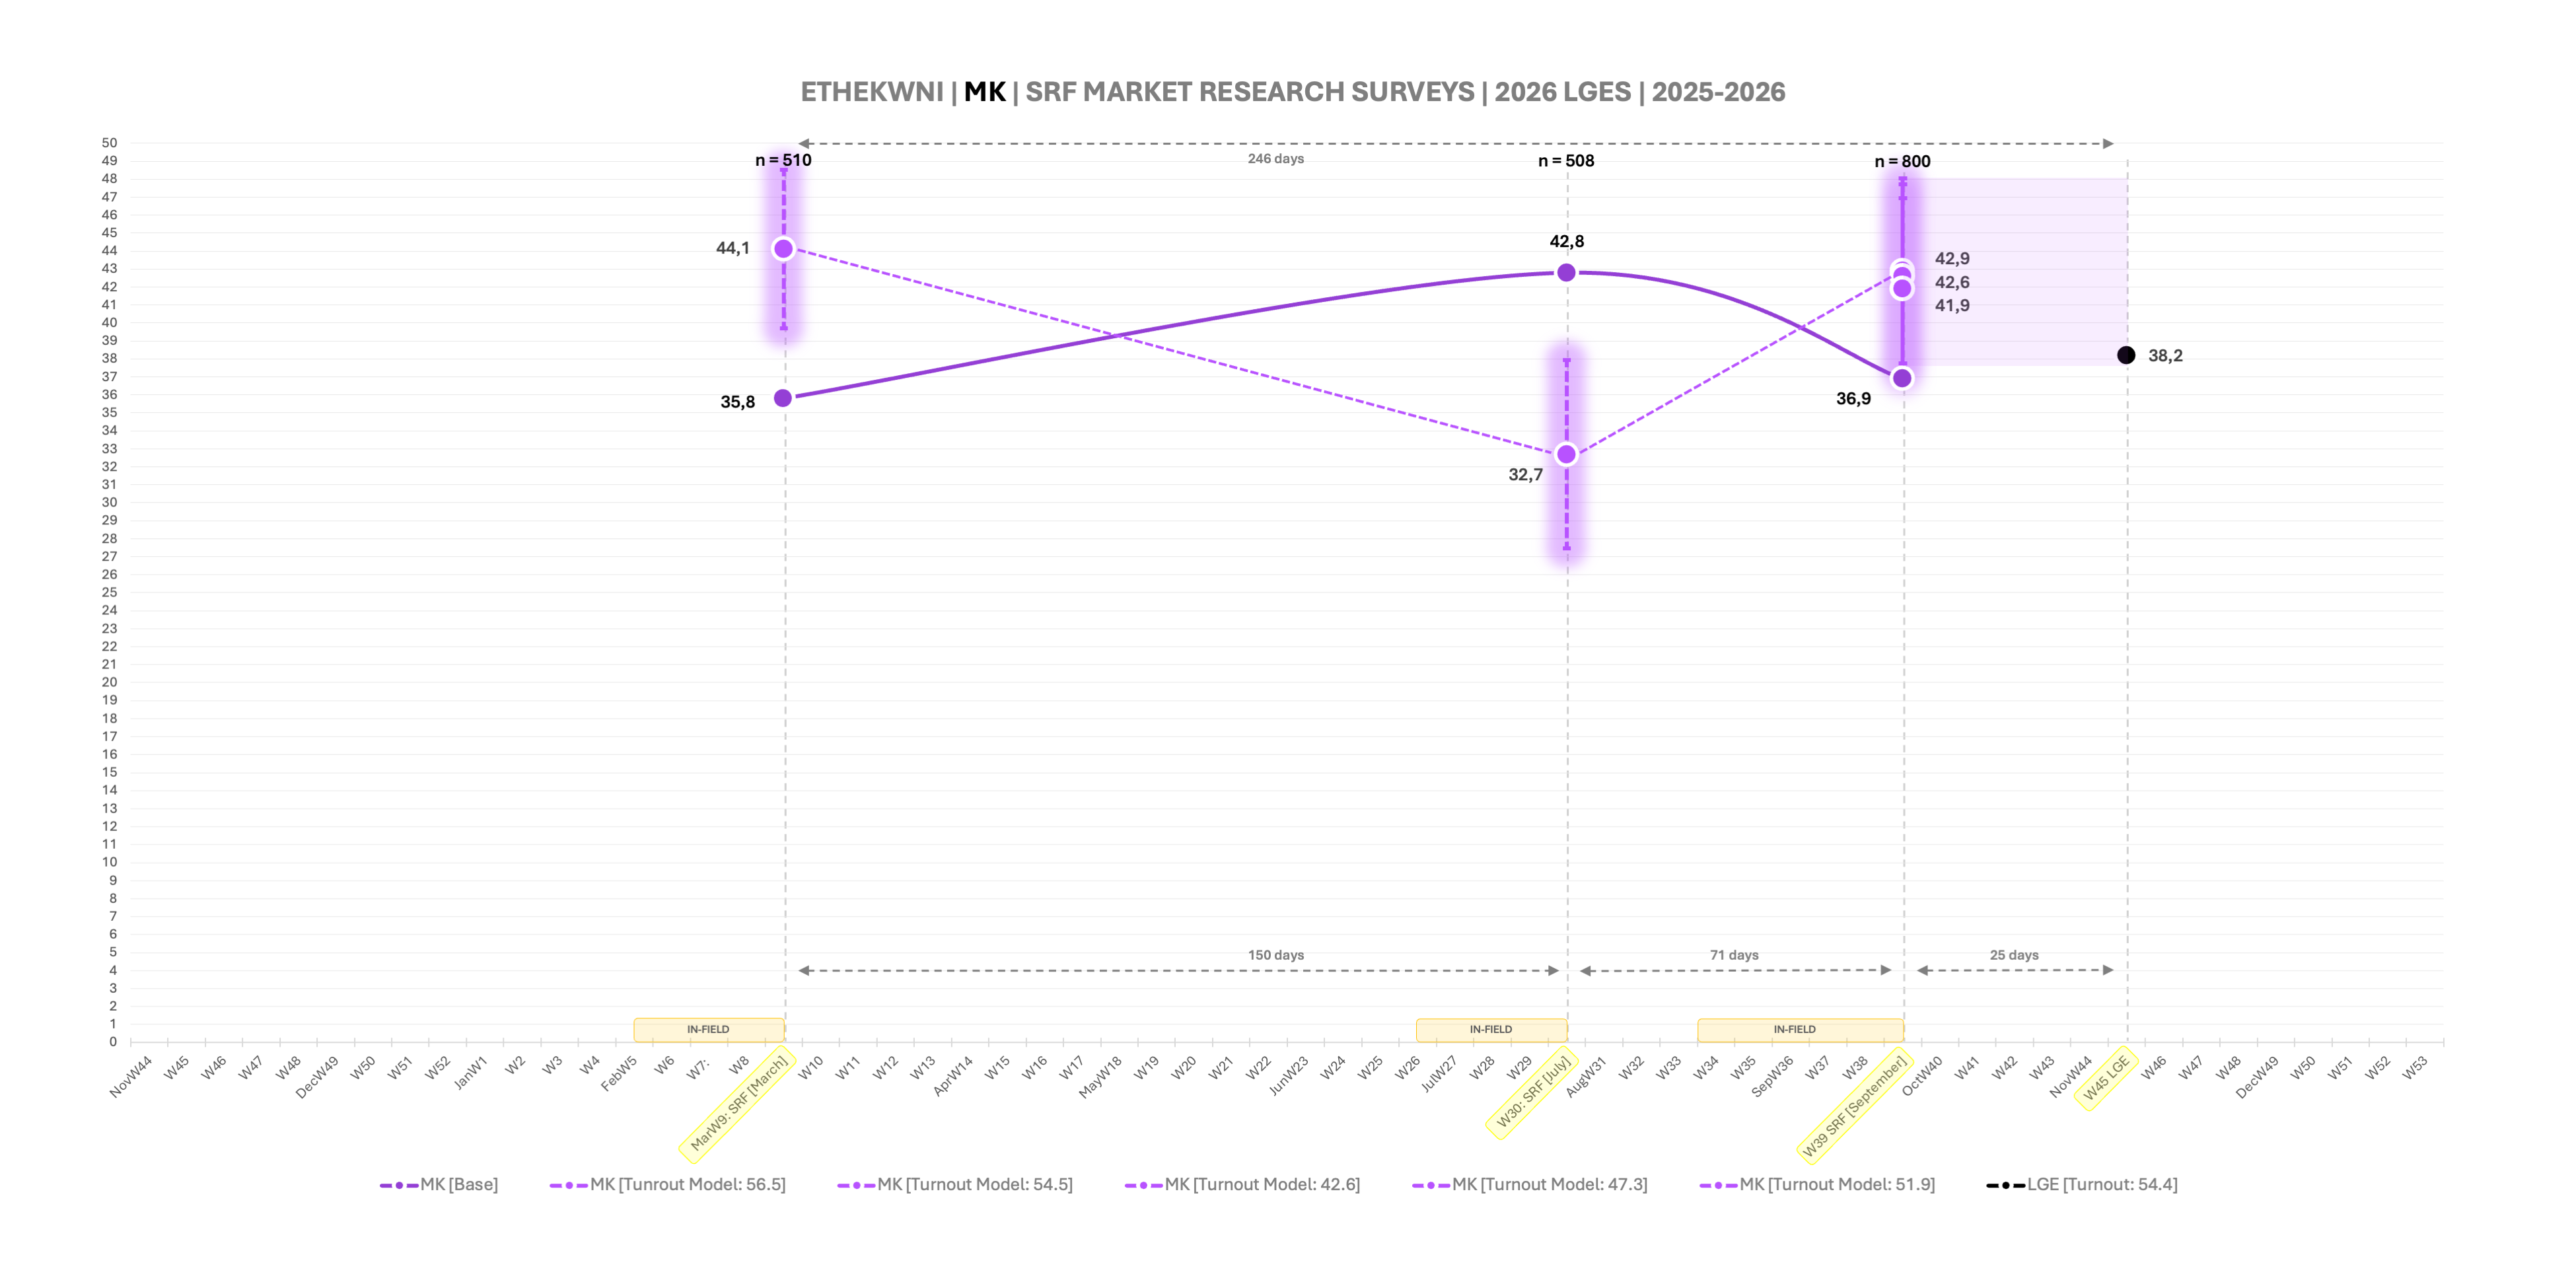
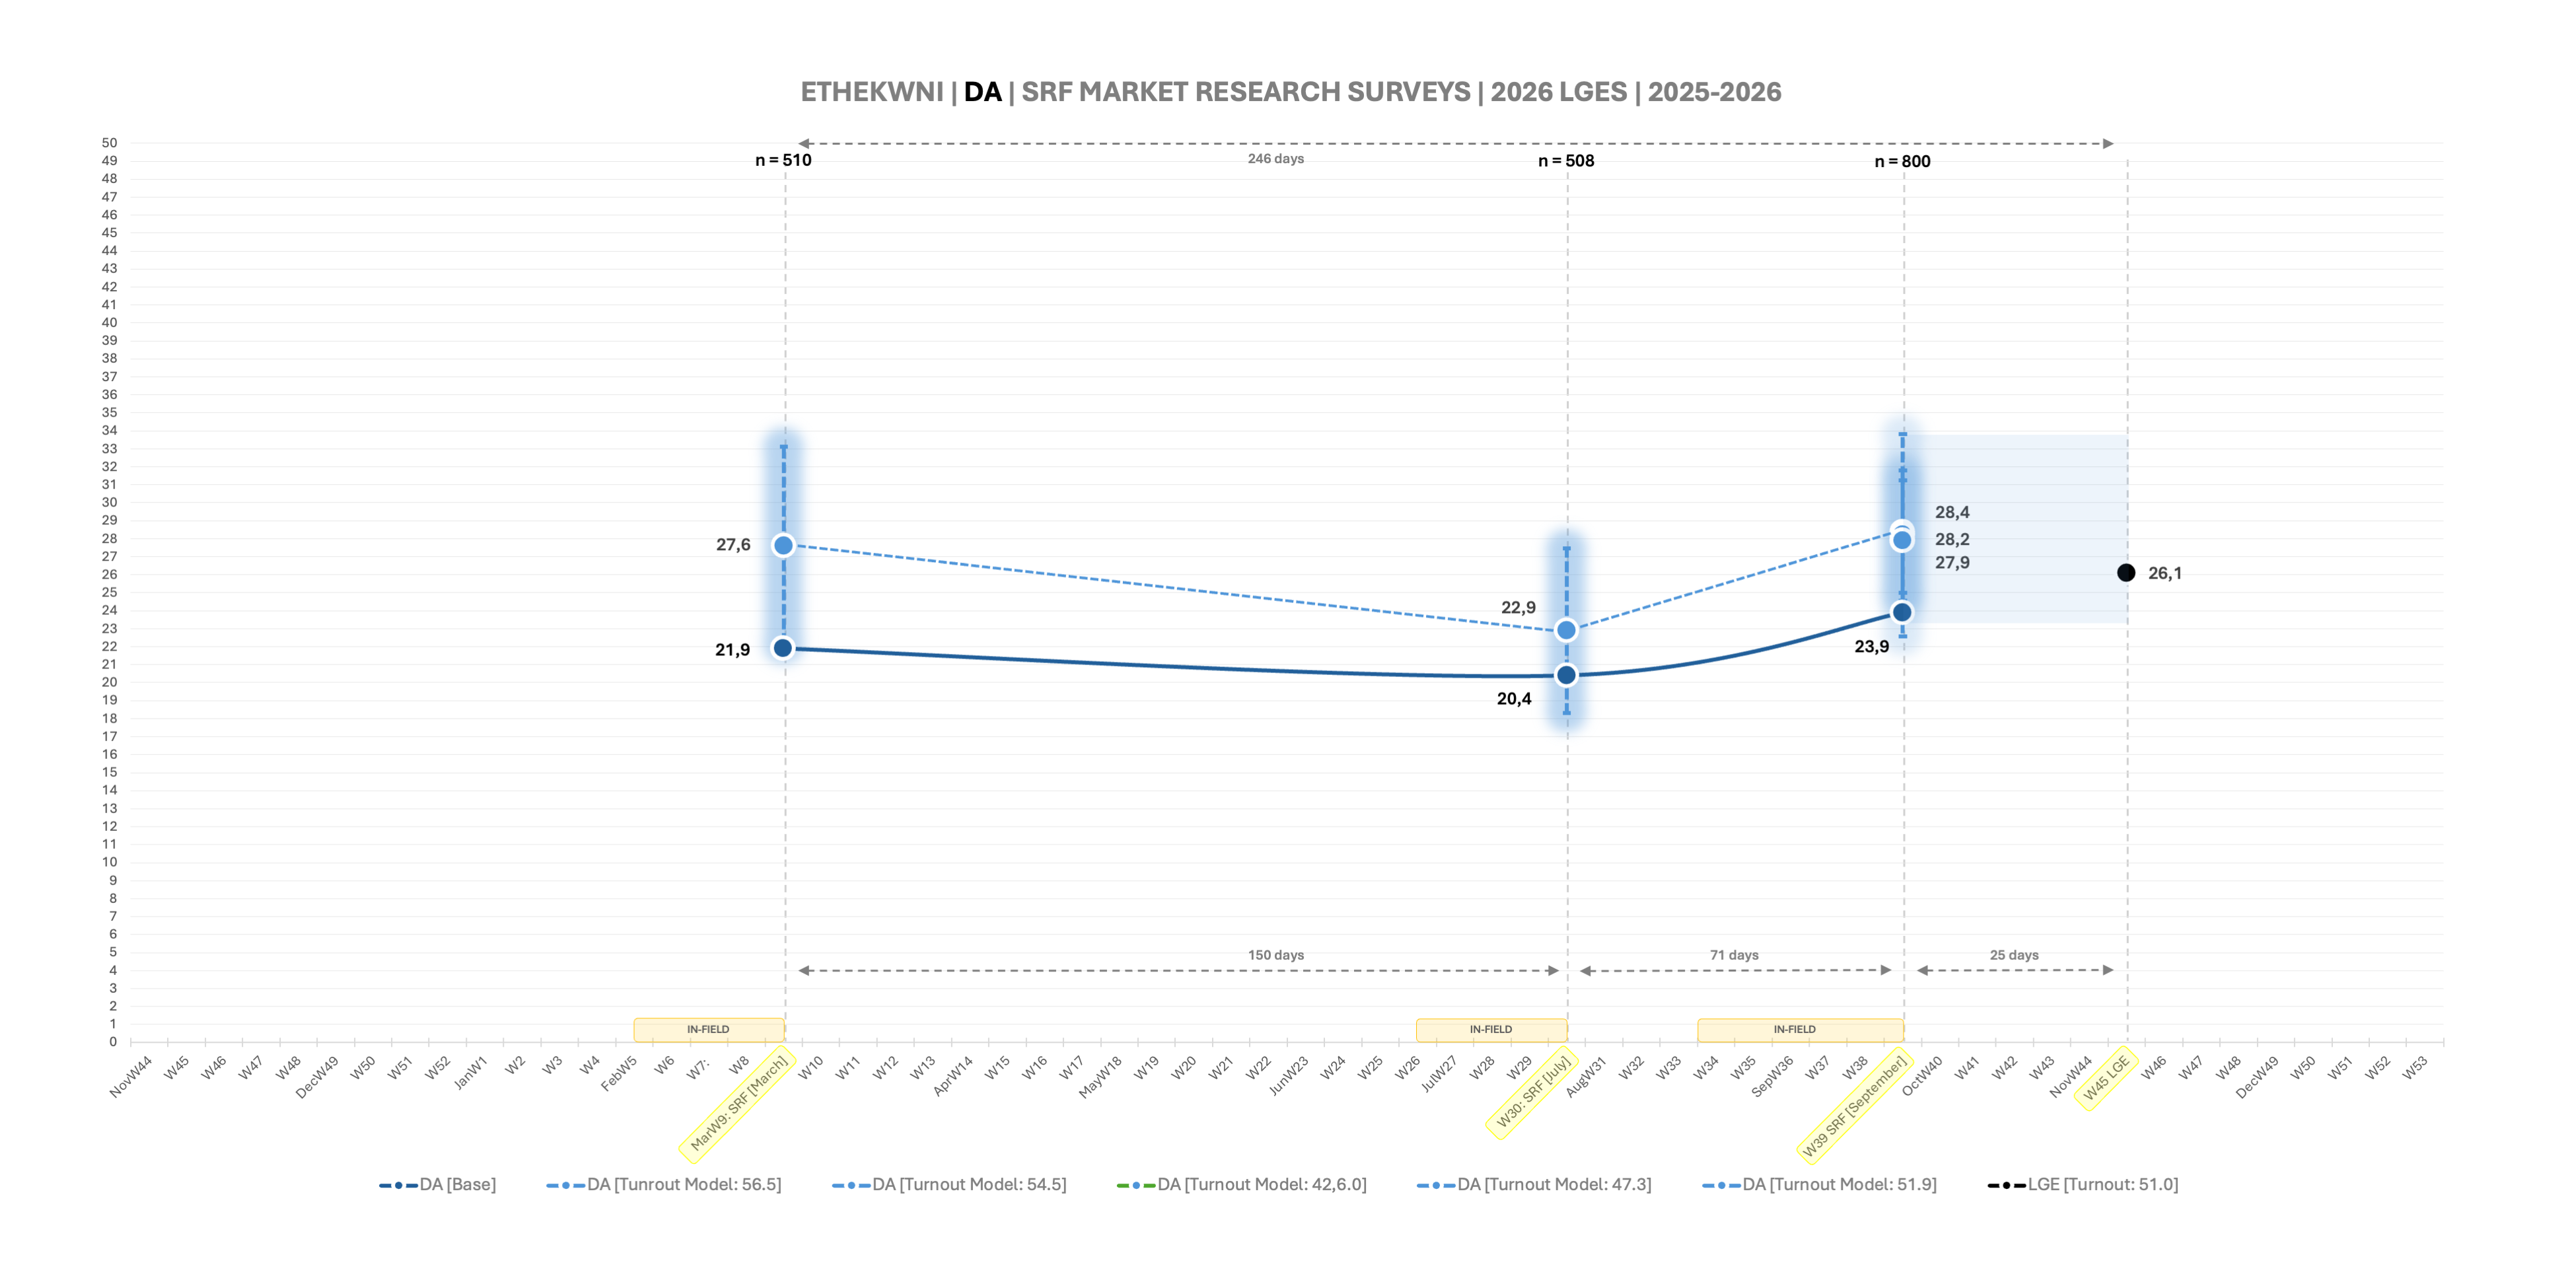
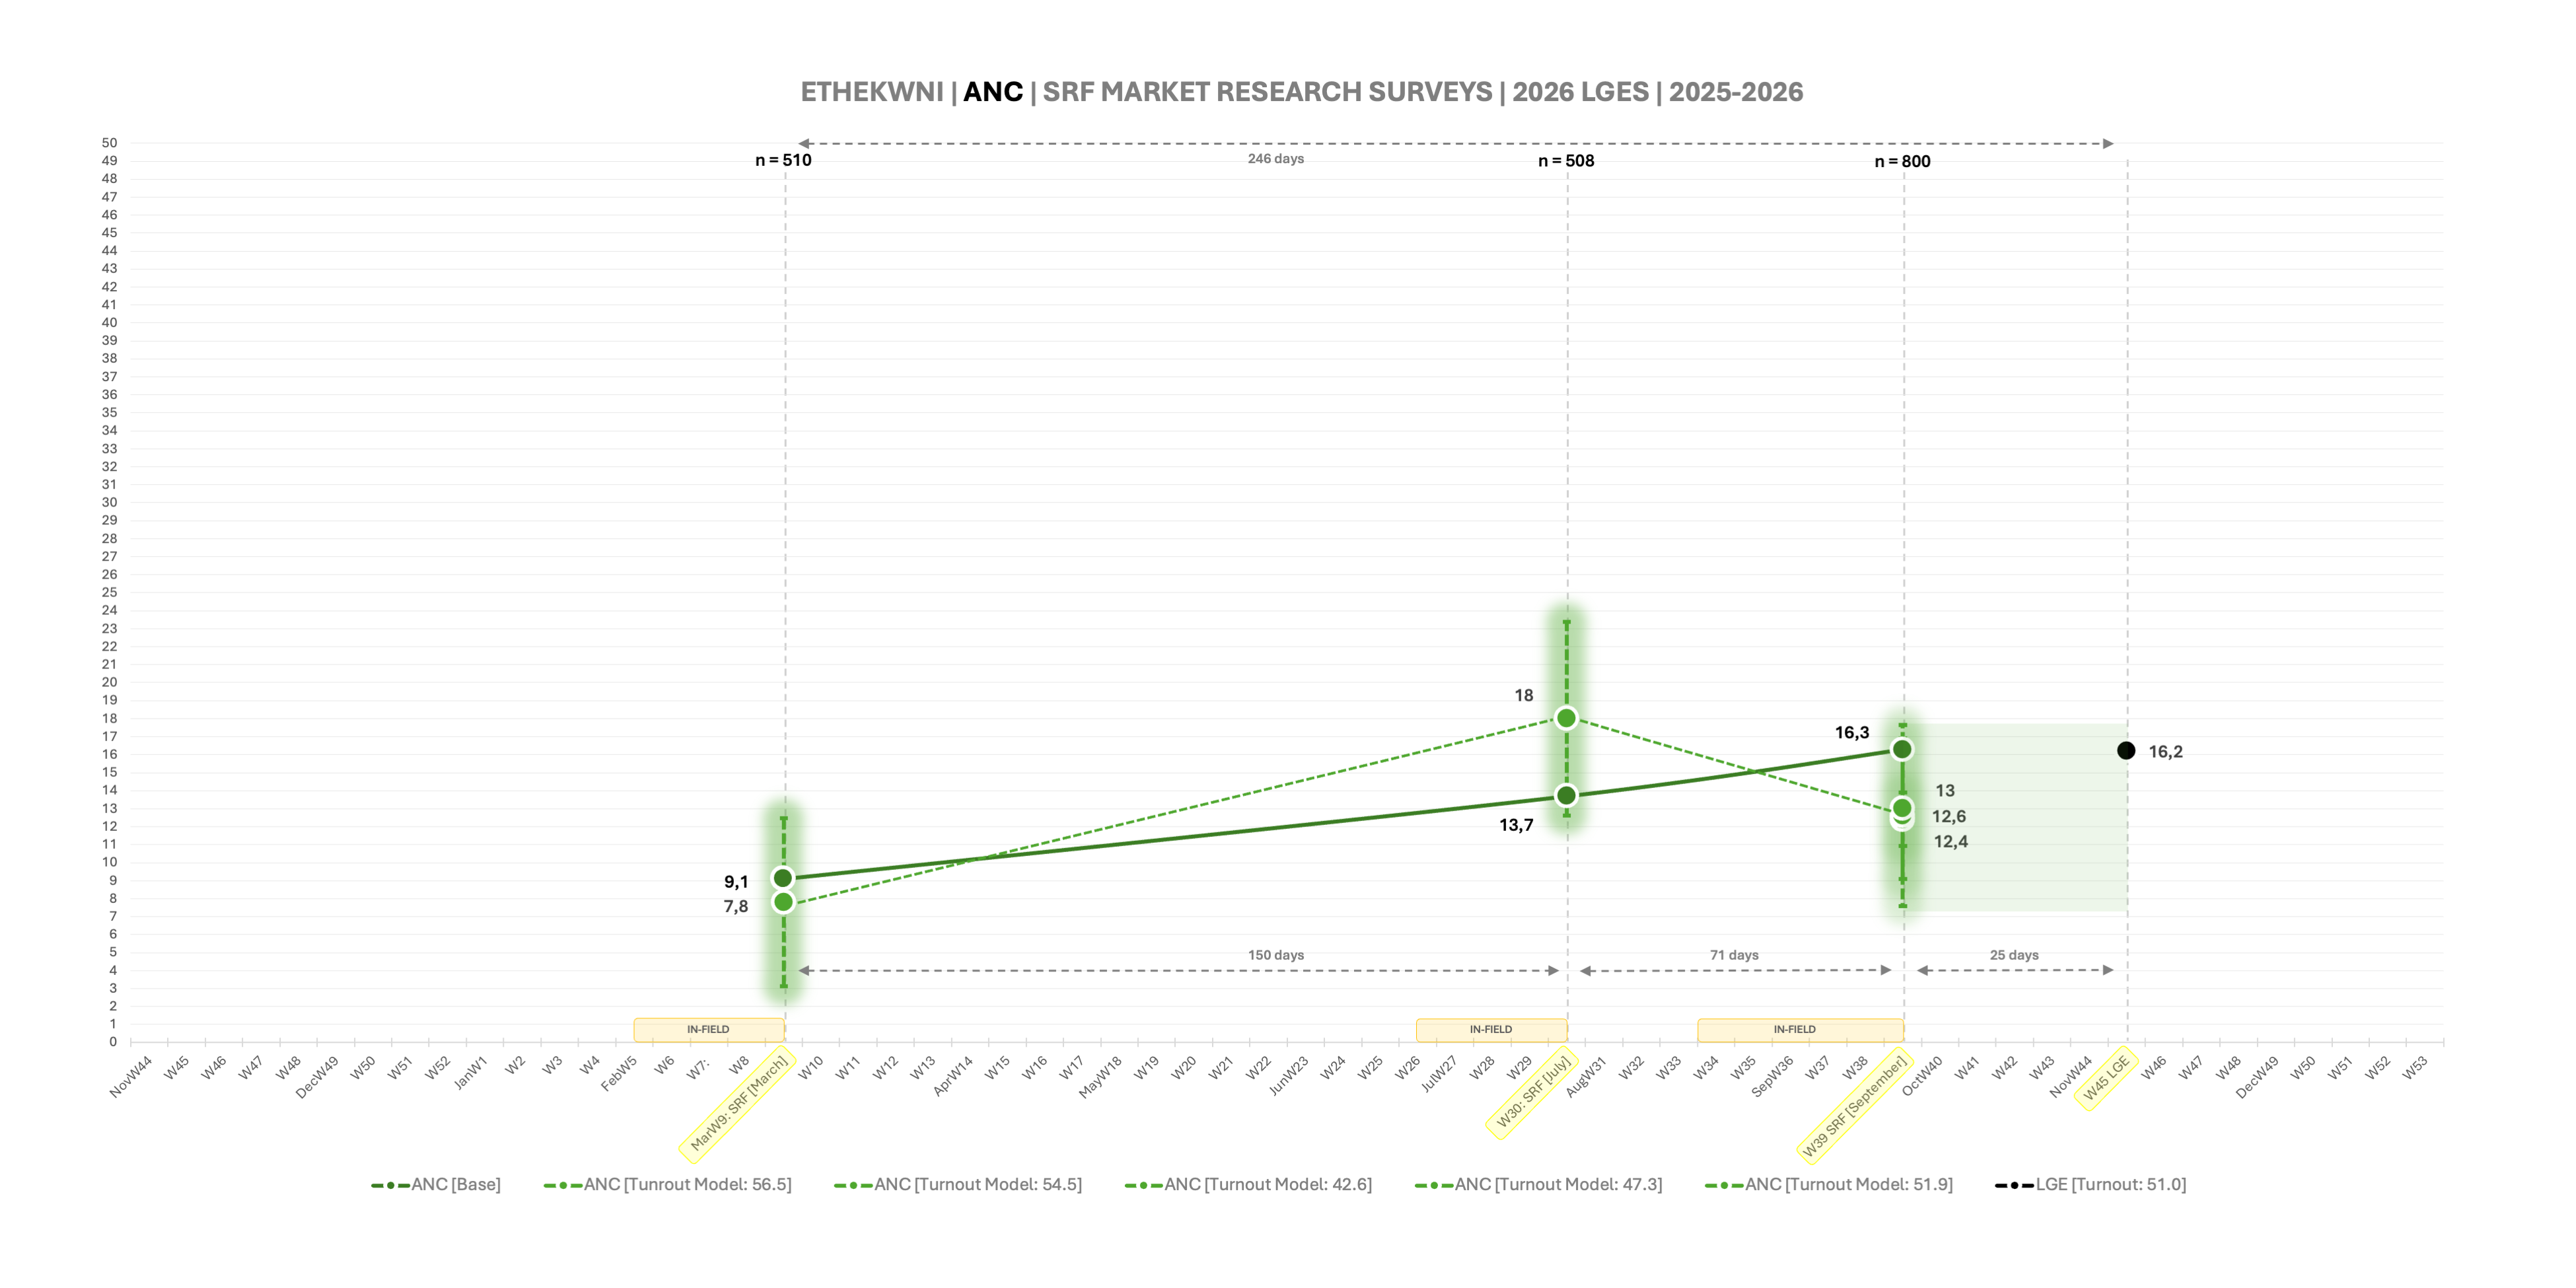
Here are the eThekwini tracks.
Insights
Another highly volatile metro, although in this case, it is an election ahead of Gauteng. The fundamental fracture has already occurred, in the form of MK in 2024, and this election was rather about establishing where party support would settle. Even then, some big fluctuations over the course the campaign, mirroring what happened in KwaZulu-Natal in 2024, where ANC, MK, DA and IFP traded positions weekly.
- MK: SRF September: 42.9%, Final PR percentage: 38.2%, 25-day swing: 4.7pts down
- DA: SRF September: 28.4%, Final PR percentage: 26.1%, 25-day swing: 2.3pts down
- ANC: SRF September: 12.6%, Final PR percentage: 16.2%, 25-day swing: 4.0pts up
- IFP: SRF September: 6.9%, Final PR percentage: 6.6%, 25-day swing: 0.3pts down
Counter-intuitive as it may seem, the ANC had a good election in ETH, if you use 2024 as your frame of reference, as opposed to 2021. In July, it even managed a positive turnout differential. But from a year out to election day, it unequivocally grew, from 8% to 16%, and if there is any encouragement to be taken from an otherwise dismal showing in 2026, it is ETH.
MK could not translate a powerful and substantive support base into a turnout differential on the day, it had secured one by September, but over the course of the last month, it clearly faded away and it dropped almost five points – the enthusiasm that defined its support base in 2024 never fully materializing.
The DA’s performance in ETH was very strong, a powerful and consistent turnout differential, and although it did drop a couple of points in the final window, it still will have outperformed its baseline.
Concluding thoughts
It is quite clear from the various tracks, that the election campaign itself made a powerful impact on the metros. This is a relatively new phenomenon, and a healthy one. Although tough on pollsters (need metro tracking polls in the future!) In the past, much like national and provincial elections, metro support has remained generally stable among the big parties, and that final window produces far less dramatic change.
This was very different, the whole election was. The ANC’s collapse, particularly in the townships, saw a great many parties benefitting. In JHB, TSH and EKU, ASA exploded at an exponential rate, and the DA more than doubled its support among black voters. In places like Emfuleni, the DA exploded just like ASA did in the metros. In BUF, the UDM found a new lease of life. In MAN and NMB, the DA achieved an all-time high in MAN and almost matched its 2016 zenith in NMB. Throughout, the SACP made a marginal impact with a solid 2.5%. MK, although it did not grow, established footholds in JHB and EKU. In CPT, the DA achieved new highs in the townships. Even the FF+ managed a percent among black township voters. This election truly was a feeding frenzy for the opposition, and the SRF’s surveys illustrate it well.
That brings to the fore the questions about campaigns themselves. Whatever ASA did was highly effective in Gauteng and grew more effective over time. The DA will be wondering if its year-long campaign was ultimately the best strategy. It certainly delivered powerful and early support, but it could not hold onto a lot of it when the field became more contested. It is a question without an answer, because it might well be the case that whatever relative advantage it did manage to secure, more of it stayed with the party than not. impossible to say. South Africa’s urban centers are now clearly some of the most competitive electoral market places this country has ever seen, increasingly prone to much fluidity and change.
One thing is sure: you cannot afford to not run a campaign at all. That was probably never the ANC’s intention, it simply fell apart quicker than it could hold itself together over the course of 2026. But for a feeding frenzy, there must be something to feed on. And one thing every poll makes crystal clear, is that twitching, bloodied body, ragged and frantically trying to keep its head above the water, is the ANC’s.
This essay is the 19th in an on-going series on Election 2026/7, for all other editions of this series, please click here: Election 2026/7
Discover more from inside politics
Subscribe to get the latest posts sent to your email.


You must be logged in to post a comment.