
Election 2026/7 [1] Turnout, Johannesburg, the ANC and DA
by The Editor

A comprehensive look at turnout trends, starting nationally and moving to Johannesburg, with a focus on the ANC and DA. All indications are the ANC is in terminal decline, a problem exacerbated by low turnout; however, the DA has problems of its own on this front, and few places make the case better than Johannesburg.
Turnout, Johannesburg, the ANC and DA
By: Gareth van Onselen
Follow @GvanOnselen
10 September 2025
This essay is the 1st in an on-going series on Election 2025/6, for all other editions of this series, please click here: Election 2026/7
Introduction
A brief introduction to this series: As with the 2024 national and provincial elections, I am going to produce a series of in-depth, statistically driven analytical essays on the upcoming local government elections (to be held at some point between November 2026 and January 2027).
Each essay will focus on a single insight, aiming to deepen understanding of that issue rather than cover all factors at play.
Turnout: The national picture
Turnout is a measure of enthusiasm; and enthusiasm is a measure of legitimacy. When it comes to our local government elections, both are heavily in the red.
As South African turnout declines (the proportion of registered voters who vote on Election Day), so the African National Congress (ANC) electoral decline has worsened, the two being intricately linked. Thus, turnout trends are all important in understanding the lay of the land. And nowhere is that understanding more important than in our urban centres – where opposition parties historically perform best. Johannesburg epitomizes this.
But let us start nationally and work our way down to the city of “gold”.
Exacerbated by Covid-19, turnout in the last local government elections (2021) went through the floor (45.8% for the PR vote). This bucked a trend. In the 2011 (57.6%) and 2016 (58%) local government election, turnout grew. Although this growth was primarily driven by opposition voters, it was encouraging, given the dismal state of domestic politics. But Covid put an end to all that.
It was not Covid alone. The ANC’s turnout has been on the decline for some time. The party suffers numerous ailments, corruption and incompetence among them, but these have symptoms of their own, and the ANC body politic is rife with alienation and apathy as a result.
Typically, national elections provide some relief on this front, ANC voters are generally more enthused about national, as opposed to local, elections. However, it got little or no reprieve in the 2024 national election, which likewise saw a significant turnout decline (down to 58.6%, an all-time low). And that was without Covid. So, no turnout recovery in the last national elections for the ANC and the scene is set for a dismal turnout, across the board, in 2025/26.
The graph below plots each turnout percentage, for every national and local government election since 1999.

The blue line, which jags like a set of teeth, beautifully demonstrates how turnout fluctuates between national and local election. The dark orange dotted line links only the national turnout percentages; the light orange dotted line, only the local election percentages. In between them is a trend line, that accounts for both.
The trendline suggests turnout in the next local government elections is set to end up somewhere in the 30% range.
As intimated above, this represents a profound problem for the ANC. The behaviour of its voters, by and large, determine national trends and, sure enough, if you plot the ANC’s electoral performance against turnout, as per the graph below, you can see how the decline in democratic enthusiasm mirrors the ANC’s decline in votes. Thus, the ANC’s vote share also seems set to plunge far into the 30% bracket. If not, lower.
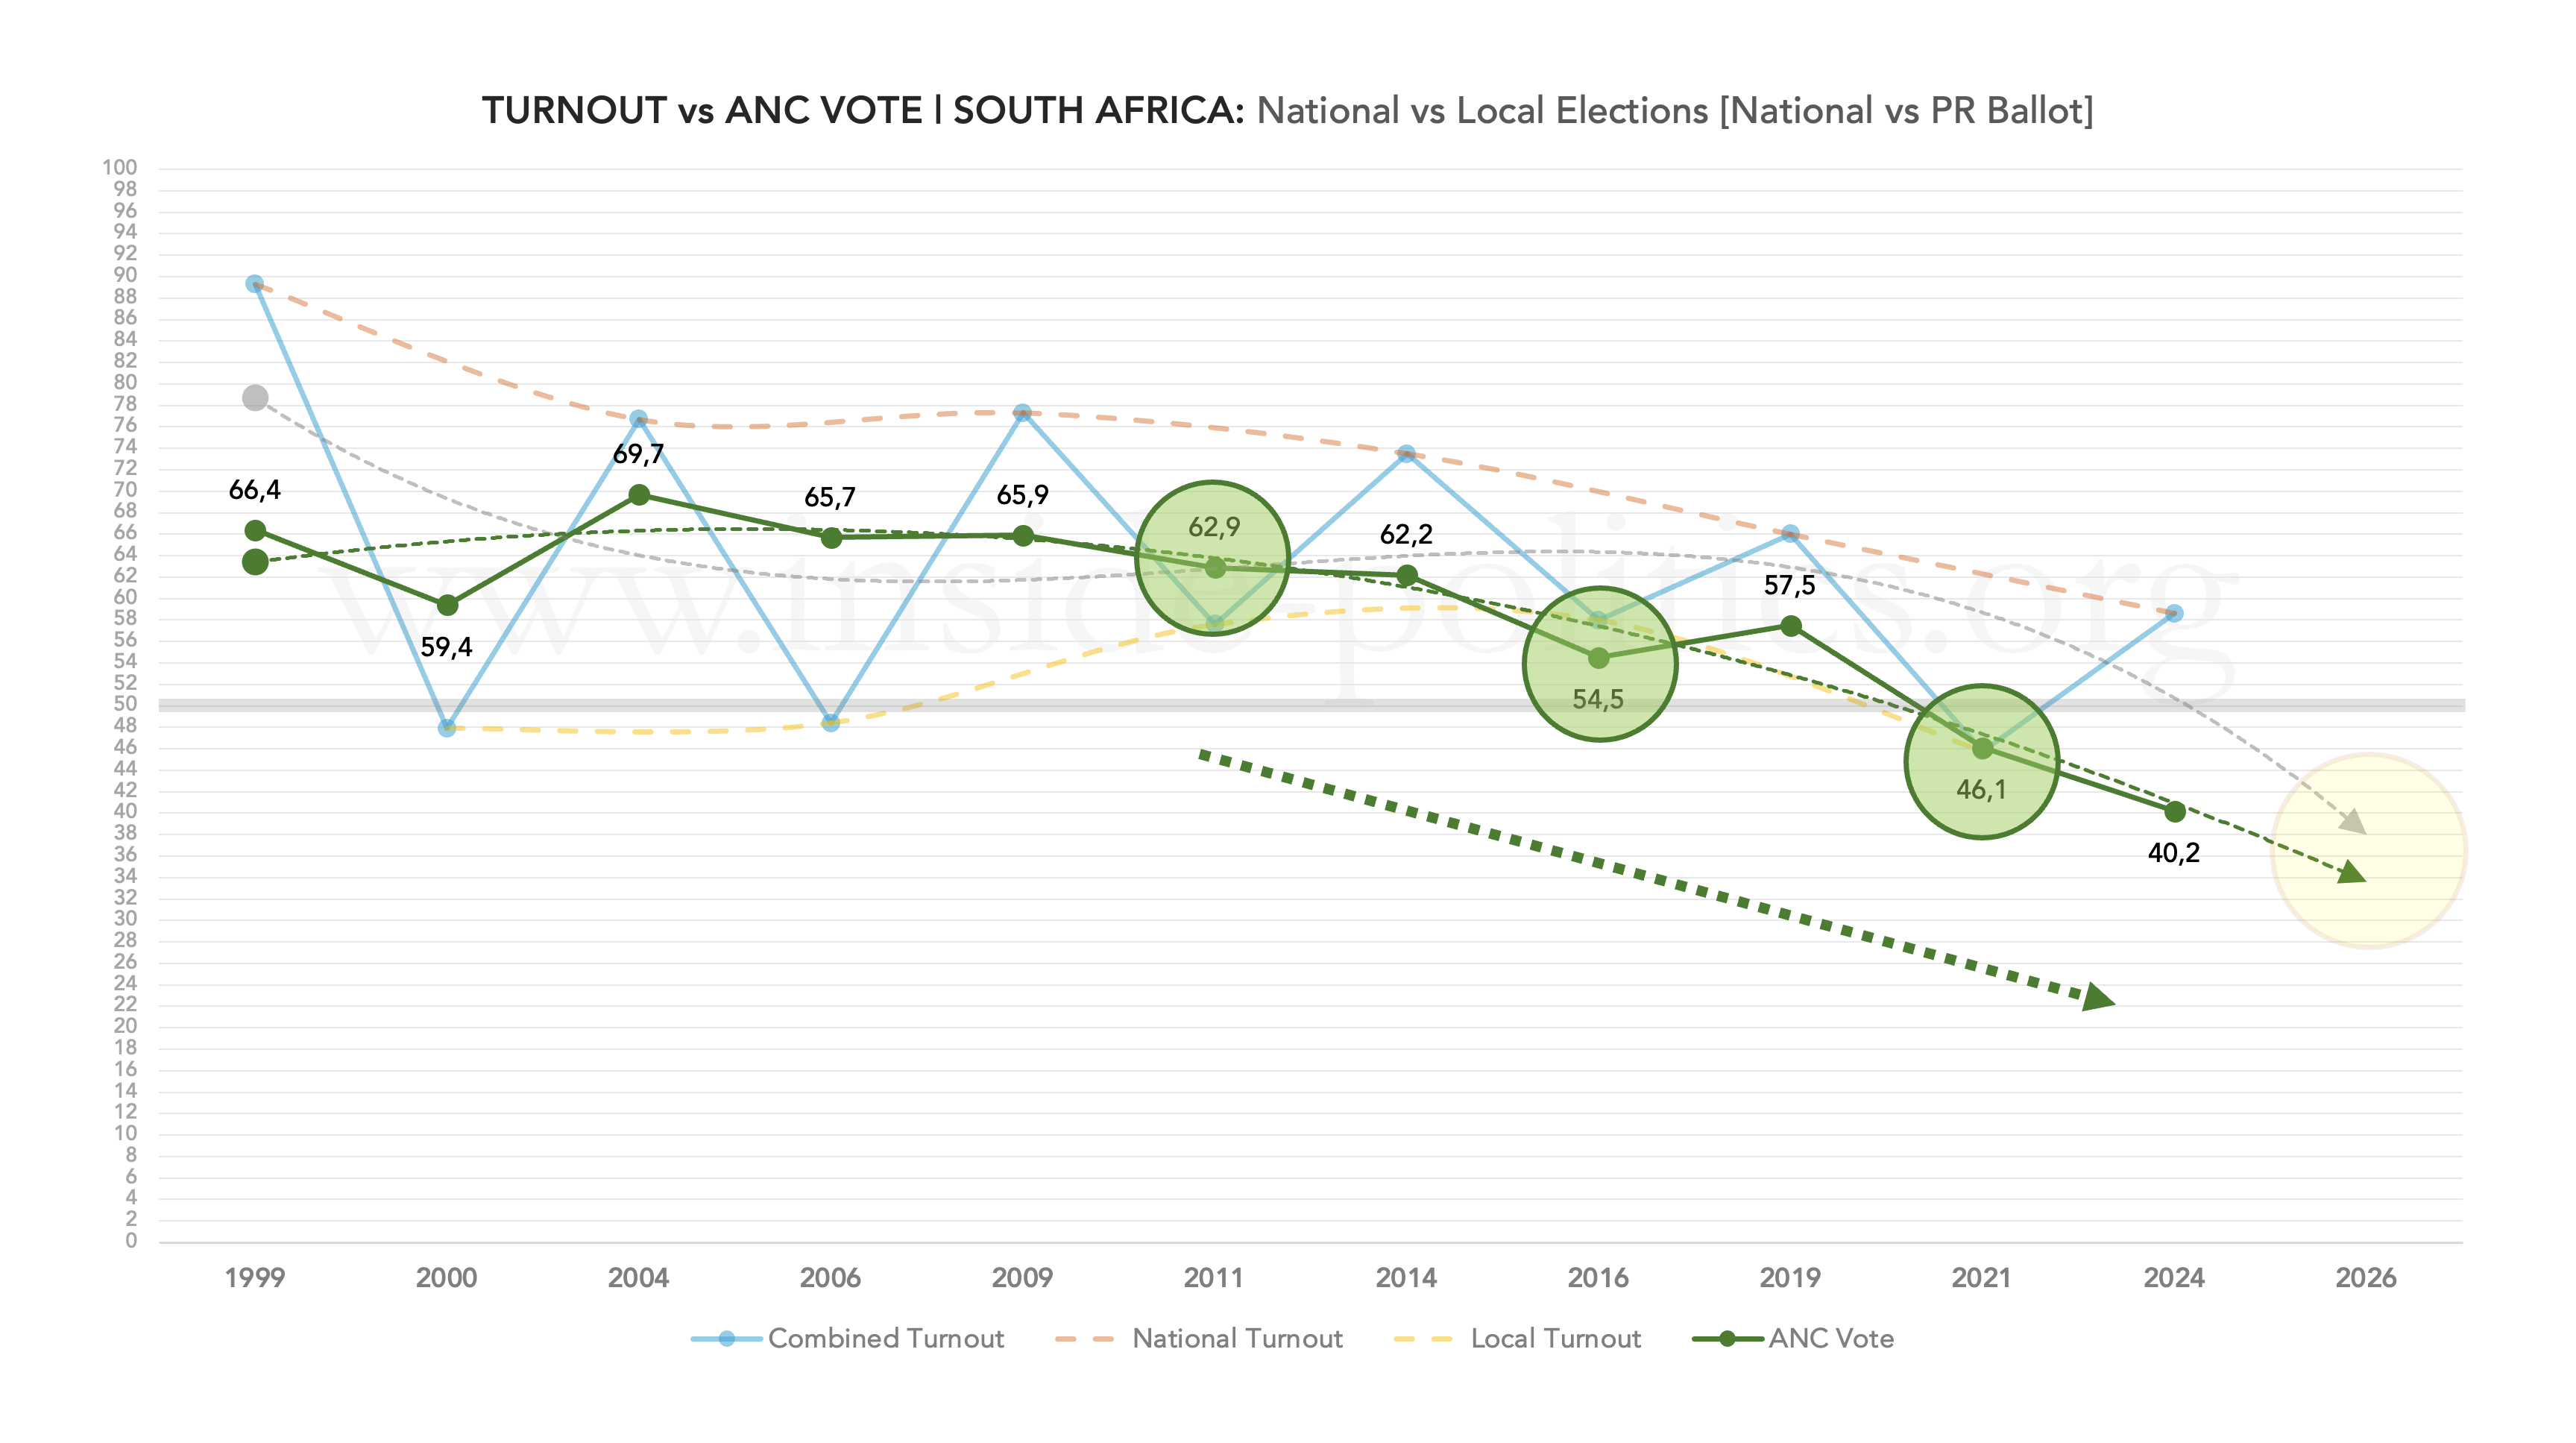
As with turnout, although to a less exaggerated degree, the ANC vote rises and falls between local and national elections. The three green circles illustrate how its vote share has fallen in each local election, from the preceding national election:
- From 65.9% in the 2009 national elections, to 62.9% in the 2011 local elections (-3pts);
- from 62.2% in 2014, to 54.5% in 2016 (-7.7pts);
- and, from 57.9% in 2019, to 46.1% in 2021 (-11.4pts).
So, not only does the ANC typically slump between national elections, but the size of that drop is growing (-3pts, -8pts, -11pts). Given it managed to scrape together just 40.2% in 2024, if even it did arrest this decline, and hold it at -11pts, it seems headed for below 30%.
The Democratic Alliance (DA), by contrast, mirrors the ANC: It does better in local government elections, and worse in national elections. That is because opposition voters in general, and DA voters in particular, are comparatively more enthusiastic about local elections, as the graph below illustrates.

In blunt terms: DA voters generally turnout in local elections, ANC voters generally do not. Thus, on Election Day, opposition voters make up a larger share of the valid vote – as a result, the DA vote inflates, and the ANC vote deflates, compared to national elections.
However, the DA has a problem. Let’s look at its last few local election “bumps”, and the blue circles in particular:
- In 2011, it got 24.1% (+7.4pts from 2009, when it got 16.7%);
- in 2016, it got 27.0% (+4.8pts from 2014, when it got 22.2%);
- and, in 2021, it got 21.7% (+0.9pts from 2019, when it got 20.8%).
So, while the size of the ANC’s local election slump is increasing, the size of the DA’s local election bump is decreasing (+7pts, +5pts, +1pt). In 2021 it managed just one percentage point and, if that trend continues into 2025/6, the DA’s ability to take advantage of differential turnout in local government elections might vanish altogether.
Let us map these ANC and DA differentials (below) and see what they tell us.

This graph requires some context. The long-term DA trendline suggests it is leveling out, but as it includes earlier performances, it downplays the more recent decline, and there will be pressure on the party to deliver a positive differential in 2025/6. As for the ANC, its decline is marked and steeper, and any recovery seems only a remote possibility. The truth is: it is the extent of ANC alienation that is keeping the DA in the game. Viewed on its own, the DA has its own, serious apathy problem.
If we put the ANC and DA electoral performances together on the same graph (below), we can see that the election where this pattern was most pronounced, and worked best to the DA’s advantage, was 2016. It is true, there have been elections where the gap between the two was smaller (2024 for example), but that was mostly due to an ANC decline, rather than any DA increase.
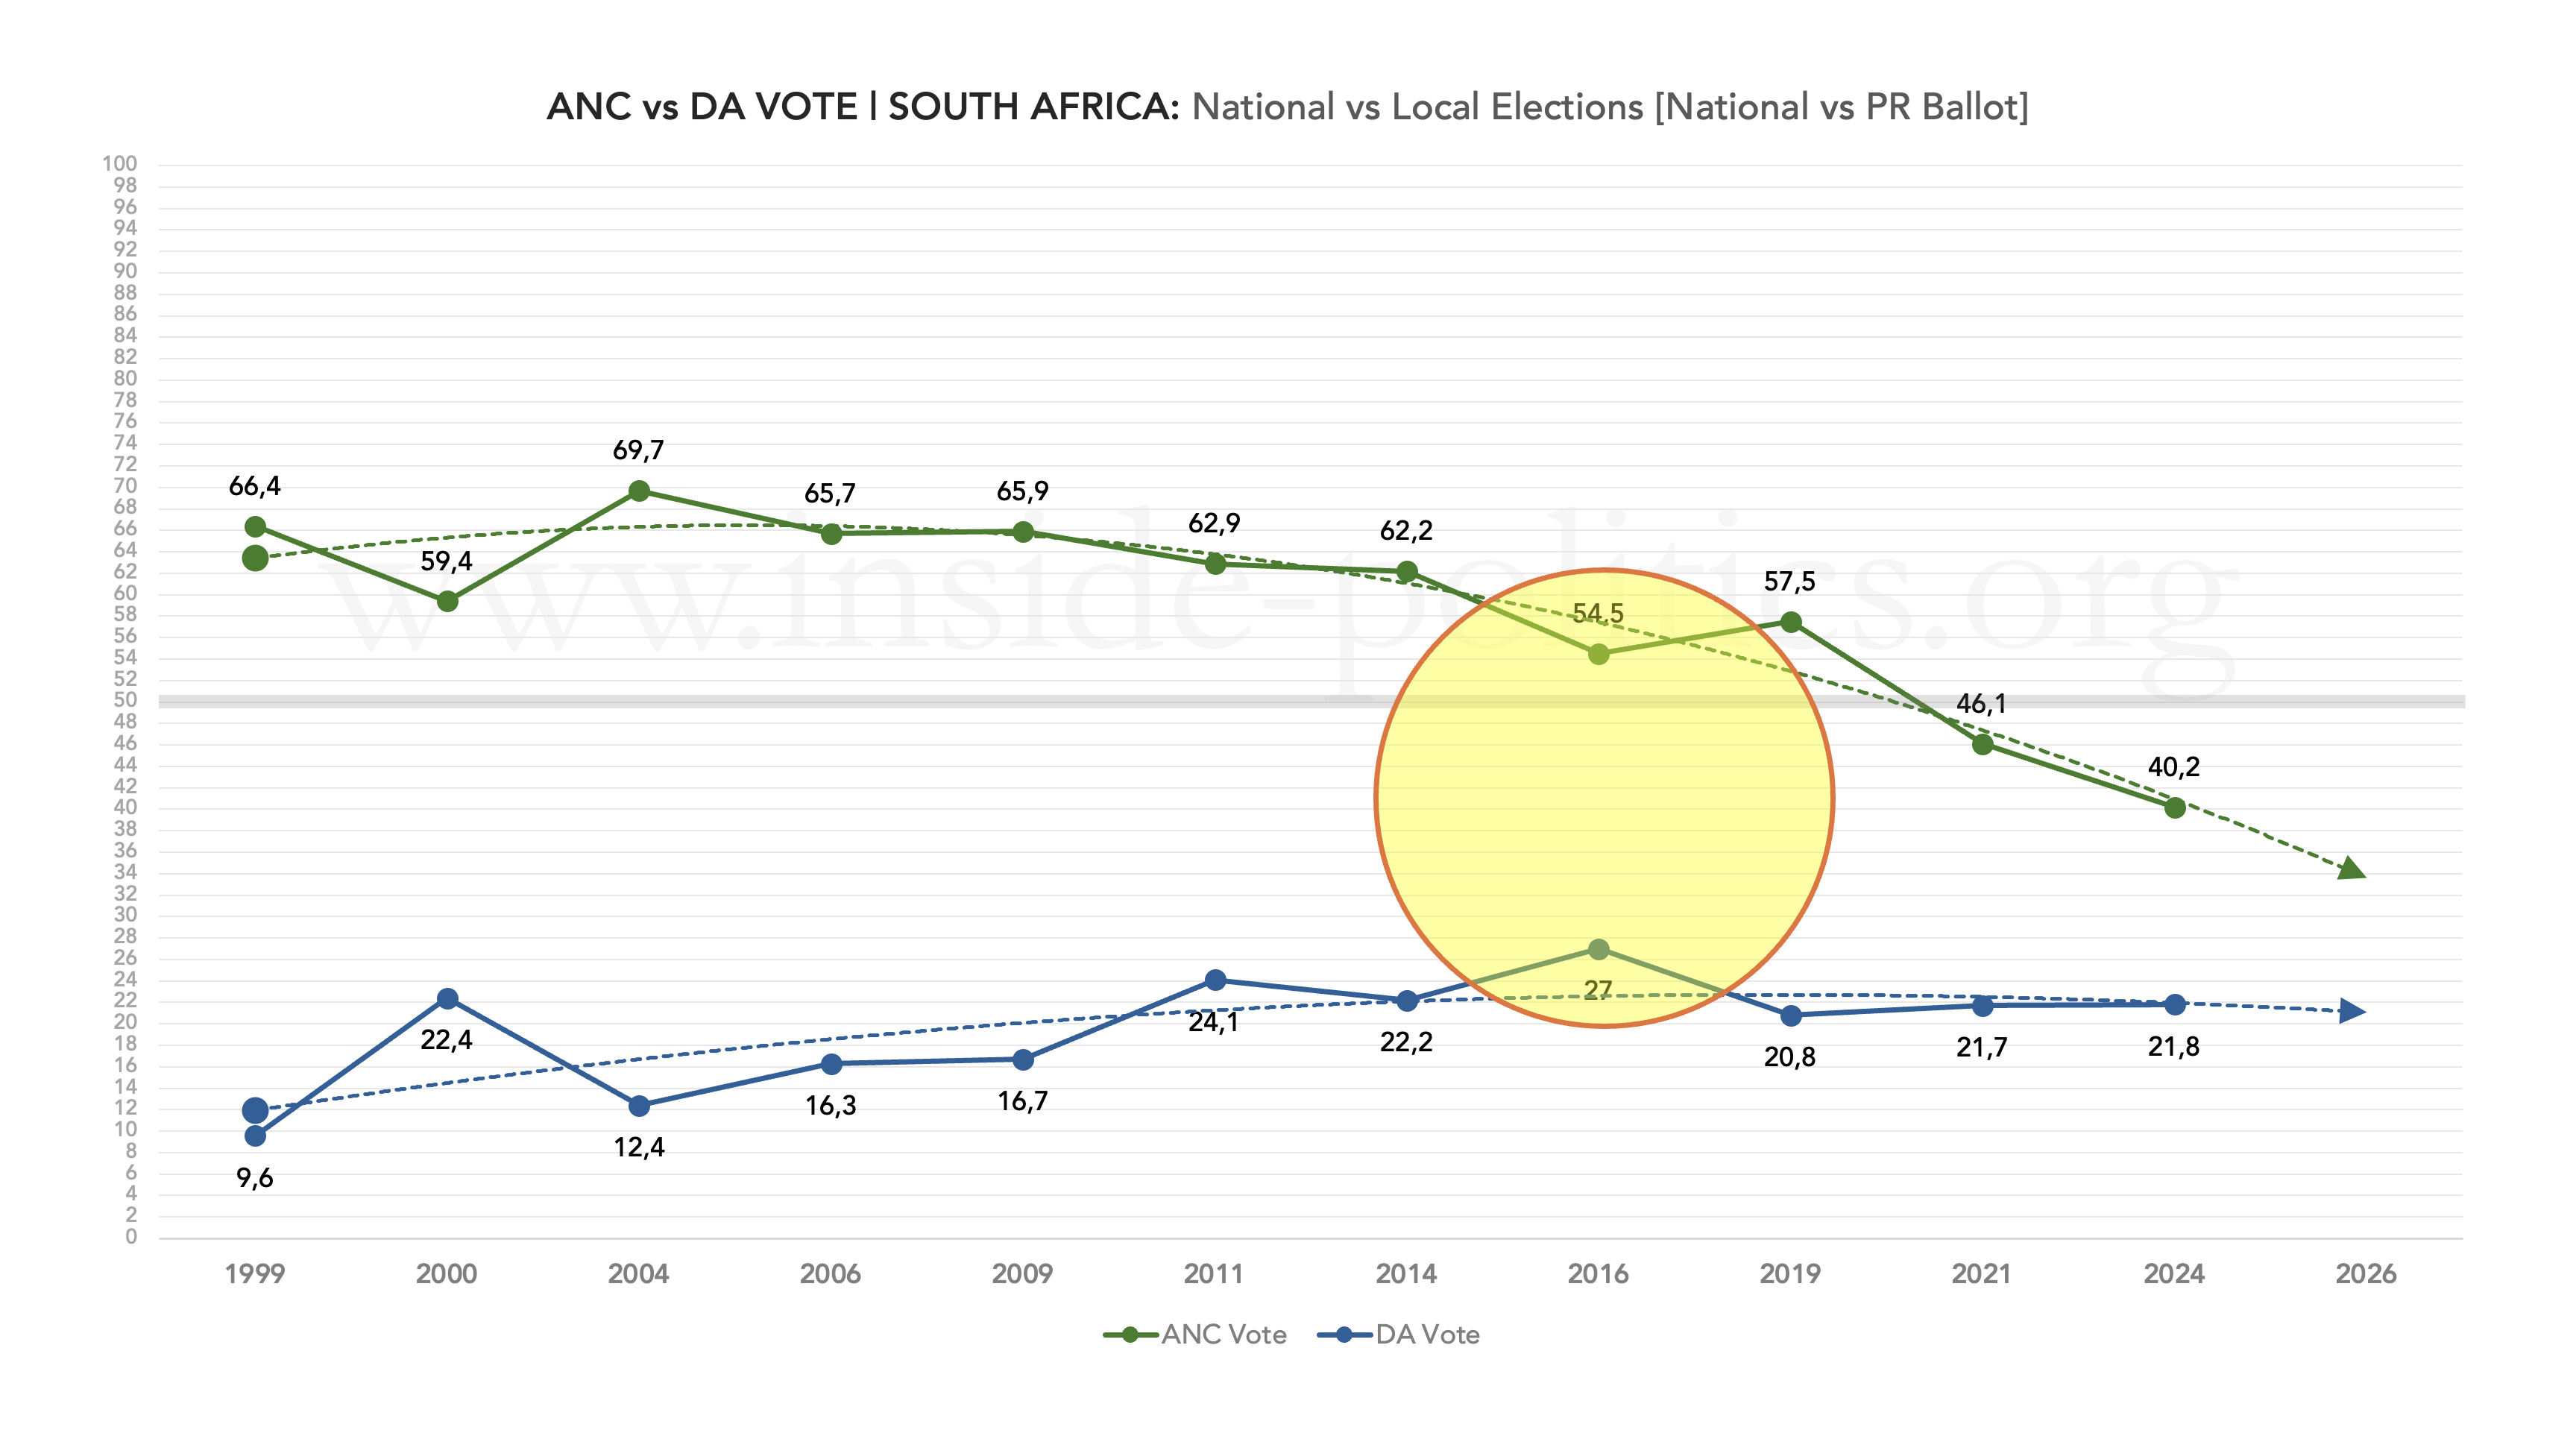
2016 really was a remarkable election for the DA. The party’s turn out then was unprecedented. As a result, it secured an astounding 74% of the Indian vote, 93% of the white vote, 75% of the coloured vote and 6% of the black vote (an all time high). And this pattern was at its peak, if not higher, in urban centers. The ANC fell below 50% for the first time in Johannesburg, losing that city along with Nelson Mandela Bay and Tshwane. In Ekurhuleni, it also fell below 50% for the first time.
The DA’s ability to recreate that 2016 enthusiasm among its voters in 2025/6 will be fundamental to its ability to take full advantage of the ANC’s implosion. And in Johannesburg, it will be a pre-eminent concern, because its problems there are even more acute.
Let us then turn to Johannesburg and see how these broader national trends played out in this urban environment.
Johannesburg
As we did with the national data, let us look at the same set of graphs with regard to Johannesburg in particular, starting with the turnout trends (below).
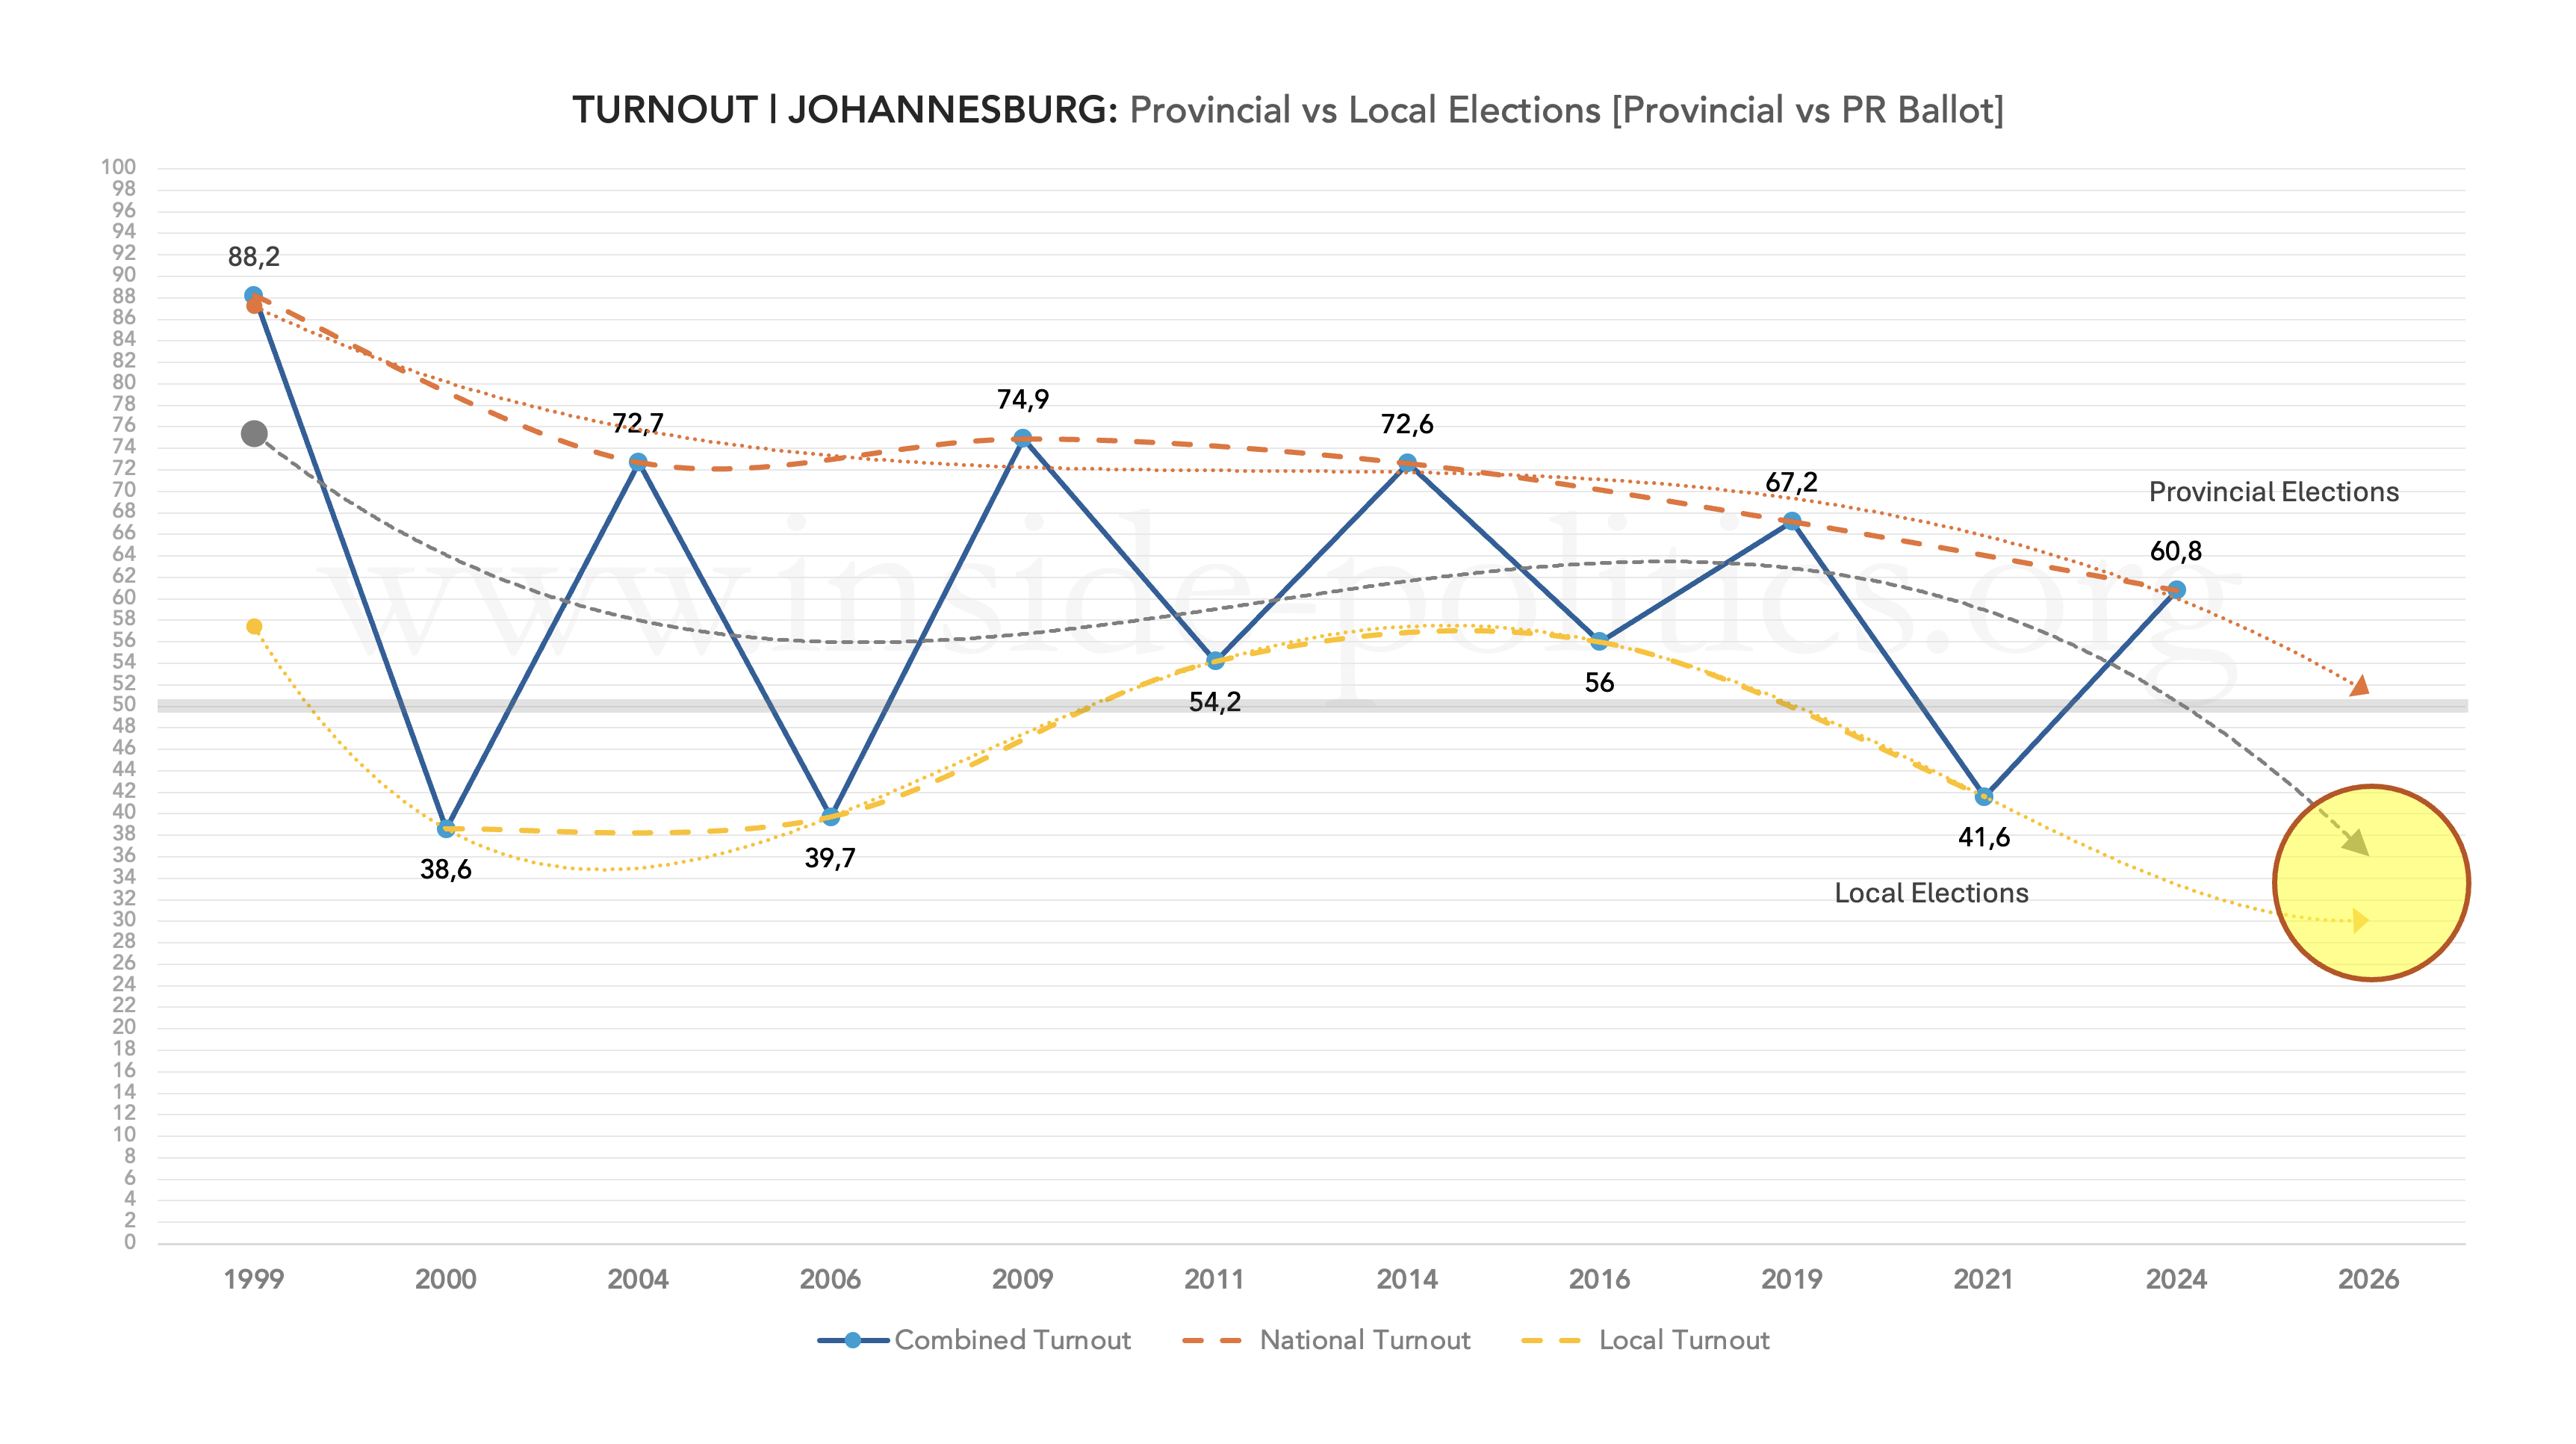
The general pattern is the same, but you will notice the teeth are a little more jagged, the lines a little steeper. Everything that happens at national level is exaggerated here. Most significantly, turnout in Johannesburg, in 2021, was some 4pts lower than it was at the corresponding national level (41.6% vs 45.8%). Thus, the ANC’s performance (below) was worse.

The ANC’s decline in Johannesburg has been catastrophic. From the dizzying heights of 68.6% in 2004, it has systematically lost support, falling below 50% for the first time in 2016, and then, all the way down to 31.9|% in 2024. A decline of 36.7 percentage points. Put another way: The ANC has lost more support in Johannesburg than it currently has.
The last local government elections, in 2021, saw it garner 33.4% but given what we have learnt, it will be the 31.9% in 2024 that will really worry the party. The trendline suggests it is headed for somewhere in the 20% range.
And its local government slump is plain to see (highlighted by the green circles). The environment would seem perfect, then, for the DA to take full advantage of this in 2025/6. However, the trends suggest otherwise. Here is the DA’s performance in Johannesburg, mapped again turnout (below).
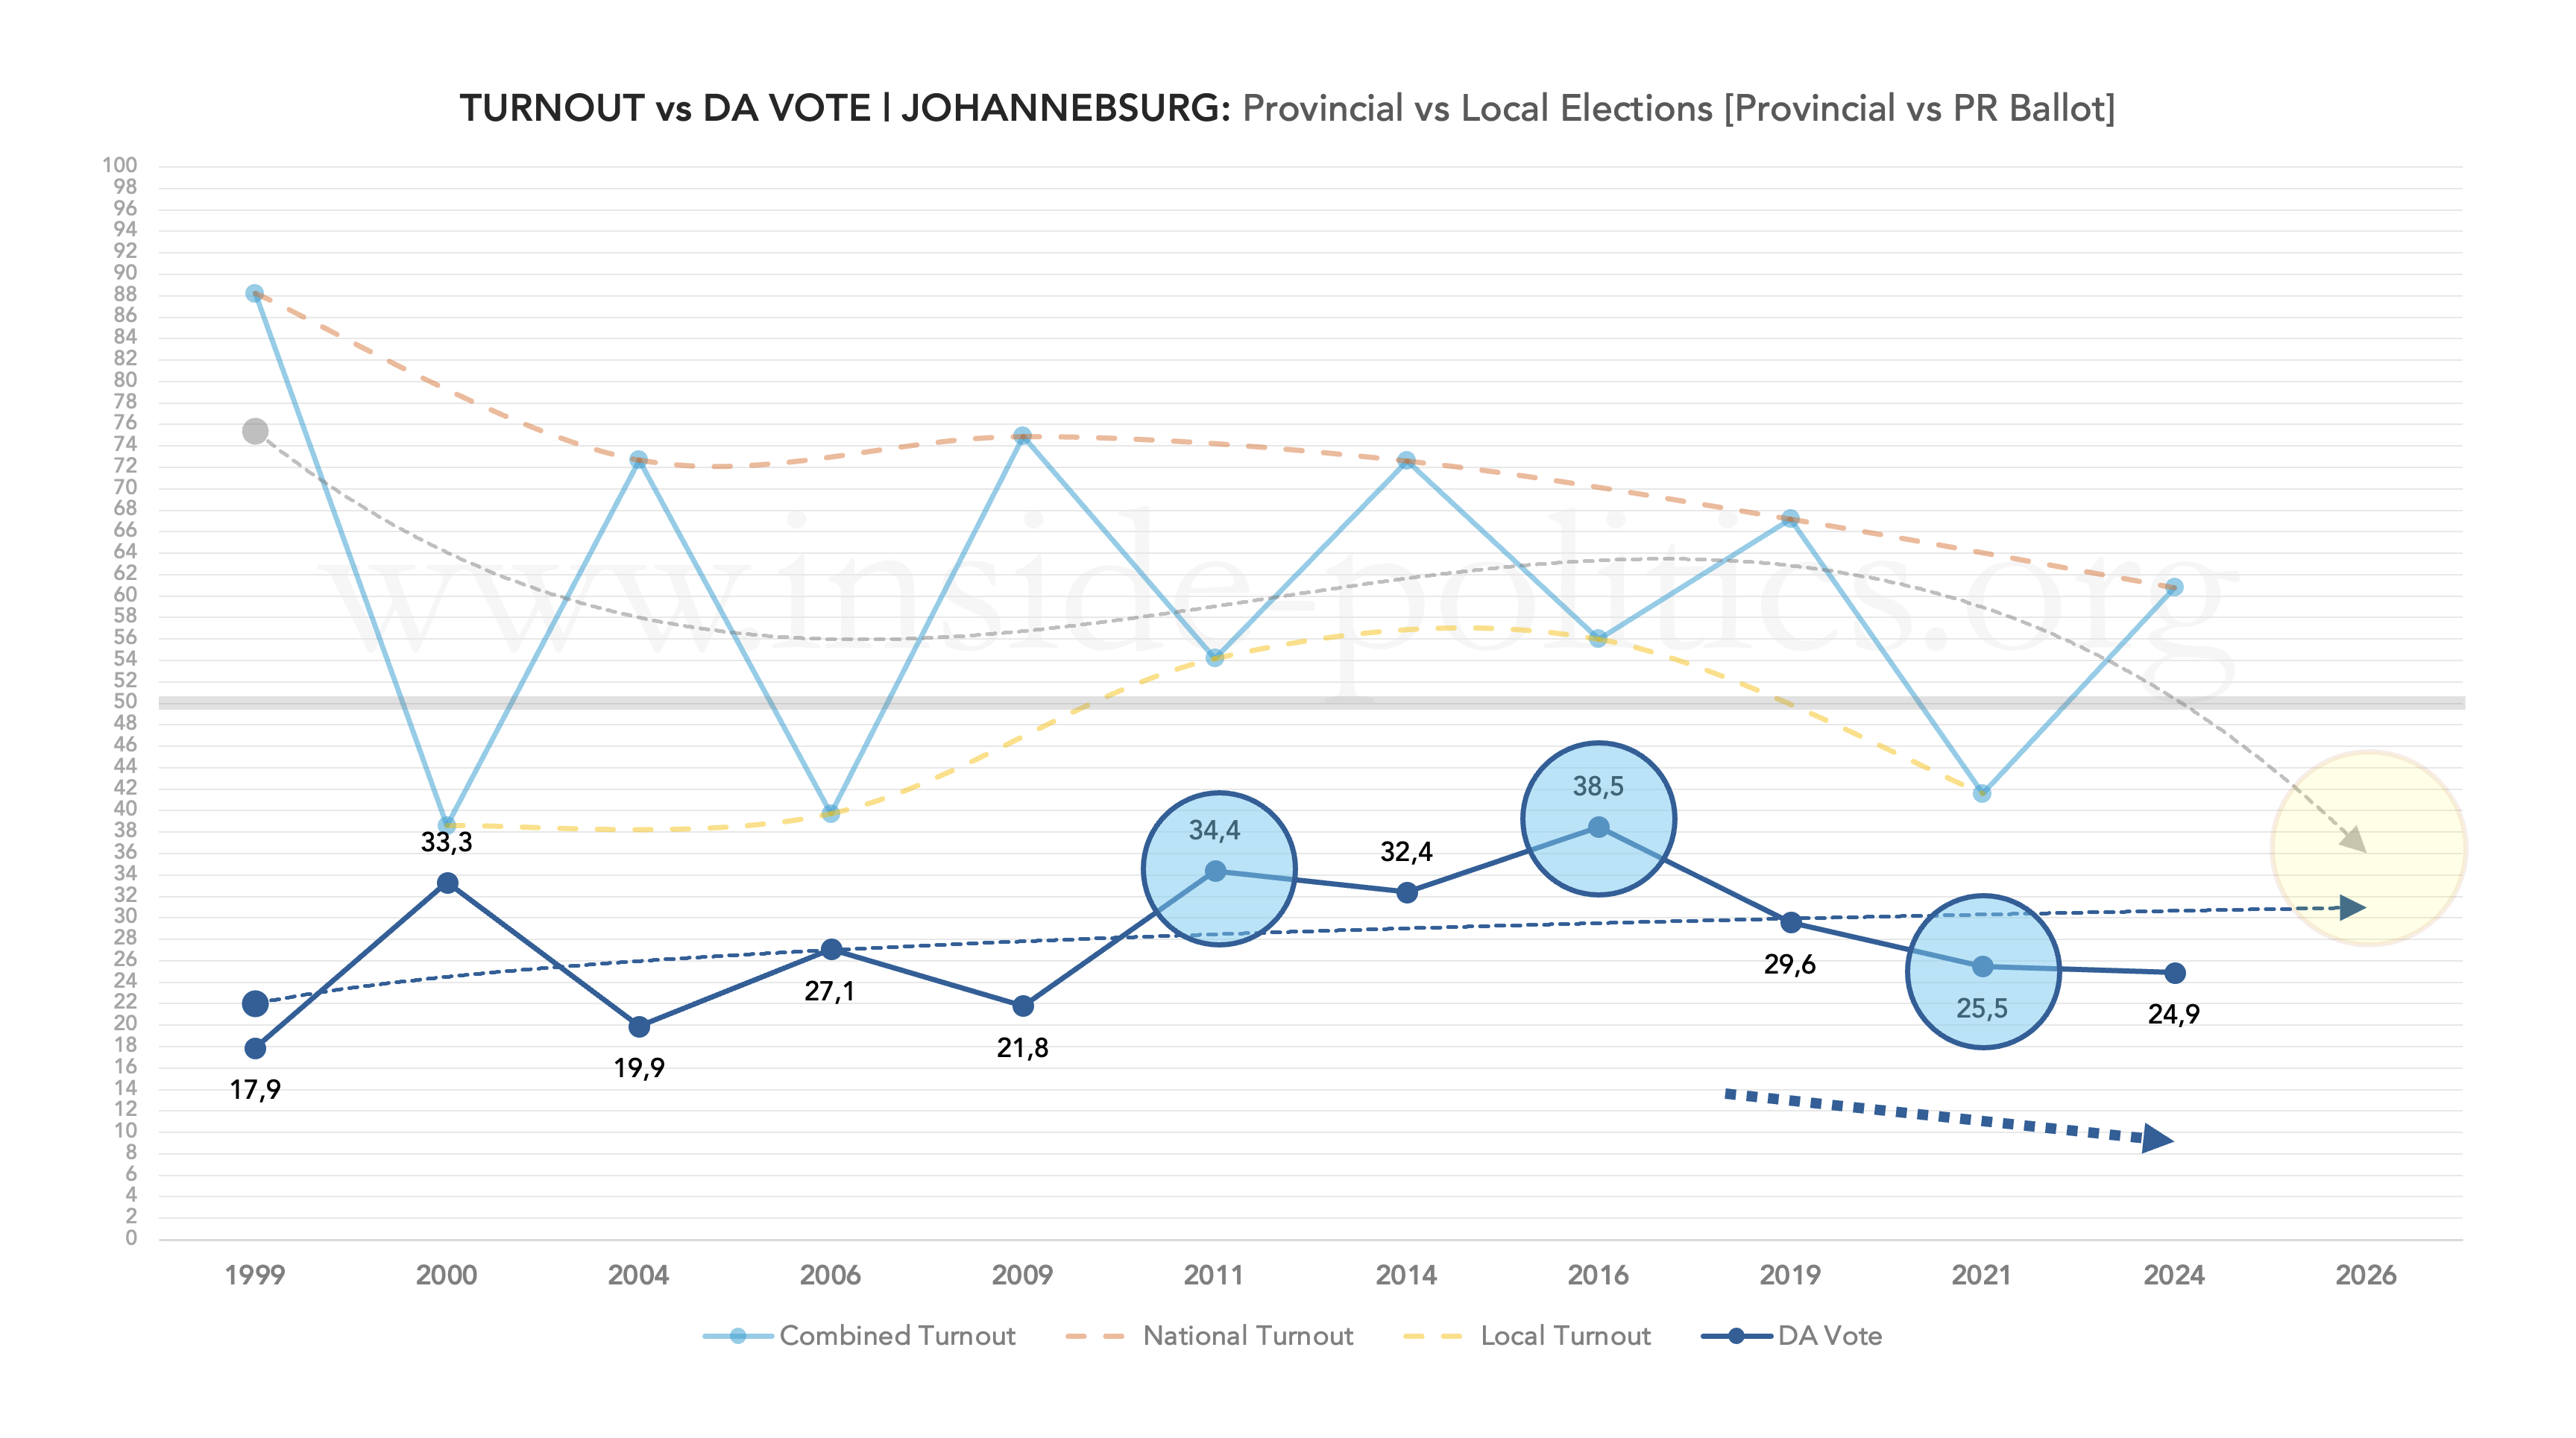
It experienced significant local election bumps in 2011 (34.4%) and 2016 (an all-time high of 38.5%) but that all came crashing to an end in 2021, when it fell a huge 13 points, down to 25.5%, and it lost even more in 2024, down to 24.9%. As a result of this, the DA vote share in Johannesburg seems to have lost its bump. In fact, it is worse than that, if we map those differentials, as we did nationally, you get the following graph (below).

There are a few highly significant data points on this graph. Let us start with the ANC – it is in meltdown. Its local election performances have declined from each preceding national election by -3pts, -7pts and -16pts in the last three cycles. Its decline in Johannesburg, in local elections, is exponential. It would seem headed for oblivion, and the gap between its last national performance and the upcoming local election seems set to be over 20pts, if the trendline holds.
As for the DA, this is a far more disturbing graph than its national equivalent (which you can see faded in the background). First, as per the blue circle, its differential went negative for the first time in 2021 (-4pts). Second, even its past performances here cannot arrest the trendline, which is headed down, and seriously so. It desperately needs to reverse that and bring its graph line back into the positive.
Plotting the ANC’s performance against the DA’s demonstrates how close the DA came to surpassing the ANC in 2016 (below).

Just 6.4 percentage points separated the two parties back then, as the DA surged and the ANC’s typical slump began to grow. That is the smallest the gap has ever been. In 2021, had the DA managed even a slightly significant bump, it would have overtaken the ANC. But it never came and, as with the situation nationally, it is only the ANC’s decline that is keeping the DA in the game. Either way, the two lines seems set to meet some time soon.
A ward-by-ward view of Johannesburg turnout
There are other ways to demonstrate turnout, which are insightful in a different way. To do this, we need to map the results in every ward in Johannesburg, for all five of the last local government elections (2000, 2006, 2011, 2016 and 2021). Let us start with the ANC.
The scatter graph below shows ANC turnout (the ANC’s PR vote divided by the total registered voting population) in every ward in Johannesburg, for 2000-2021 (every dot is a ward). The ANC’s turnout percentage runs up the Y axis, and the size of ward (in terms of registered voters) runs along the X axis. So, what you want as a political party, are dots up and towards the right-hand corner (big ward/high turnout).

The ANC would seem to do best in wards between 14,000 and 16,000, anything bigger than that, and its performance tends to drop off. It generally has a good spread. Significantly, there are almost no ANC wards that touch the bottom of the graph – suggesting small support in a great many wards. But let us be more specific and look only at its 2016 performance.

It’s not a great showing, when you consider overall turnout was 56%, and every single green dot falls below that. In 2016, the party was already in decline, and you can see it here. Even in its most dominant wards – where it got a healthy majority – it could not break the turnout threshold. Apathy had the party in its grip. And, for there, it would only strengthen its stranglehold on ANC voters. If we look at the same graph for 2021, with only the 2021 wards in yellow, you can instantly see how ANC turnout was further suppressed.
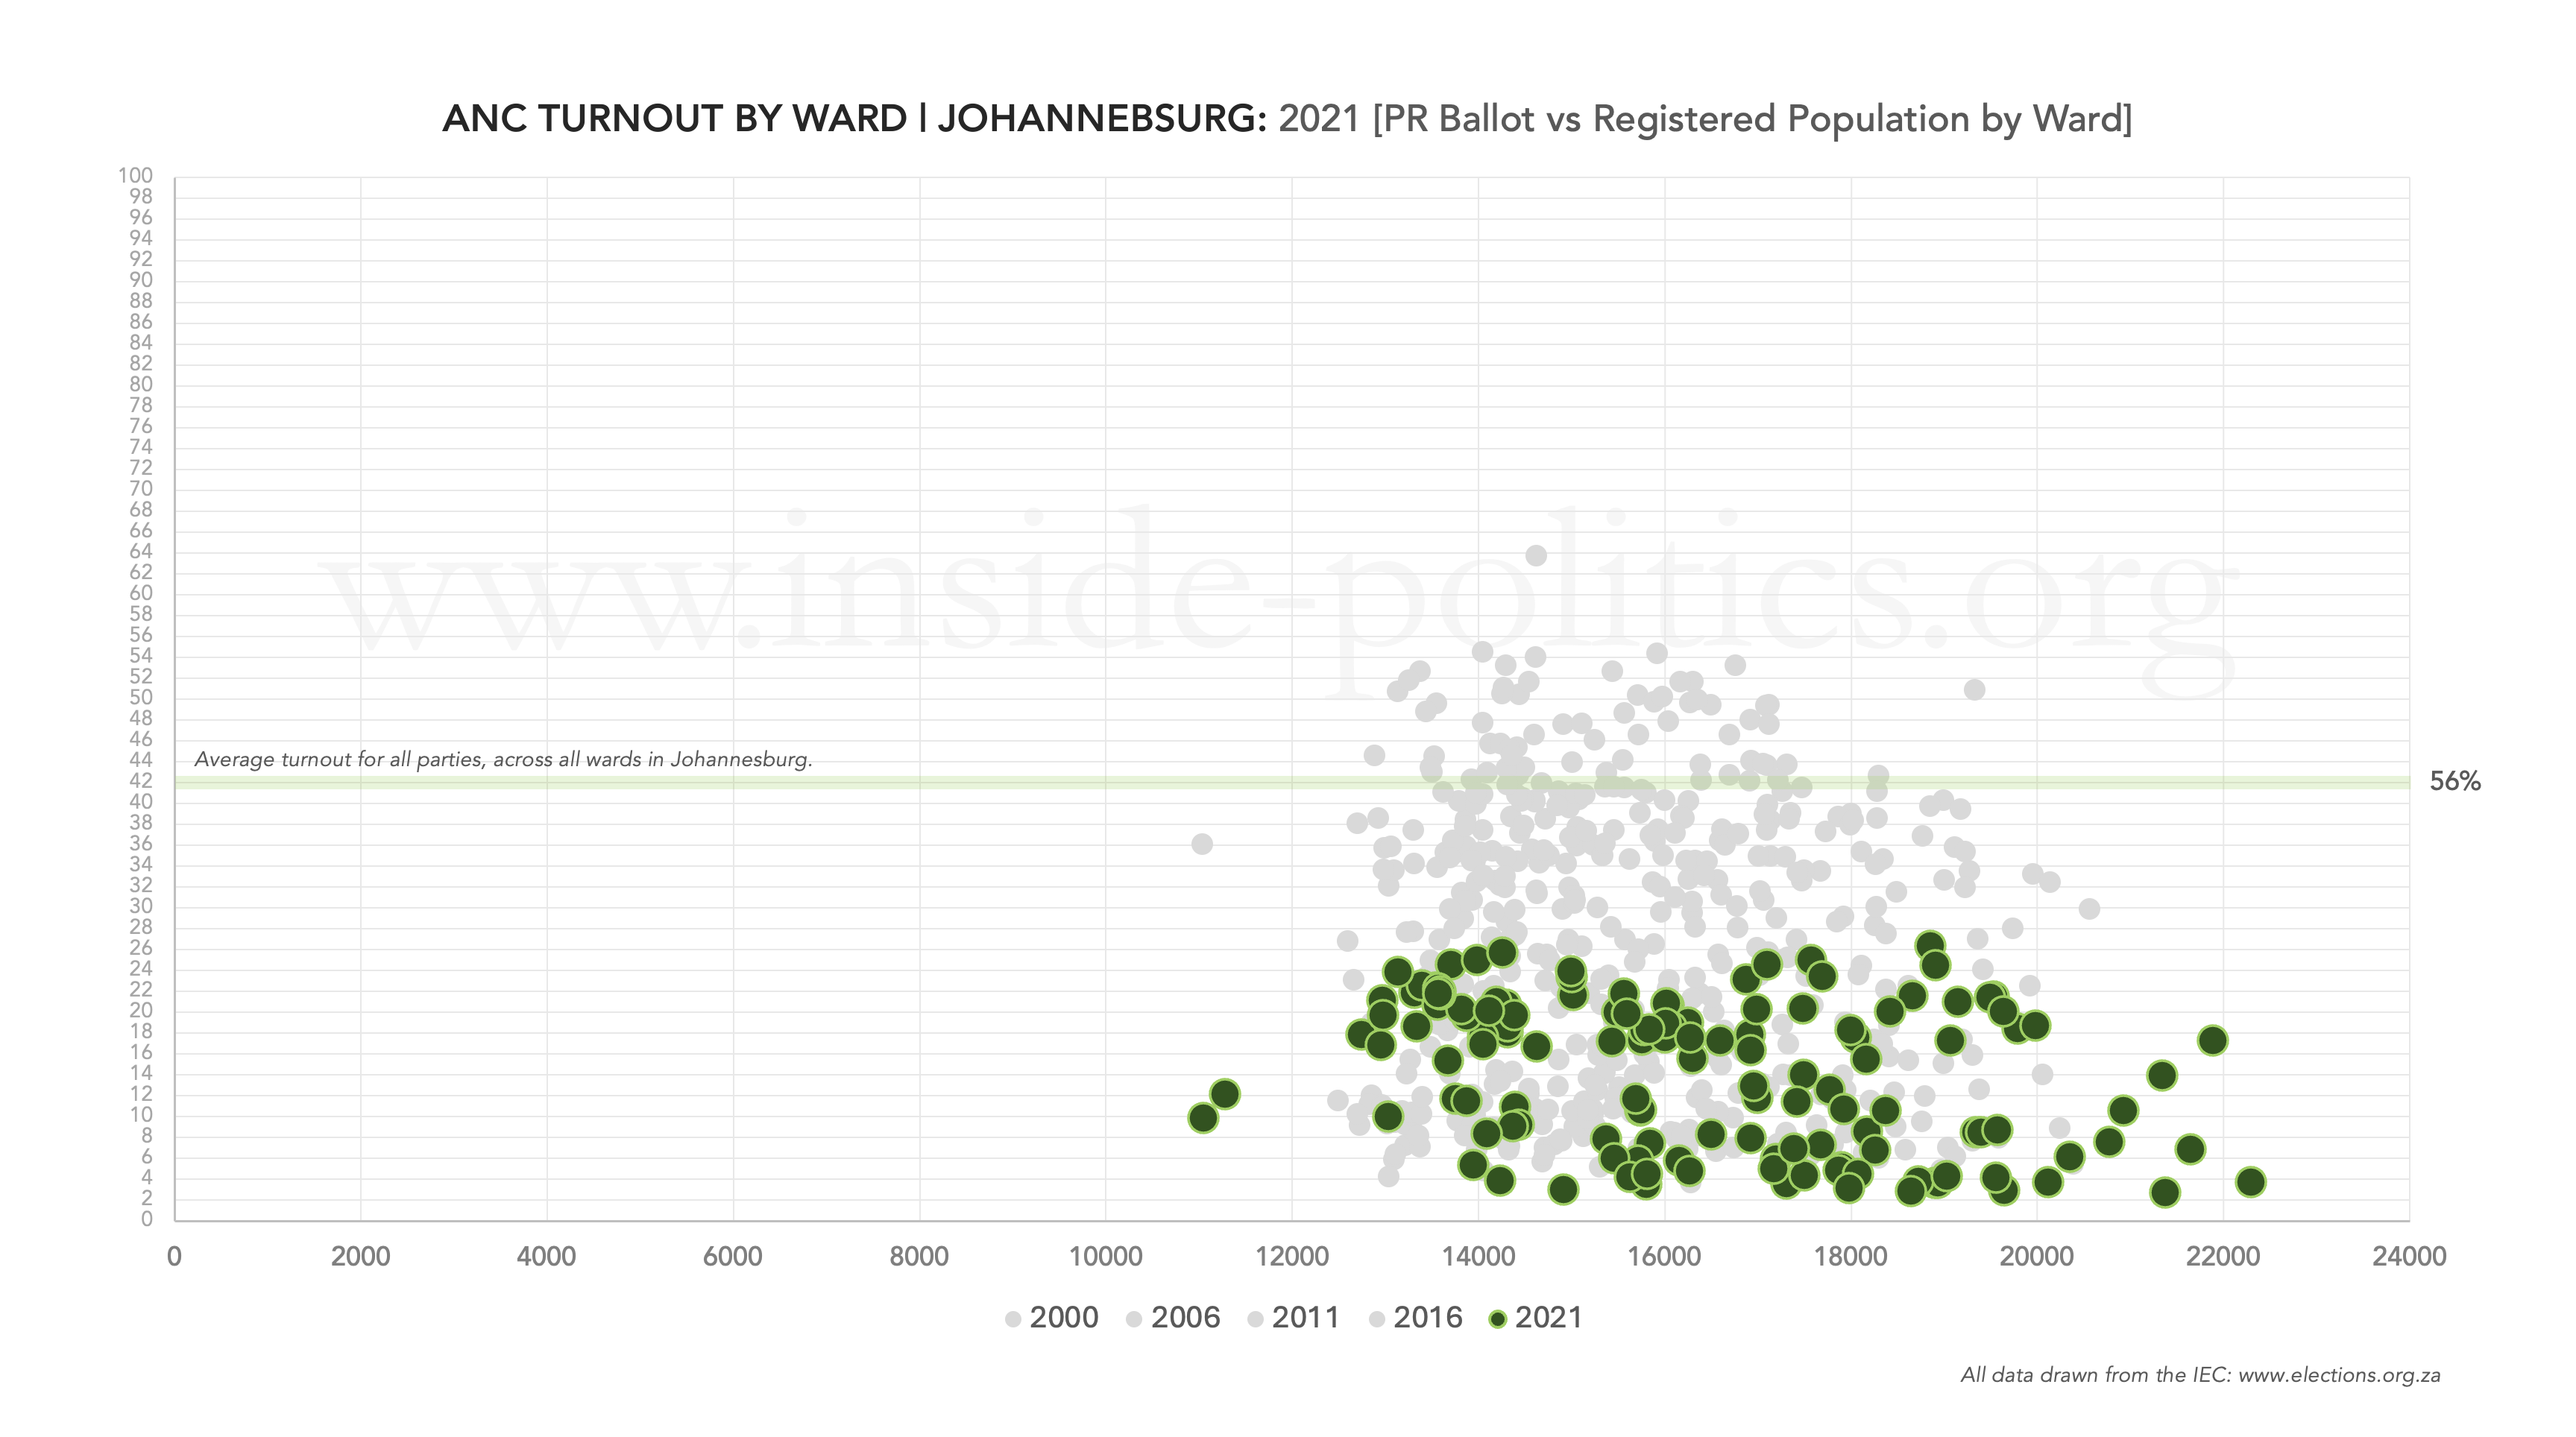
Just look at how all the green dots fall, to the extent that there is a noticeable gap now between the highest green dots and the 42% turnout line. Apathy is systematically squeezing the party’s performance into an ever-narrowing band.
Let’s see how the DA’s turnout looks through the same lens. As with the ANC, this graph (below) plots the DA’s ward-by-ward turnout in every local government election in Johannesburg, since 2000.

A couple of data points are worth noting. 1. The DA has a cluster of big wards towards the top right. 2. However, it also has a thick band of dots clumped together along the bottom. Thus, the DA generally excels in several big wards but, the party gets next to nothing in a wide range of, often smaller, wards. Again, let us get more specific and look at the DA’s performance in 2016 (yellow dots in the graph below).

This is what an excellent election looks like. Almost all those big wards delivered high DA turnout in 2016, above or just below the 2016 turnout line of 56% (and remember, this is DA votes divided by all registered votes, not just votes cast, to beat the turnout line is remarkable – it means DA voters alone turned out in numbers so large, they outstripped the average on their own). Notice too how the clump of DA wards at the bottom of the graph rise from 0% to between 2% and 4%. So, the DA’s improvement was across the board, it managed, like the ANC, to get a small amount of support in a great many wards.
Now, let us look at 2021 (below), and the DA’s problem is well illustrated.

Everything the DA managed in 2016 is reversed. Its cluster of larger wards, with high turnout, drop well below the turnout line and the clump of wards at the bottom, generally drop back to 0%, as they all sit clustered on the base. It is almost as if the DA is one election behind the ANC. And, if it does not reverse this trend, just as the ANC’s 2016 graph was further squeezed in 2021, so the DA’s graph will likely follow the same pattern in 2021.
Conclusion
As stated at the outset, this analysis looks only at turnout. It would be ignorant, however, to suggest this is the only force at play on the ANC and DA. Of these other factors, new political parties (ASA in 2021, and MK in 2024) need to be considered. But these will be subject for another essay.
Nevertheless, both parties share the same challenge when to comes to enthusing the electorate in general and their base voters in particular.
The ANC seems more or less resigned to its decline. It has offered no fundamental change and thus, no prospect of reversing its decline. As Johannesburg devolves into dust, so does the ANC’s vote share.
The DA has posited Helen Zille as its mayoral candidate for Johannesburg. Zille might well bring some enthusiasm, particularly with regard to the DA base, but you get the sense it will battle even then to deliver the sense of hope and possibility it did in 2016, which is what it really needs. So at least the DA, unlike the ANC, has some prospect of reversing its trend, to whatever degree.
Perhaps that is all the party needs to emerge as a majority in Johannesburg, even at a relatively low level. Its greatest ally in that pursuit, however, is the ANC. As in the past, it will rely primarily on the ANC’s exponential decline more than it will its own impact, to ensure some comparative success in the public eye. But that is the contemporary DA story: a party of limited ambition, that lives off small gains, and big ANC losses.
This essay is the 1st in an on-going series on Election 2025/6, for all other editions of this series, please click here: Election 2026/7
Discover more from inside politics
Subscribe to get the latest posts sent to your email.

http://www.directdemocracy.org.za