
Election 2024 [6]: How did the EFF do so well in 2019?
by The Editor

A thread: “How did the EFF do so well in 2019?” This thread looks at the EFF, and its performance in the 2019 national and provincial elections – how it grew, where it grew and what factors drove its growth.
How did the EFF do so well in 2019?
By: Gareth van Onselen
Follow @GvanOnselen
18 January 2024
This essay is the 6th in an on-going series on Election 2024, for all other editions of this series, please click here: Election 2024
The EFF first stood in an election in 2014. Thus, we only have two sets of national election data on the party; four if we include local elections – which are only helpful up to a point, so far as 2024 goes. It is hard, then, to be definitive about long term EFF electoral trends and patterns. But let’s see what we can deduce from what we have.
The big picture: The graph below shows the EFF’s national performance, in each national and local election since 2014. It includes the ANC, DA and IFP for perspective.
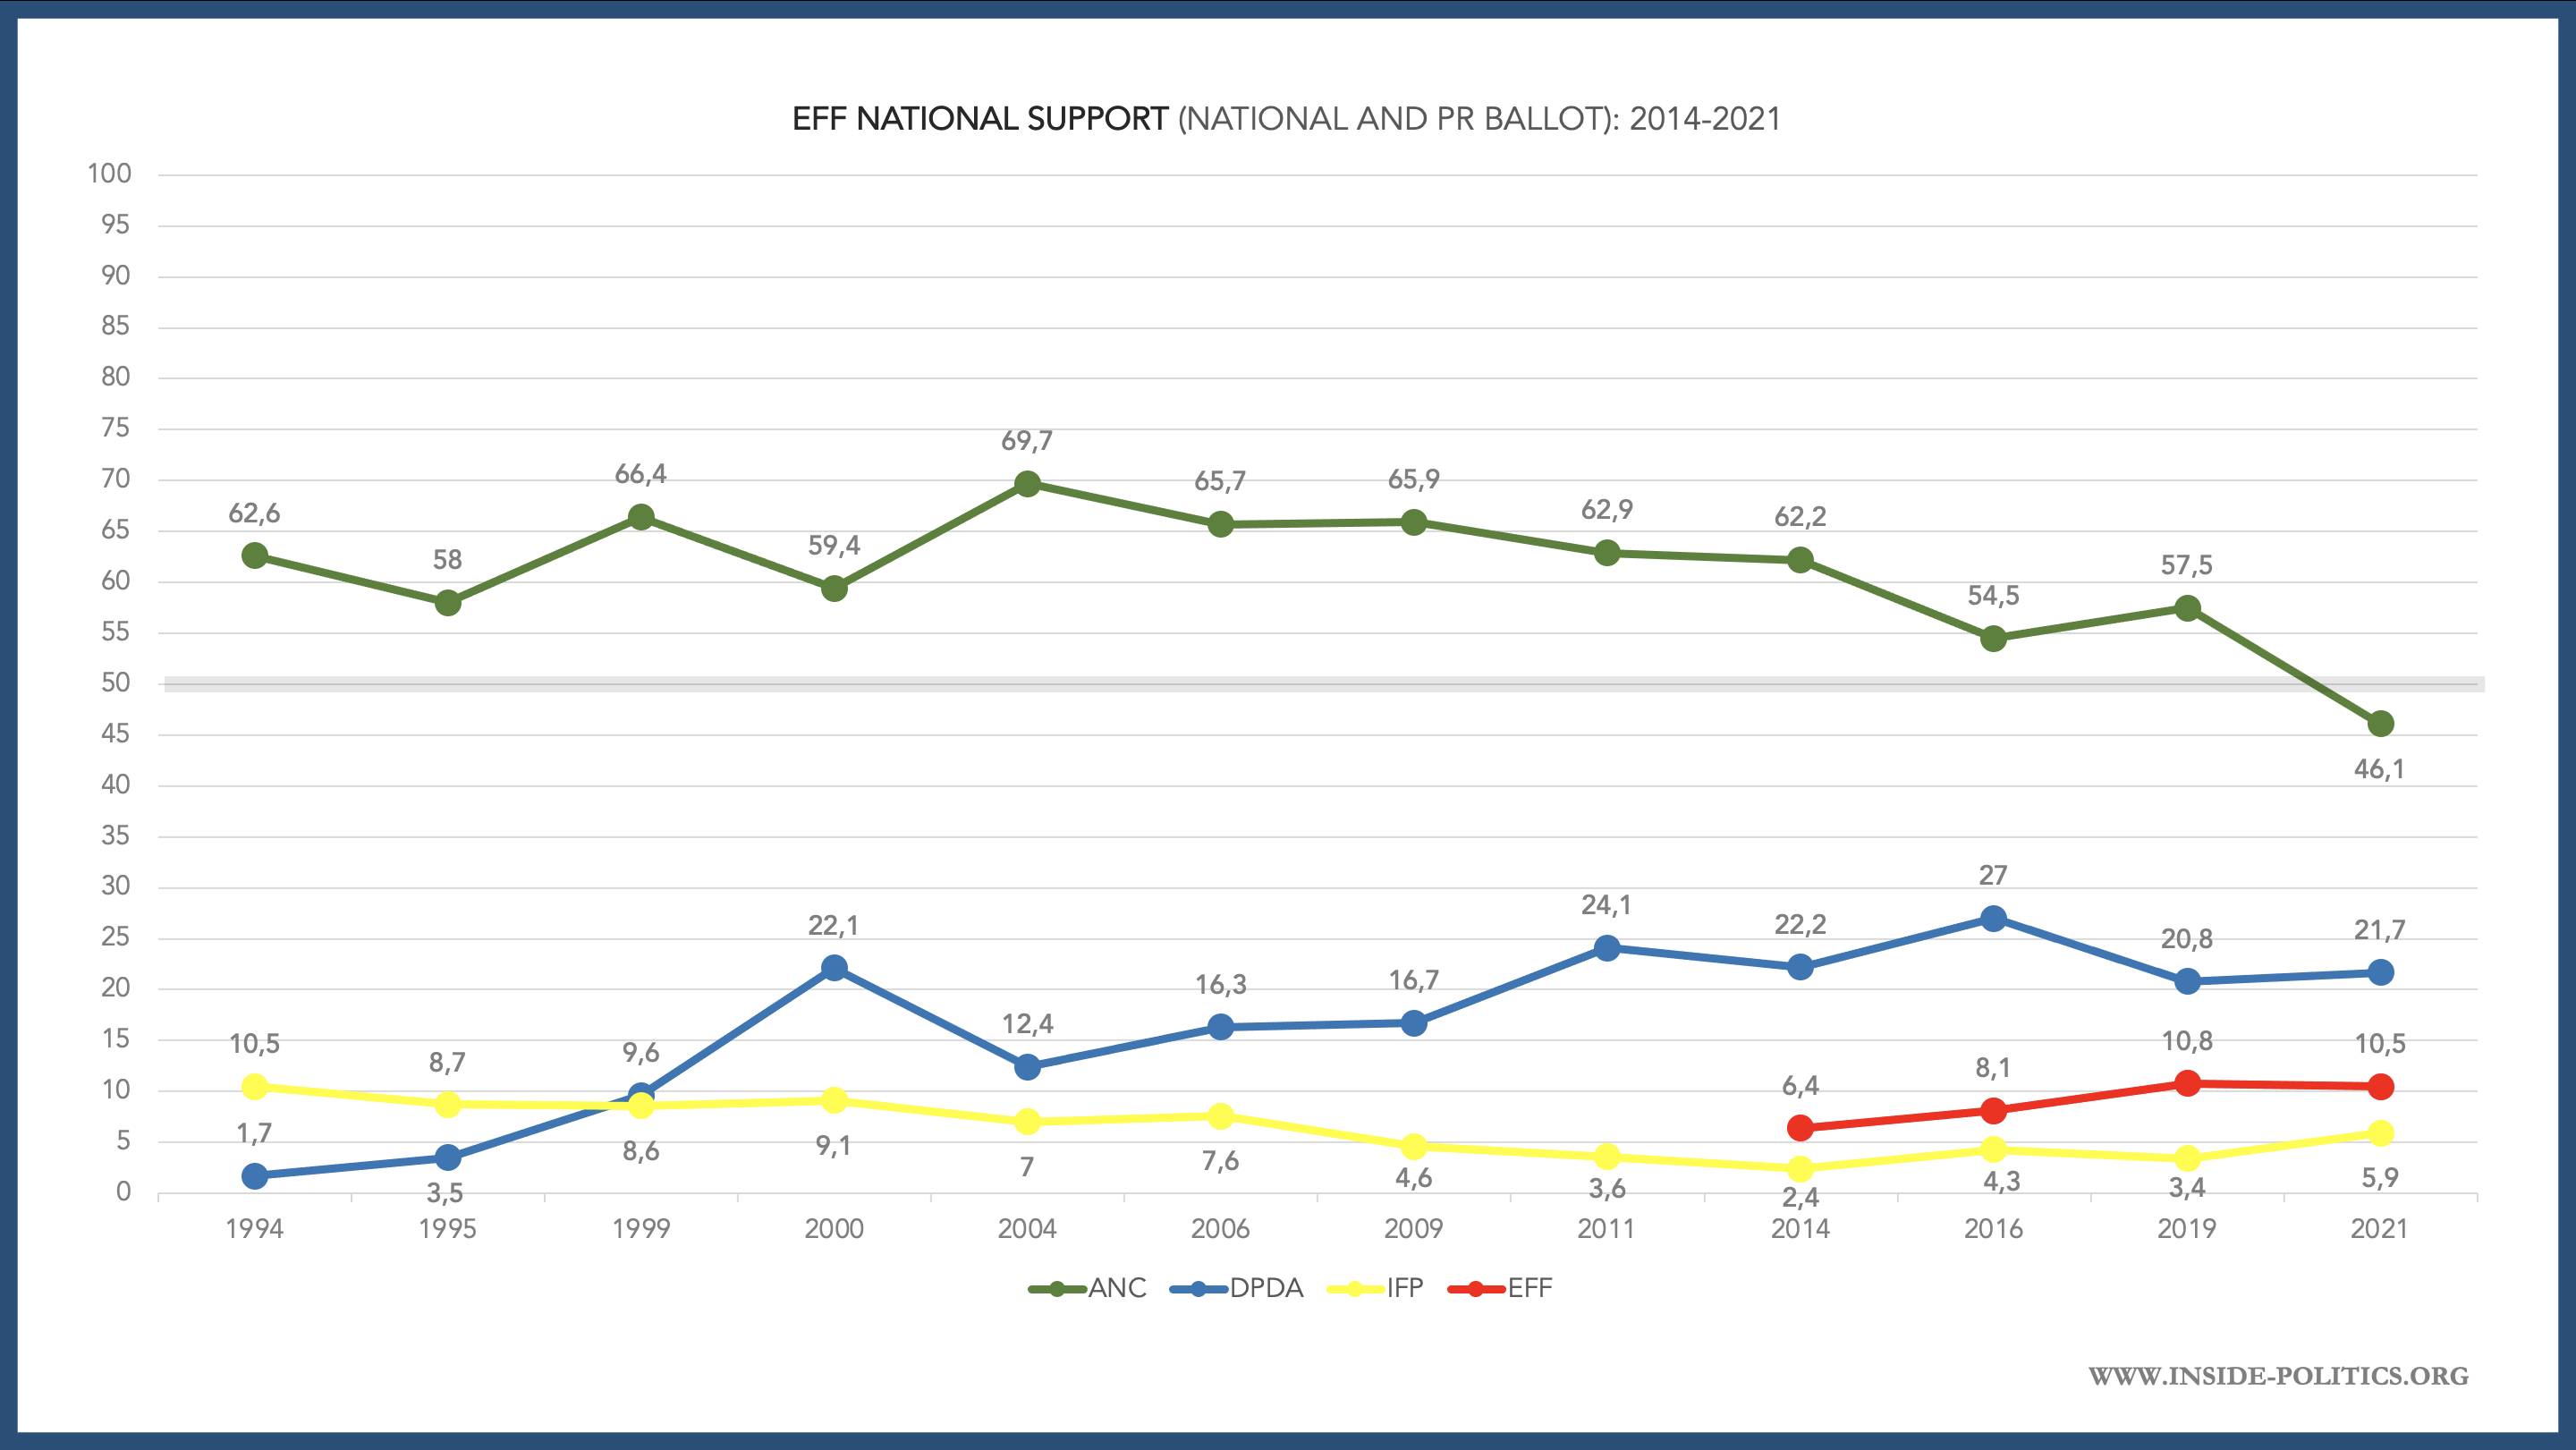
Essentially, the EFF grew between national elections (from 6.4% in 2014 to 10.5% in 2019) and grew, although to a lesser extent, between local government elections (from 8.1% in 2016 to 10.6% in 2021).
Its 2021 performance is something of an anomaly for an opposition party – typically, they capitalise on relatively low ANC turnout in local government elections and substantially outperform their previous national showing. However, in 2021, the EFF went backwards from 2019.
The graph bellow shows the national performance (national and PR ballot) of the EFF for each national and local government election since 2014, by province, ranked from the EFF’s best performance in 2021, to its worst.

A few points of interest: SA’s three northern rural provinces – the North West, Limpopo and Mpumalanga – are where it performed best in percentage terms. In turn, Gauteng and KwaZulu-Natal – SA’s most populous, more urban provinces – are in the middle and towards the end.
If we look at only national elections, and the provincial ballot, as per below, things don’t change too much. Gauteng moves up to position two, suggesting some EFF vote splitting in that province, but the three rural provinces continue to dominate the top four positions.
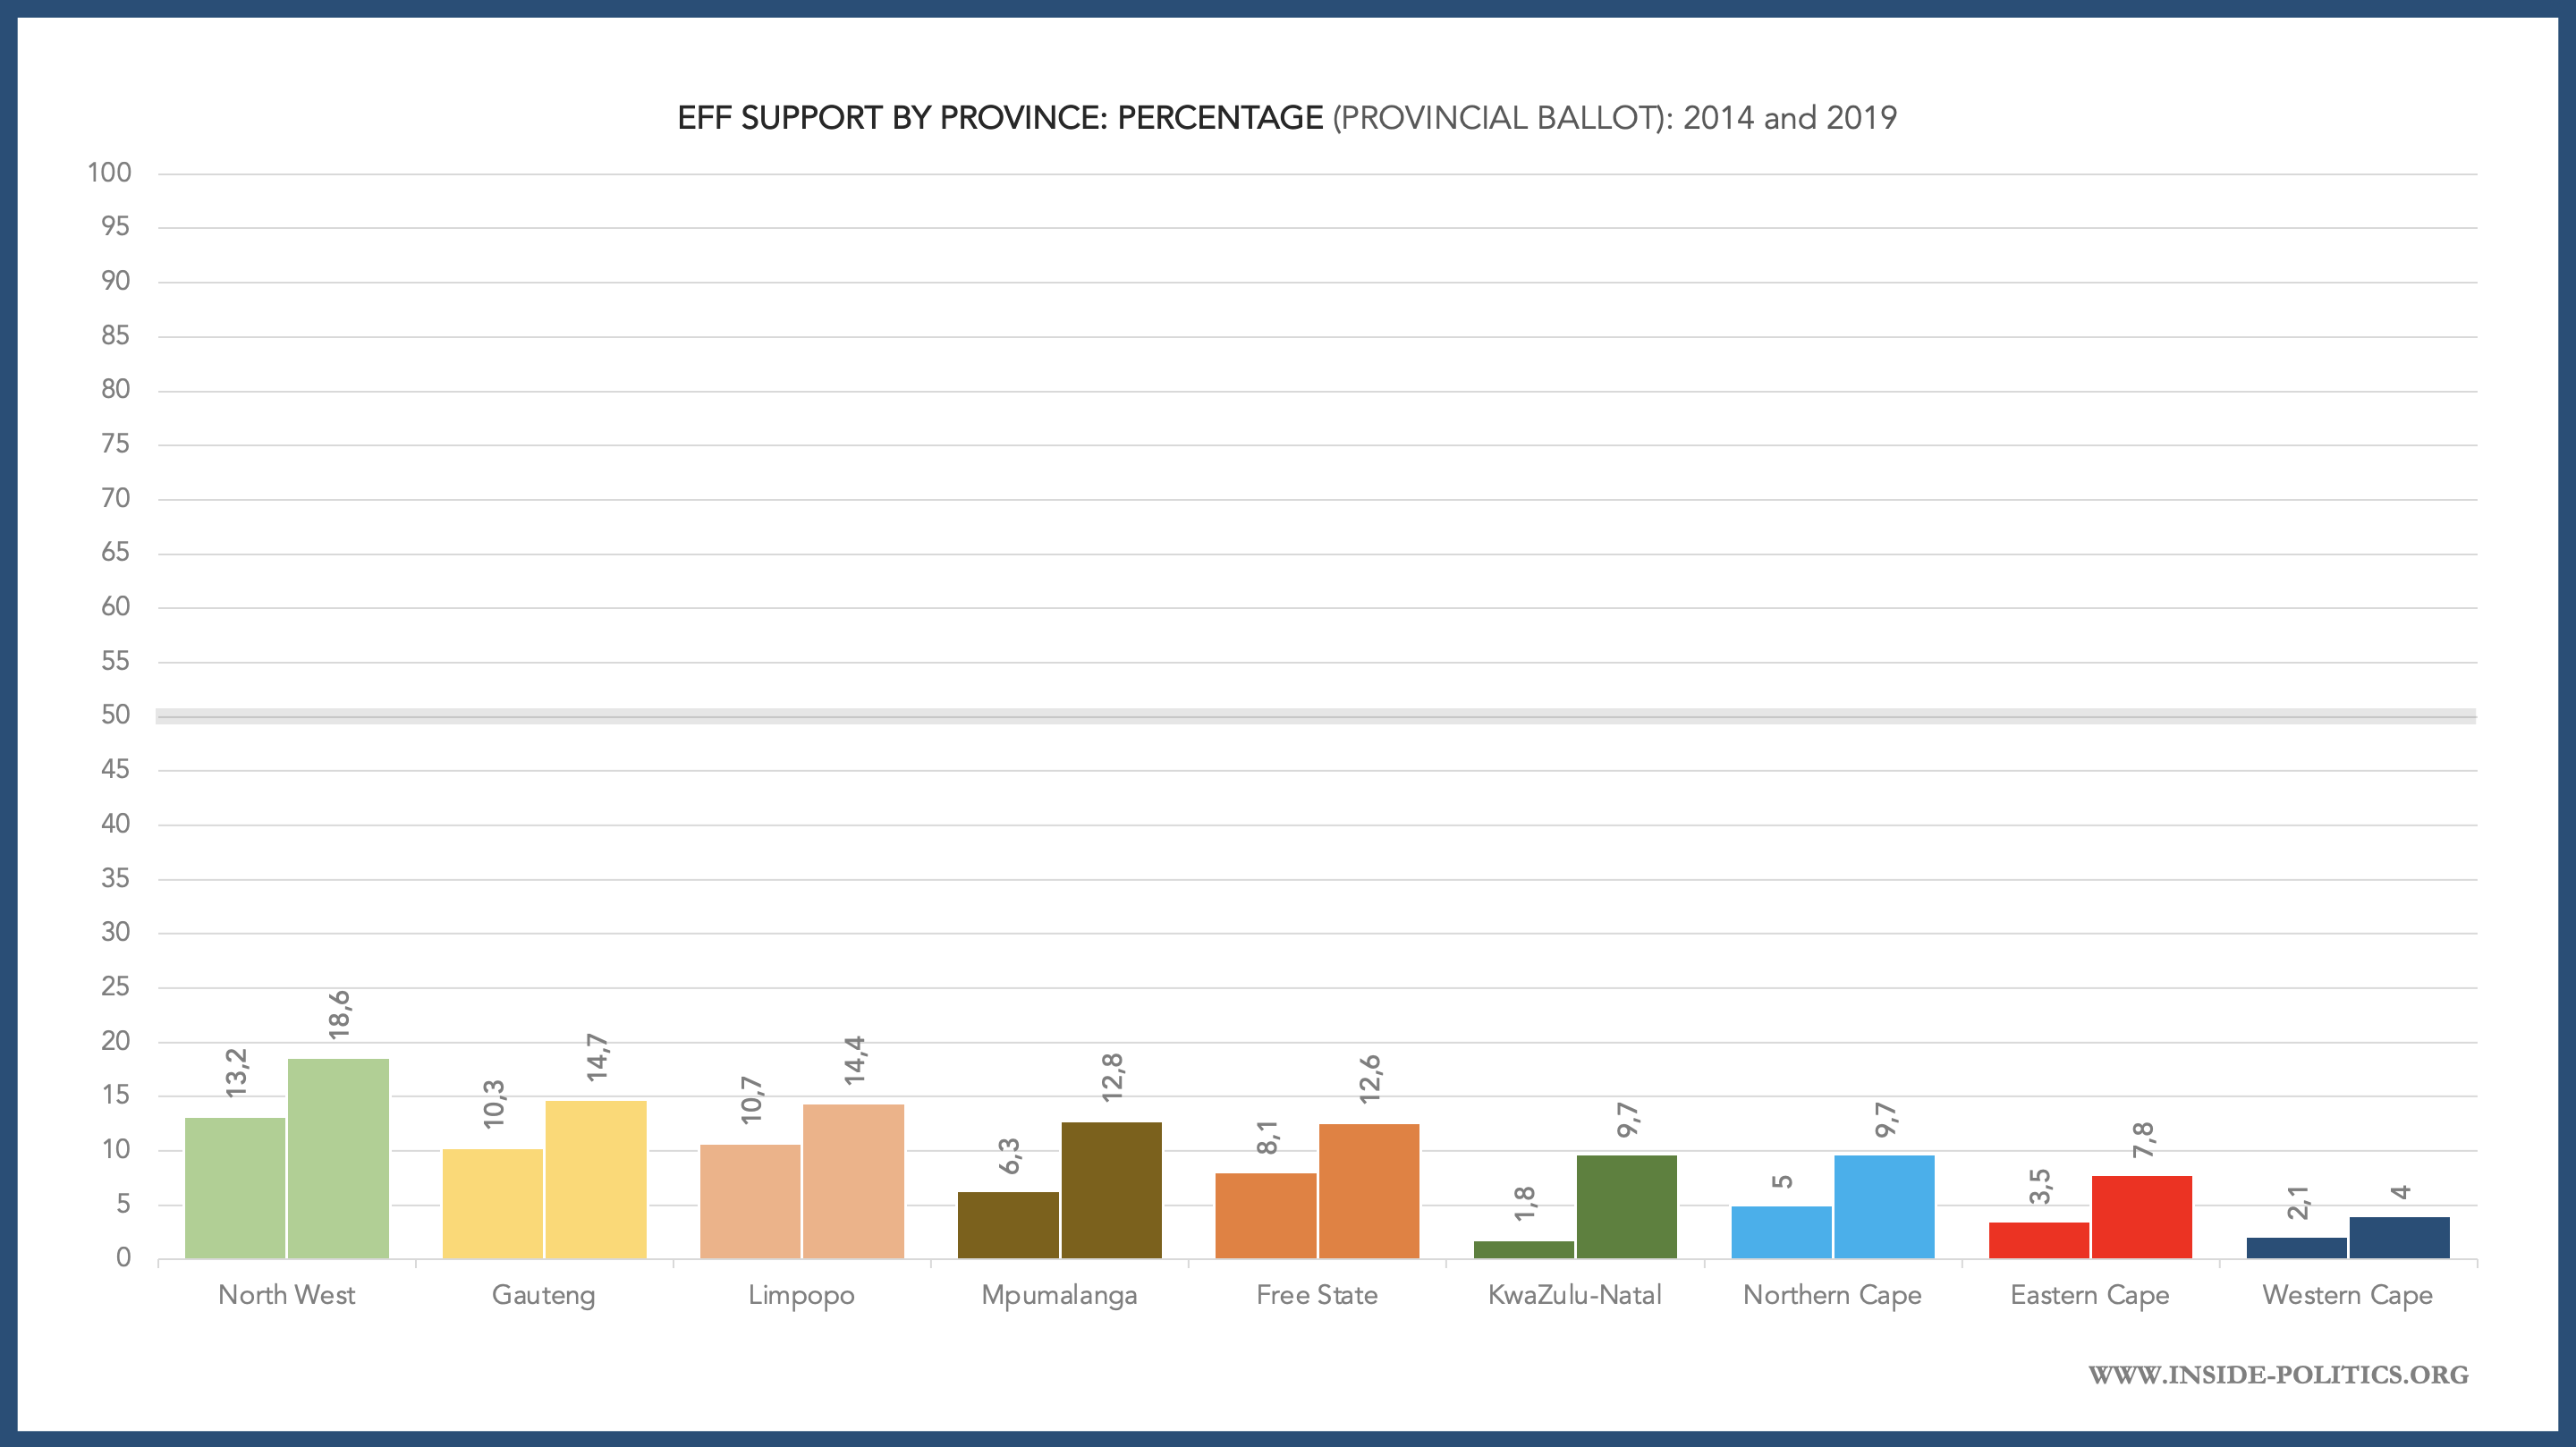
The EFF’s percentage performance has produced something of a myth: that it is a rural party – effective in but ultimately generally confined to rural areas and rural provinces. As we shall see, this is not true.
For one, the EFF’s percentage performance only tells half the story. The graph below shows how many actual votes the EFF got per province (on the provincial ballot), as opposed to its percentage. And suddenly Gauteng and KwaZulu-Natal absolutely dominate.

Below is a table that sets out all of the EFF’s provincial growth in 2019. It had a very good election. Growth in every province, in percentage and absolute terms. But you quickly understand why Gauteng and KwaZulu-Natal really dominate. And why the EFF’s 2019 performance was largely about KwaZulu-Natal. It relatively exploded in that province. Growth of almost 400%.

In fact, as a proportion of all EFF provincial growth in 2019, KwaZulu-Natal comprised 35%, and Gauteng 23%. Together, almost 60% of all EFF growth.
(The EFF has not yet cracked the code for ANC voters in the Western Cape – South Africa’s other province with a huge urban centre – and, frankly, shows little interest in doing so. Subject for a different analysis perhaps. But if it ever did, it would open the doorway to another large swath of potential EFF voters.)
The EFF’s 2019 KwaZulu-Natal result was the consequence of a massive effort on its part. It has poured a disproportionate amount of time, money and effort into the province since 2014, and much of its communication has been designed to address the KwaZulu-Natal voting population in general and ANC KwaZulu-Natal voters in particular.
As a result of this, KwaZulu-Natal, as a percentage of all EFF support, has moved into second place, when we look at how the EFF’s total support breaks down per province, as the graph below demonstrates. In 2014, some 40% of EFF support came from Gauteng, with all other provinces small contributors by comparison. In 2019, on the back of the EFF’s huge KwaZulu-Natal growth, it grew from 6% to 18% and Gauteng shrank to 33%.

So, how did the EFF grow? One helpful comparative point is turnout. Below is a graphic that maps the EFF’s provincial support against provincial turnout.
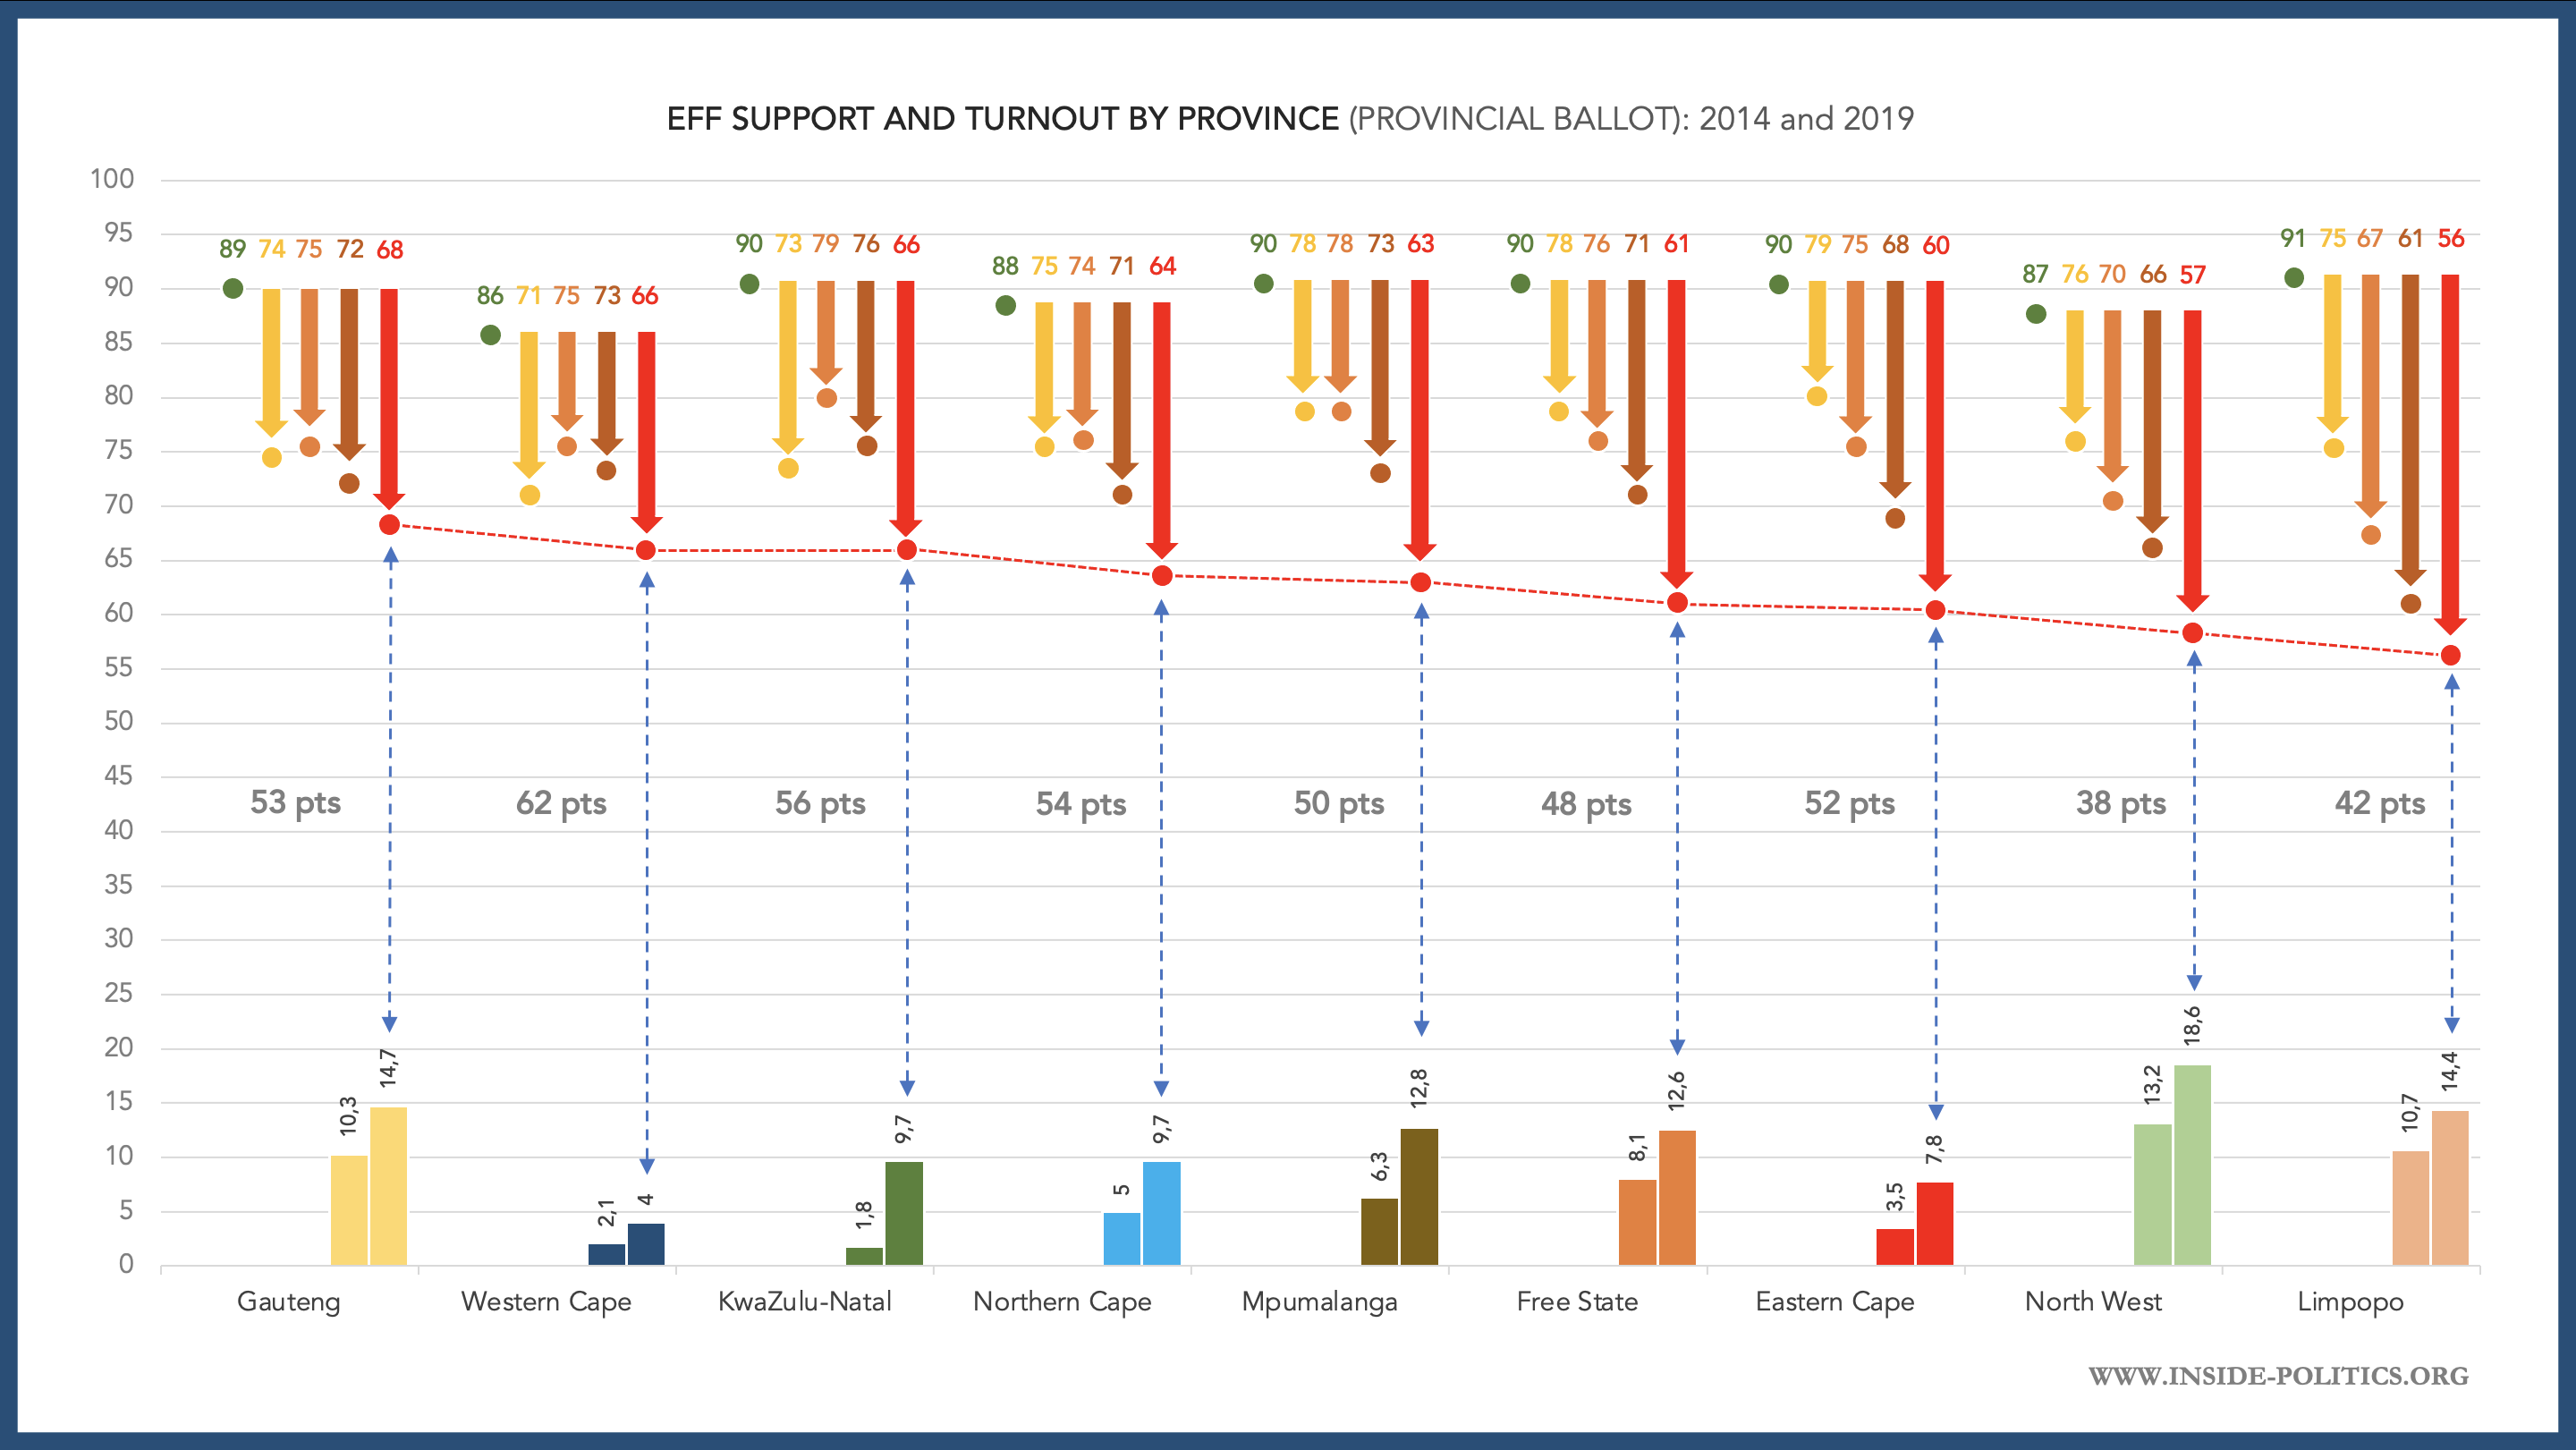
Where turnout is lowest (and ANC voters most depressed) – in places like the North West and Limpopo – the EFF does best (the gap there being around 40pts). When the gap gets to around 50pts and above, the EFF generally fares relatively worse. This graphic suggests the EFF’s potential in places like Gauteng, is much higher if turnout drops.
But turnout is dropping everywhere, so this is a relative comparison (as the EFF’s universal growth demonstrates). It is generally true the lower turnout goes, the better the EFF does; but that does not mean the EFF cannot compete in relatively higher turnout scenarios or in different environments.
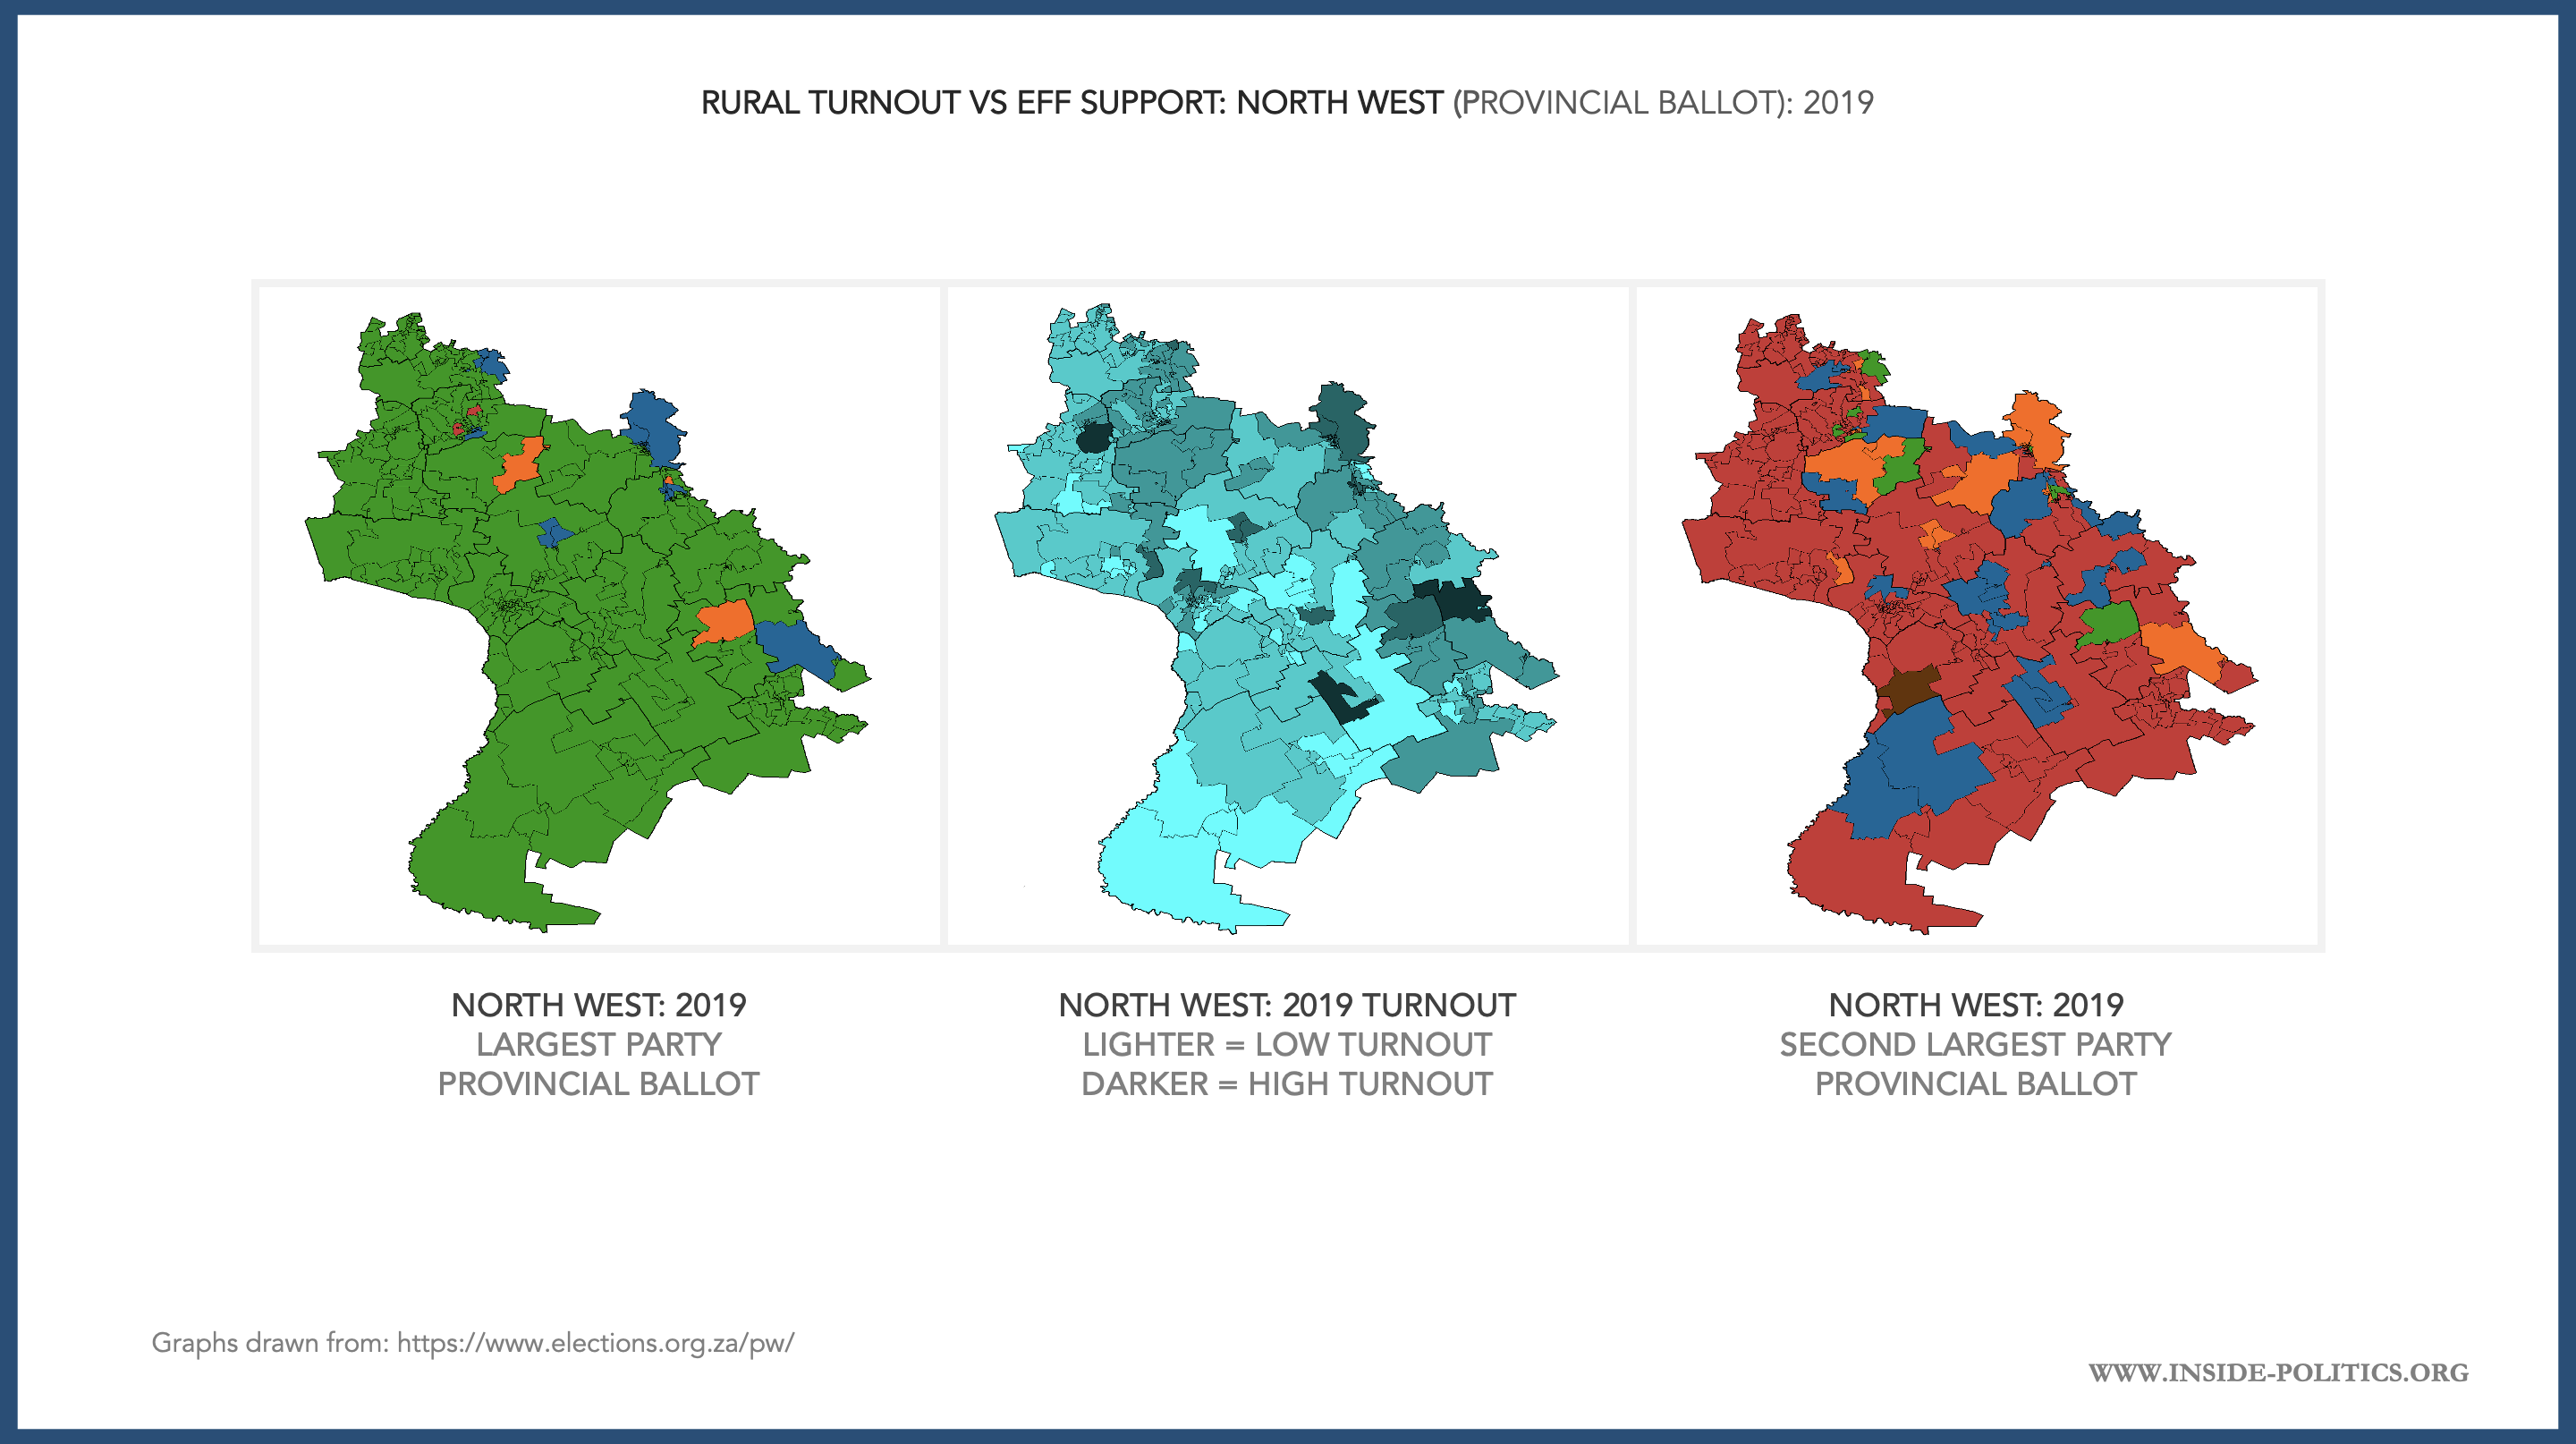
Let us look at three different environments: A largely rural environment (the North West, the EFF’s best performance in percentage terms); a semi-rural environment (KwaZulu-Natal, the EFF’s biggest growth point) and an urban environment (Johannesburg, part of the EFF biggest constituency, Gauteng).
To illustrate the nature of these different environments, below is a helpful map, produced by South Africa Gateway and Mary Alexander. It shows the distribution of South Africa’s population (based on 2011 census data). The North West is generally light (low density), much of KwaZulu-Natal is orange (medium density) and Johannesburg, and Gauteng generally, red (high density).

Let us start with the North West, below. The first set of maps shows 1. the ANC’s support in 2019 (green), 2. turnout (from light – low – to dark – high), and 3. the EFF’s support (red). Turnout is generally low, and the EFF’s support broad and overlapping with the ANC.
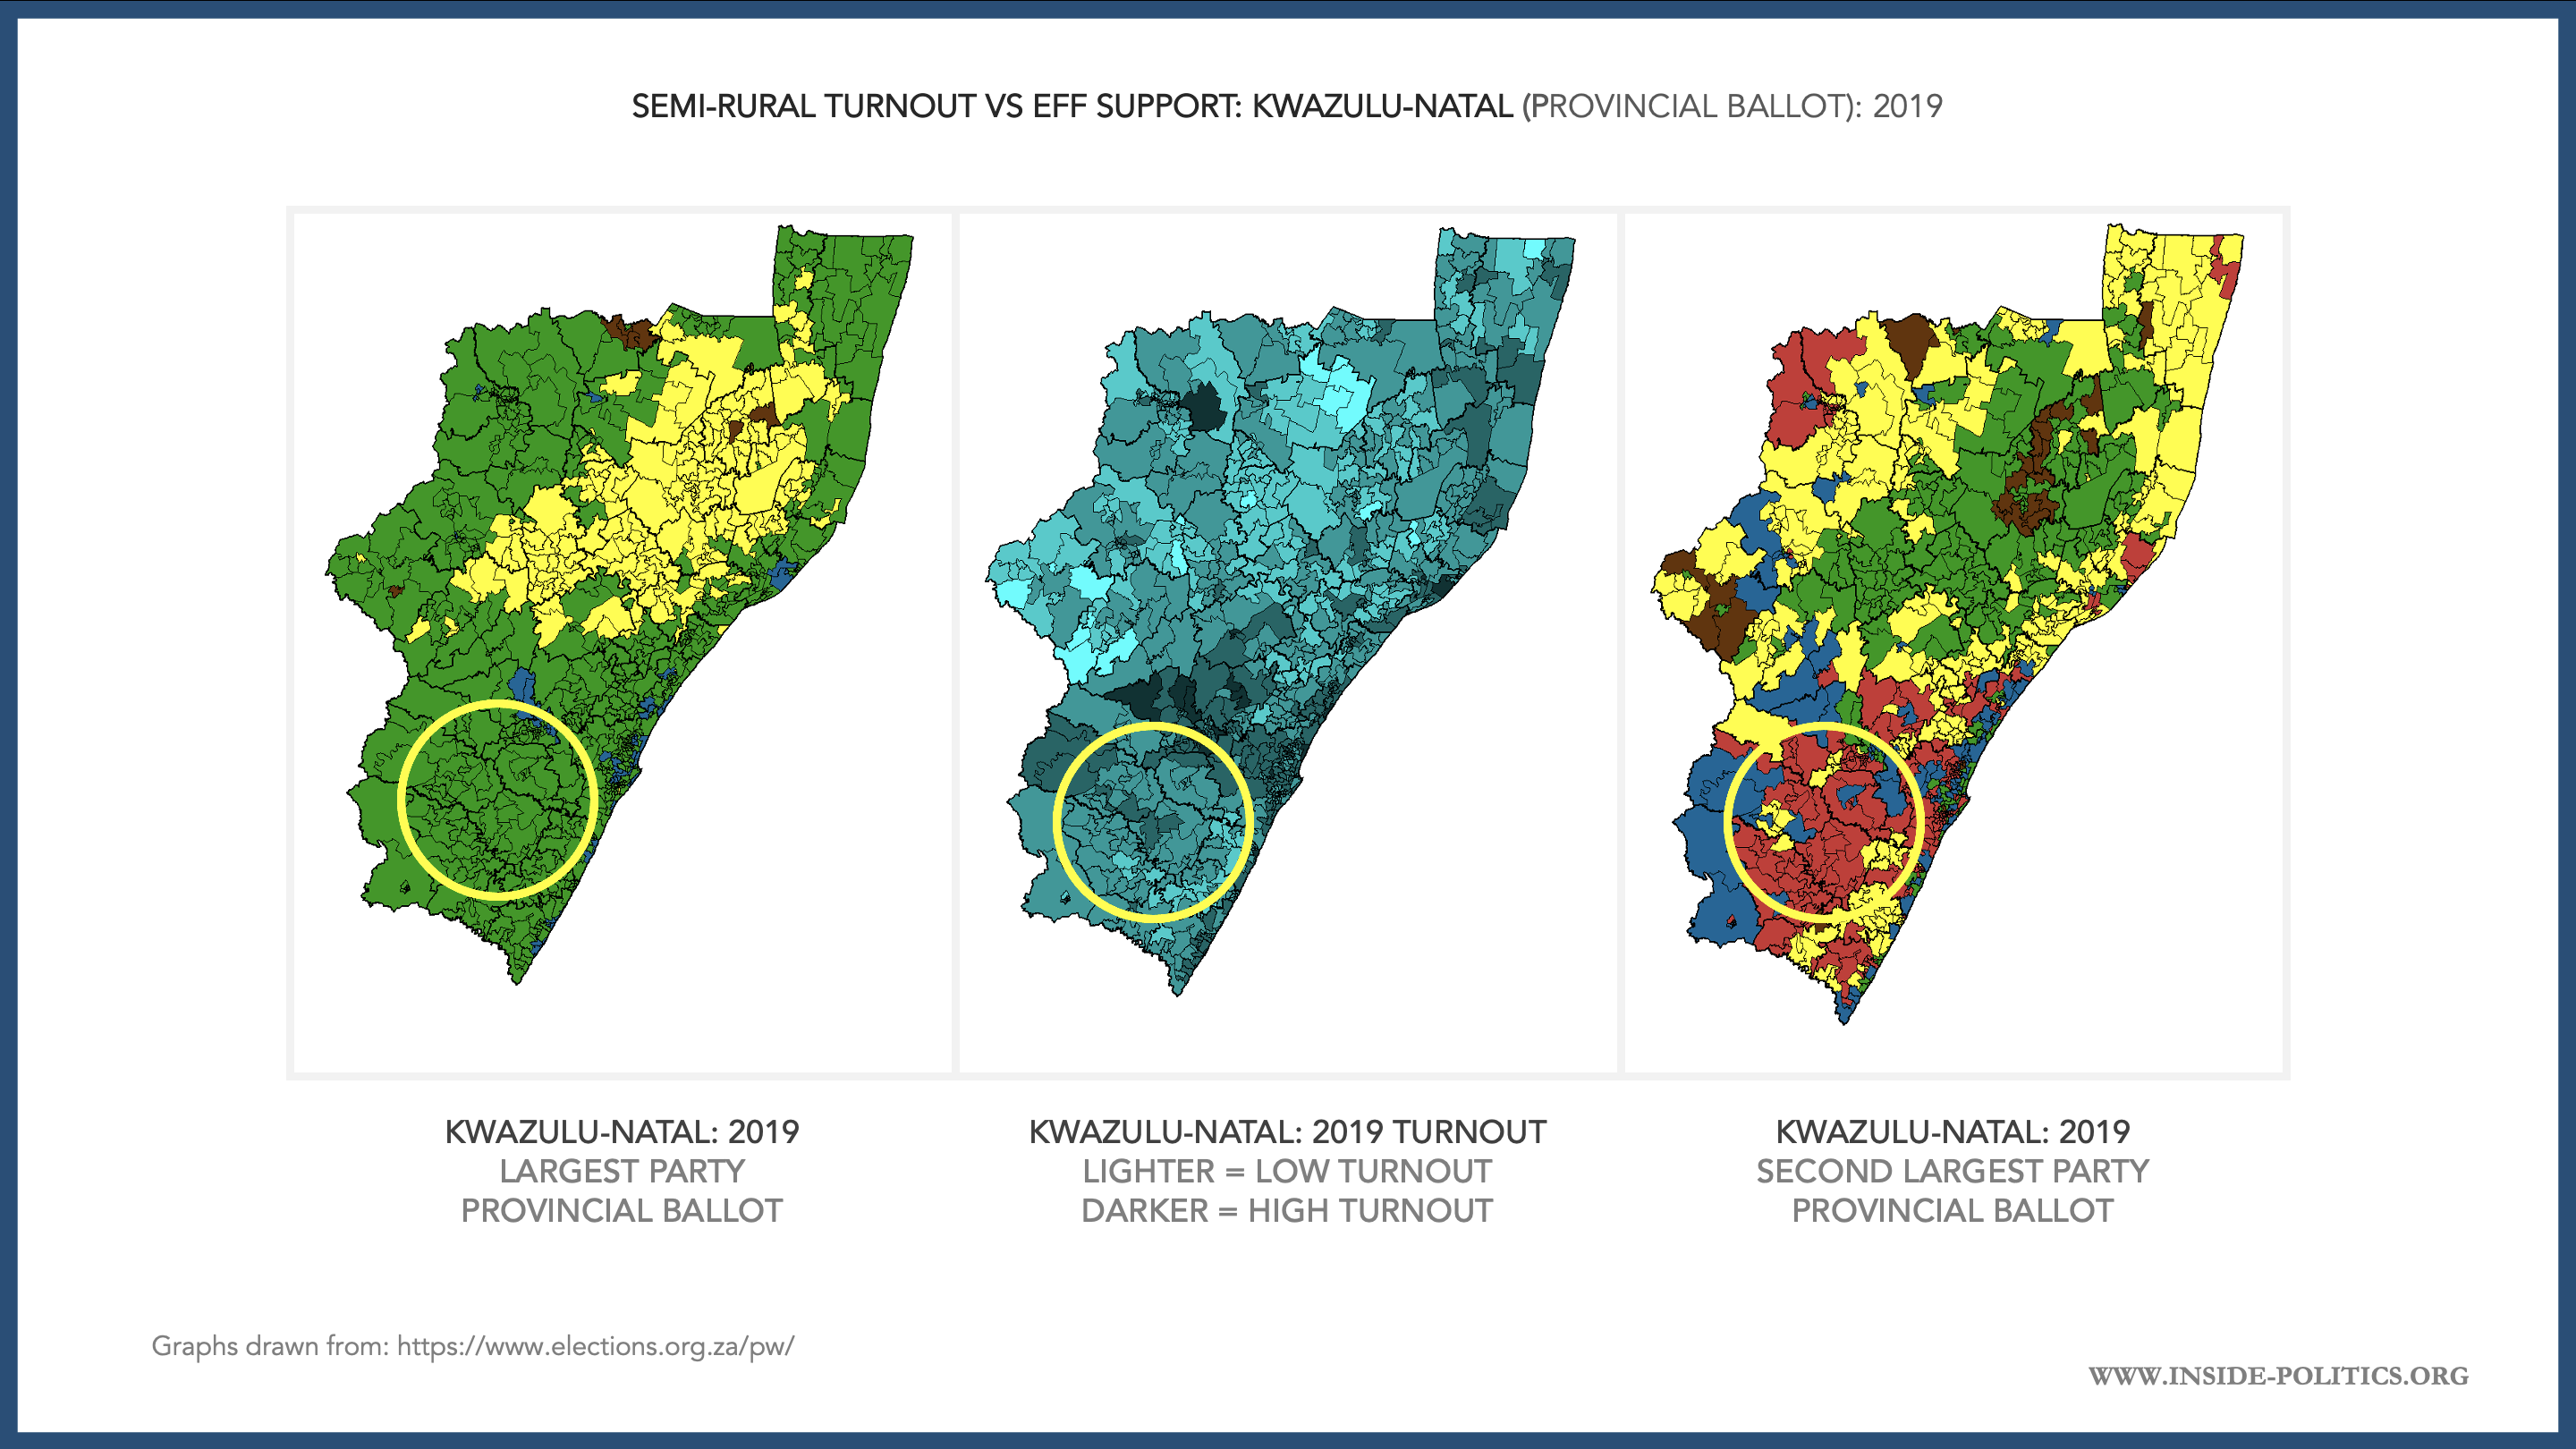
The second set of maps, below, are for KwaZulu-Natal. Essentially, turnout improves a bit, but is still low, and the EFF is eating right into the heart of the ANC’s support in the province. In a semi-rural environment, the EFF is relatively thriving.
The third set of maps, below, are for Johannesburg. Again, the EFF’s support overlaps almost perfectly with that of the ANC, in the South and the South West (Soweto). And, again, turnout is relatively high.

The key takeaway here is that the EFF is truly a national party, in a way most new parties never are. It is competitive in every province, it is growing, and it can compete in rural, semi-rural and urban environments.
The obvious common thread here is not necessarily turnout, although it does influence EFF performance, but the ANC. It makes sense: the EFF was born of the ANC, it is ideologically a more radical version of the ANC, and it primarily targets alienated ANC voters.
But just how effective was it, in 2019, at converting ANC voters? Of course, not every EFF vote comes straight from the ANC – we can never know the exact percentage – but the evidence suggests there is a powerful correlation between the performances of the two parties. The graphic below compares the EFF’s provincial gains in 2019, to the ANC’s provincial losses.
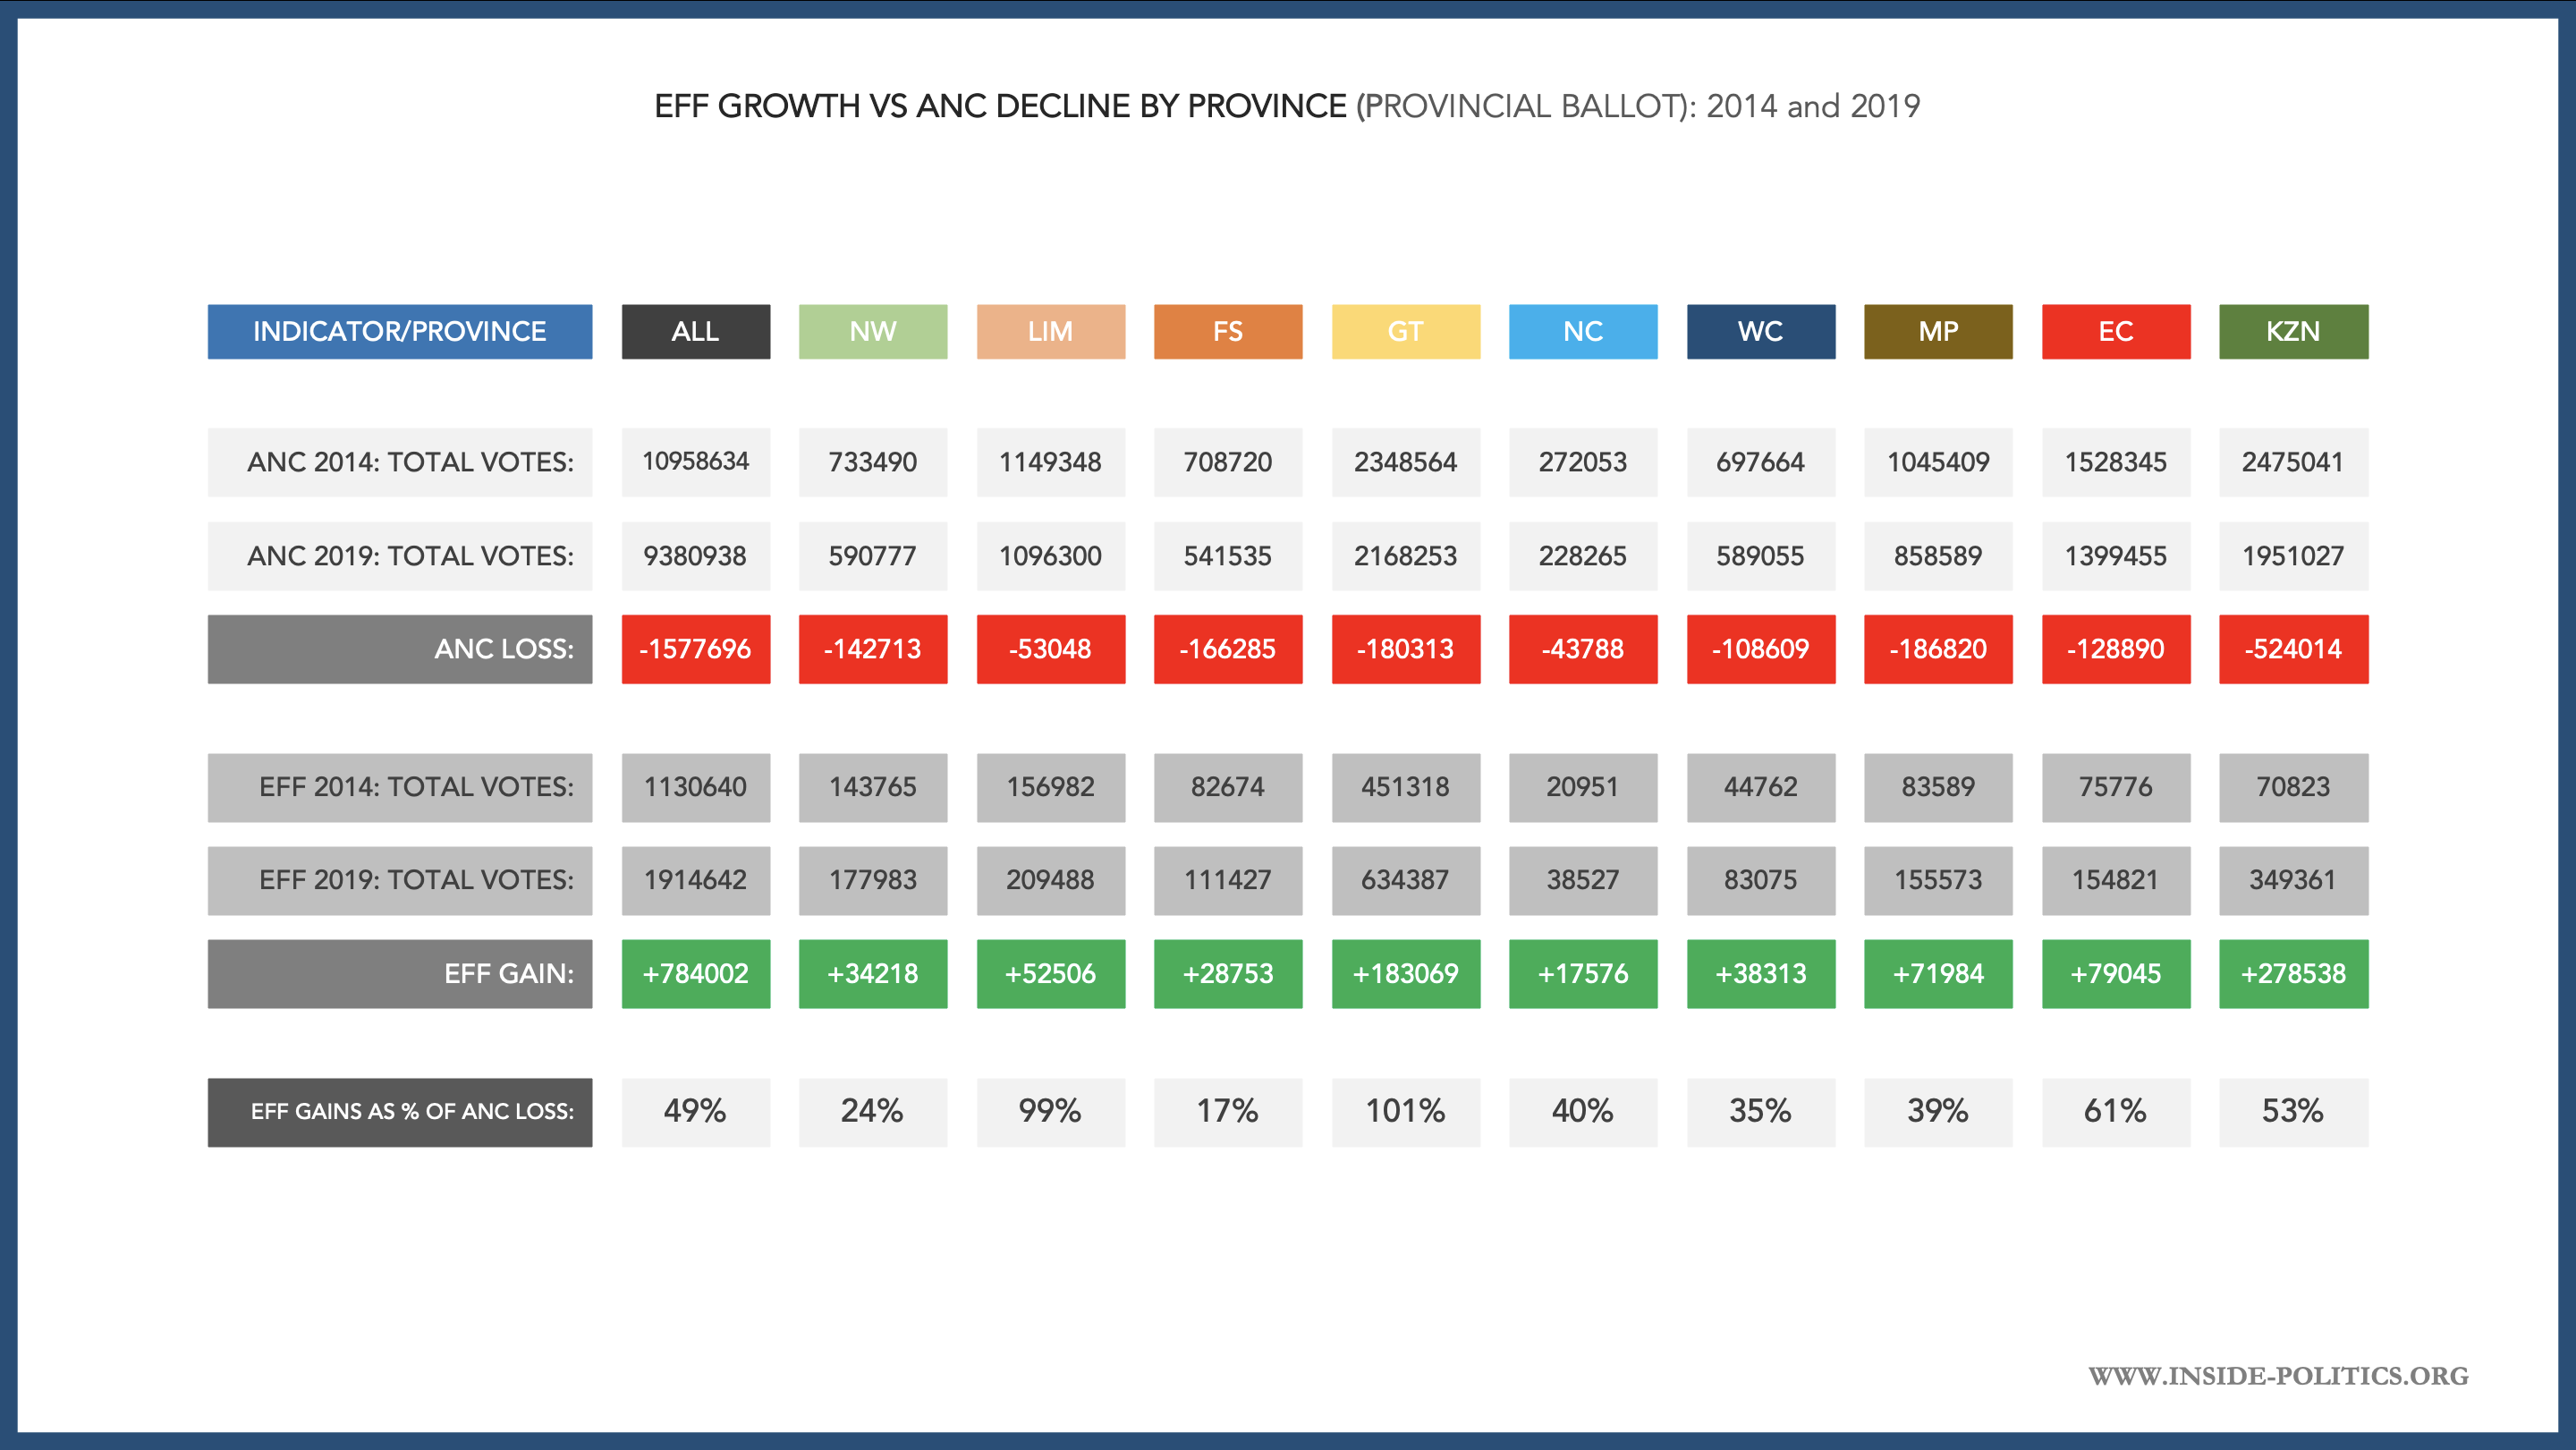
In most provinces the EFF’s growth comprises around 20%-40% of the ANC’s decline. In two provinces – Limpopo and Gauteng – its growth mirrors the ANC decline exactly (100%). And in two others – the Eastern Cape and KwaZulu-Natal – it is above 50%. Those are all huge overlaps. Even if not a precise sum, it remains a powerful data set.
Given its overlap in support and its growth correlation with the ANC’s decline, it is fair to say the EFF is the party most able to eat directly into the ANC’s support, and most effective at it.
That is of course a double-edged sword. If the EFF relies on ANC alienation, and a message that is primarily shaped around anger and discontent, it will only ever be as strong as the ANC is weak. So long as the ANC remains in decline, the EFF will continue to grow. If the ANC is able to inject any amount of enthusiasm into its support base, or stability into the organisation and its performance in government, the EFF vote share will suffer as a result.
Finally, it is helpful to maintain some perspective. In the big picture, the EFF remains a relatively small party. This is best illustrated by comparing the EFF’s total votes to the pool of total registered voters, for each national and local election, as the graph below does.

2019 did see the EFF grow its proportion of all registered voters to 7%. 2021 saw it drop back to around 5%. In 2024, the EFF will really want to try and push this number into double digits. That will require it to grow by around 1m votes.
The key takeaways from this analysis are the following:
- Data on the EFF is limited, but it had a very successful 2019 election. It grew in absolute and percentage terms, both nationally and in every province.
- That growth was primarily driven by an explosion of EFF support in Kwazulu-Natal, where it grew by almost 400%, primarily in ANC strongholds. Its growth in that province was responsible for 35% of all its 2019 growth.
- Although in percentage terms the EFF’s best performance was in rural provinces, in terms of absolute votes, the EFF vote share is dominated by Gauteng (33% of all EFF support) and KwaZulu-Natal (18%)
- An analysis of where it grew demonstrates an ability to succeed in rural, semi-rural and urban environments, as well as in both low and moderately high turnout environments. The EFF has thus cemented itself as a truly national party.
- There is, however, a general relationship between lower turnout and higher EFF support, where the EFF does best in low turnout environments.
- There is a great deal of data to suggest that the EFF is the most effective party in South Africa at eating into and converting ANC support. It seems to feed, almost exclusively, off the ANC. And its performance in KwaZulu-Natal suggests it quite capable of making further significant inroads into the ANC vote, in that province, in 2024.
- The EFF’s relationship with the ANC is a double-edged sword. It can thrive when the ANC is in decline both electorally and as an organisation, but if the ANC is able to enthuse its core support base, this will hurt the EFF’s ability to grow further. Certainly the latter is a national circumstance the EFF has never had to face.
- Finally, in the big picture, the EFF remains a relatively small party. Another election of significant growth will really establish it as substantial. But that, as with everything EFF, would seem to rely on the ANC more than anything else.
All numbers in this essay are drawn from the Independent Electoral Commission website: https://www.elections.org.za/pw/
This essay is the 6th in an on-going series on Election 2024, for all other editions of this series, please click here: Election 2024
Discover more from inside politics
Subscribe to get the latest posts sent to your email.

You must be logged in to post a comment.